Marcel Stötzel, manager of the Fidelity European fund, is backing Ryanair and Legrand but is pessimistic about industrials.
European equities have lagged their US counterparts in recent years, but as a result, valuations in the region look comparatively more attractive.
One example of a cheap and cheerful European company is Irish airline Ryanair, which Marcel Stötzel added to his £4.4bn Fidelity European fund in the past 14 months.
“Ryanair stocks are much like Ryanair flights”, he said: both exceptionally cheap but quite turbulent. Indeed, the stock has a current price-to-earnings (P/E) ratio of 14.8%, with a share price of just €16.58.
Ryanair’s share price YTD
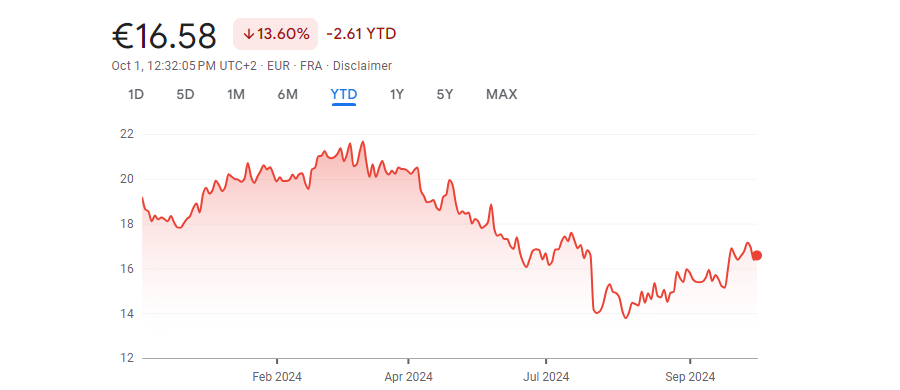
Source: Google Finance
Ryanair remains one of the lowest-cost providers in the highly commoditised short-haul flight industry. Its low prices are one of its strongest competitive advantages because many customers will still buy Ryanair flights despite negative perceptions of its performance and customer experience.
“It’s the only product I’ve ever seen that has conditioned its customers to expect a poor experience, yet the customers keep coming back. The implication is that they can get away with things that competitors such as British Airways cannot,” Stötzel said.
Moreover, Ryanair is taking advantage of the supply and demand crisis facing airlines in the post-pandemic market. Several flight providers either went bankrupt or scaled down capacity during the pandemic, and the sector is yet to recover fully.
As a result, there is a dissonance between subdued supply and high demand leading to many businesses ramping up prices. Consequently, the price gap between Ryanair and competitors such as British Airways is widening.
“If you’re a player like Ryanair, if everyone else is keeping pricing high, you can make even more money because your costs are going down and your prices are going up,” he added.
Ryanair is far from the only unloved company in Stötzel’s fund. He is also investing in beneficiaries of the artificial intelligence (AI) boom that he believes the market does not fully appreciate.
Legrand, a French electrical plug and socket provider, is the third-largest holding in his portfolio. Legrand distributes less sophisticated products than industry leaders such as Schneider and its products are used at a much later stage in the data cycle. Nonetheless, it is still a crucial enabler for AI so has considerable growth potential. Despite that, Legrand is trading on a P/E ratio of 20x compared to 34x for Schneider.
Legrand’s share price YTD
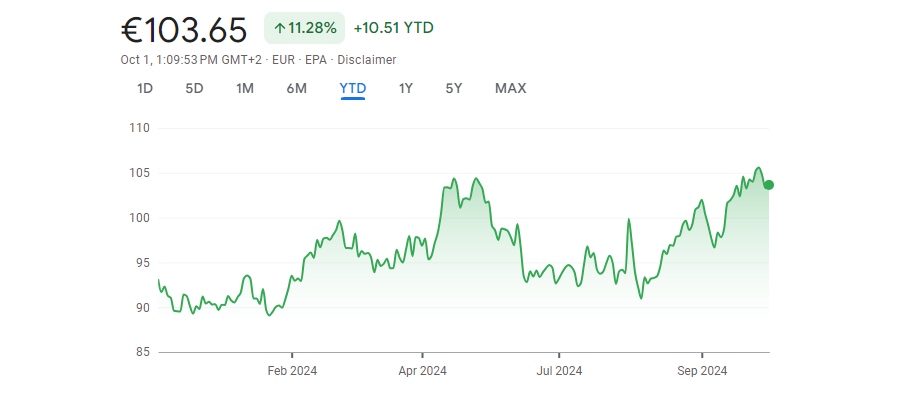
Source: Google Finance
On the other hand, Stötzel does not share the broader market’s enthusiasm for European industrials, particularly capital goods companies. Their earnings forecasts are above long-term margins, even though macroeconomic data suggest that international markets such as the US are facing an economic slowdown.
In other words, there is a dissonance between the market backdrop and what industrial stocks are reporting. “What we know is happening for sure is bleak, but margins and multiples don’t reflect that,” he said.
European industrials that serve the US market expect to benefit from US government stimulus such as the Inflation Reduction Act, but Stötzel thinks the forthcoming presidential election could delay government spending and said decisions at the state level may take longer to get approved. “The market is underestimating the potential for pain in the short-term and overestimating how quickly long-term trends can ramp up,” he said.
Nevertheless, Stötzel remains cautiously optimistic about European equities. Despite all the volatility that has characterised Europe this year, not least due to the turbulent French election campaign, the Euro STOXX 50 has gained ground and at some points, even surpassed returns from the S&P 500.
Performance of European and American indexes over the past year
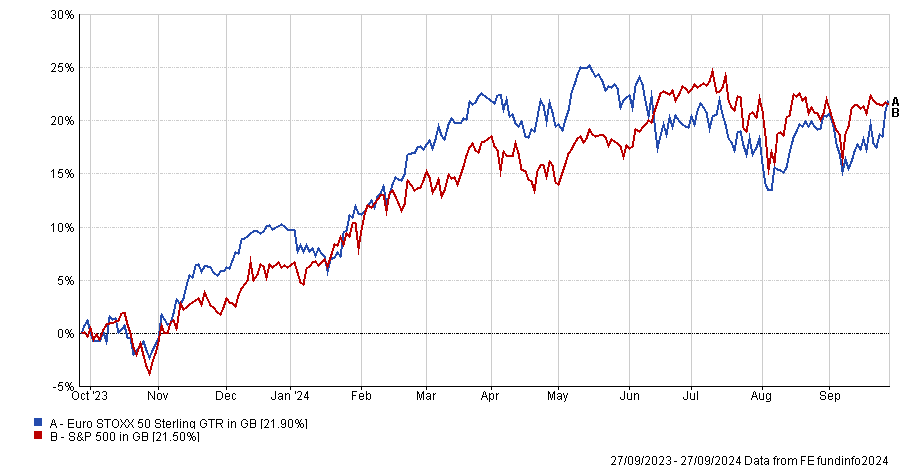
Source: FE Analytics
Companies like Ryanair and Legrand are poised to take advantage of growth opportunities in popular and globally relevant sectors, yet they have retained consistently lower valuations. Consequently, while there is a lot of “doom and gloom” around Europe, it is far more than a “graveyard index”, with attractive opportunities to make supranormal gains. “If you pick stocks correctly, you can even outperform the mighty S&P 500,” he concluded.
Markets saw a broadening out at the end of the first half. Is this a longer-term trend or a short-term phenomenon, and could diversified strategies be a prudent solution for current market dynamics?
The first half of 2024 has been marked by mega-cap performance and heavy concentration within market cap-weighted benchmarks.
The Fed Funds rate has remained unchanged for longer than the market previously anticipated as inflation continued its stubborn resistance during the first six months of the year.
As a result, many investors have steered capital into benchmark-driven strategies that are dominated by mega-cap companies with extensive cash balances. As this phenomenon has played out, it’s important to analyse risk across client portfolios and consider broadening exposure. We are now starting to see signs that this rotation may be beginning.
Overly concentrated equity market?
The S&P 500 Index has the highest concentration in 30 years within its top 10 names, which contributed to 72% of the total return of the S&P 500 year-to-date up to 30 June.
Overlap has tripled between the S&P 500 Index and the Nasdaq 100 Index over the past two decades and the common holdings represent 95% of the weight of the Nasdaq 100 Index, as at 30 June. Meanwhile, the ‘Magnificent Seven’ contributed to over 50% of total risk in the Nasdaq 100 on a one- and two-year basis.
The S&P 500 Index outperformed its equal-weighted version in the second quarter by 6.9% as mega-caps dominated. This is one of the largest divergences ever (7.1% in the first quarter of 2020 was the greatest).
Market imbalance in the US is the highest it has been in 100 years, as measured by the largest US company relative to the 75th percentile by Goldman Sachs research. As seen below, this trend seems to be turning.
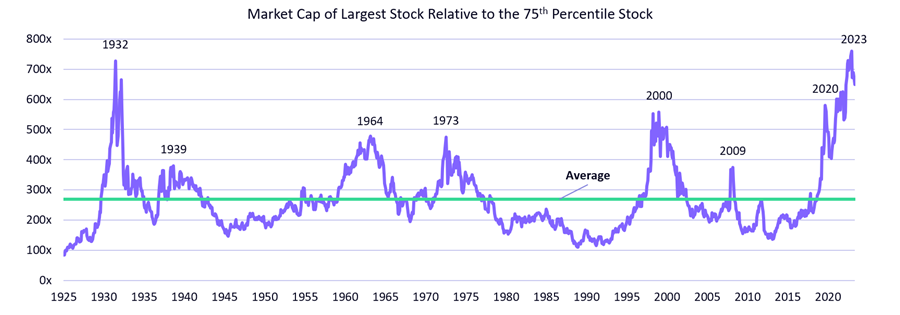
Source: ARK Invest
Broadening out?
But is this an anomaly or emblematic of a rotation that is beginning to crystalise? 11 July offered a striking example of this broadening out as CPI came in at -0.1% month-over-month, signalling that the US Federal Reserve could shift more quickly into dovish policy.
The Nasdaq composite – held up by cash-rich mega-caps – lost roughly 2% on the day, while the Russell 2000 – representing small-cap stocks – gained 3.6%; the largest single-day differential in the past 30 years.
Another clear example: stocks associated with multiomic technologies, which tend to be long duration in nature based on the earlier-stage profile of underlying companies, were up 5.6% on the day.
We believe that the broadening out is taking shape and that diversified investment solutions will help portfolios achieve enhanced risk-adjusted returns in various market scenarios.
Where do we go from here?
Importantly, a broadening out trade can be accretive to client portfolios in more than one market scenario.
Catch-up scenario: In this risk-on scenario, the positive momentum of a more diversified set of stocks will lead to a narrowing of the performance gap to mega-cap stocks in an upside market.
Catch-down scenario: On the other hand, investors may be wary of the potential for downside pressure after many market-cap-weighted benchmarks recently hit all-time highs. A market downturn could be triggered by weakness in the Magnificent Six (we exclude Tesla believing it to be more of a robotics company than broader tech), potentially due to the interconnected nature of their sales and earnings and/or a falling rate scenario that no longer rewards companies with extensive cash balances, leading to a narrowing of the gap as a diversified set of stocks loses less than the mega-cap names.
Of course, there is a potential that forthcoming data points, whether related to inflation or employment, may reduce the probability of the number of near-term Fed cuts, which would increase downside risk for this trade.
That said, the economic data, trend in performance, the expected path of Fed dots after September’s action, deeply discounted valuations, and technological tailwinds give us the conviction that the broadening-out trade has increasingly become a nearer-term, if not current, market event.
Thomas Hartmann-Boyce is a client portfolio manager at ARK Invest. The views expressed above should not be taken as investment advice.
Trustnet investigates whether investment companies in wind-down are a good investment.
With wide discounts across the investment trust sector, boards are looking for other ways to realise value for shareholders, including the dramatic decisions to wind-down or merge with competitors.
A well-managed wind-down can be profitable for shareholders, providing that assets can be sold quickly at a price close to fair value – or for a much narrower discount than that reflected by the trust’s share price.
For instance, abrdn Property Income agreed on 27 September to sell its entire portfolio to GoldenTree Asset Management for £351m: a 6.7% premium to the trust’s share price on 26 September but a much larger 20.1% premium to its share price on 28 May 2024 when shareholders approved the wind-down.
The share prices of investment trusts usually bounce when a wind-down is announced, which is why Charlotte Cuthbertson, co-manager of the MIGO Opportunities, tries to identify ahead of time which trusts might go down this route.
One way she does this is by looking through shareholder registers to ascertain which trusts are unlikely to pass upcoming continuation votes. Ultimately, she is looking for a catalyst that the market has not yet priced in. About 30% of the trusts in MIGO’s portfolio are going through a wind-down, she said.
Winterflood Investment Trusts has identified 17 potentially sub-scale trusts where it thinks corporate action might be in shareholders’ best interests, be that a merger or a wind-down. They include 10 equity funds, listed below, and seven alternative investment strategies.
Potentially sub-scale equity trusts
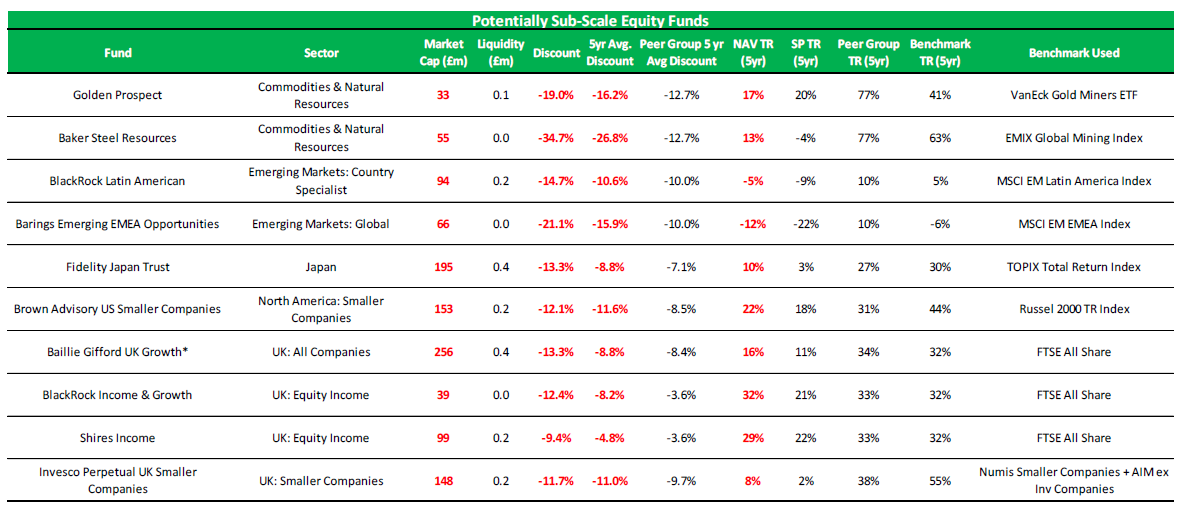
Source: Winterflood Securities, as at 20 Sep 2024
Some of the above trusts have catalysts that could lead to corporate action. The board of Barings Emerging EMEA Opportunities has said there is a “strong likelihood” that it will miss its five-year performance target to the end of September 2025. That would trigger a tender offer for up to 25% of issued shares, which would further reduce the size of the already-small trust (its market capitalisation is £66m).
Baillie Gifford UK Growth will have a tender offer and continuation vote in 2027. Elliott Hardy, an analyst at Winterflood, said this could lead to corporate action because the trust has lagged its peers and trades on a discount of -13.3% compared to the sector average of -11.3%.
Winterflood also identified three potentially sub-scale real estate investment trusts: Phoenix Spree Deutschland, Life Science REIT and Regional REIT.
This sector has seen a lot of corporate activity. “We estimate that the number of direct property-focused investment trusts has fallen from 31 to 25 since the end of 2021, with a further five due to exit upon the completion of wind-downs or mergers,” Hardy said.
Property trusts have faced multiple headwinds in recent years, including high interest rates, persistently wide discounts, macroeconomic uncertainty and cost disclosure concerns.
“Clearly, some of these headwinds are starting to lift, which may attract further interest from potential acquirers, particularly in the absence of institutional buyers given the funds’ sub-scale size,” he observed.
Amongst the small alternative investment trusts listed below, Premier Miton Global Renewables has its next five-yearly continuation vote coming up in April 2025.
Potentially sub-scale alternative trusts
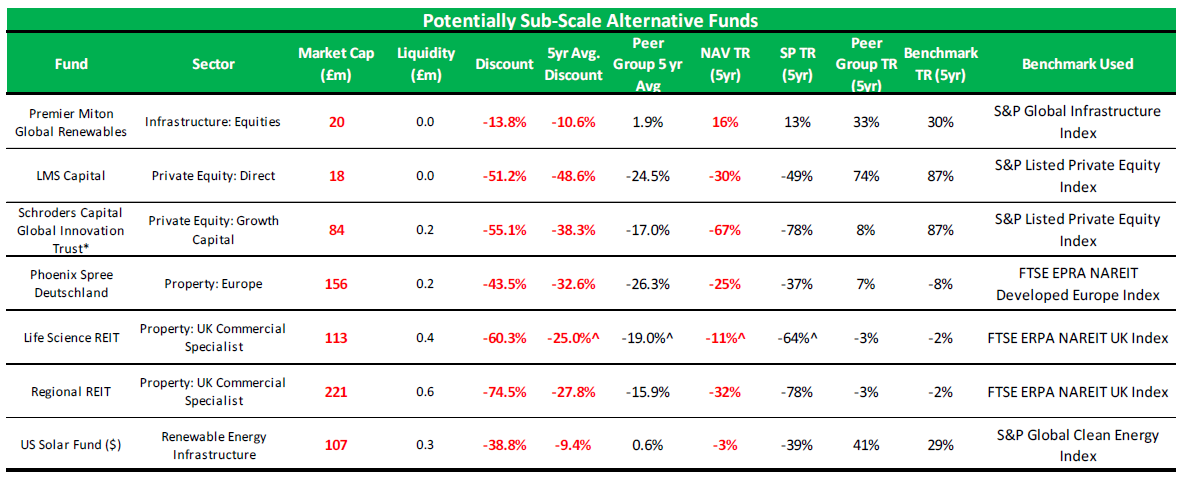
Source: Winterflood Securities, as at 20 Sep 2024
Winterflood used three criteria to identifying sub-scale trusts: a market capitalisation below £300m; a net asset value (NAV) total return that has underperformed the peer group and/or benchmark over five years; and thirdly, a discount that is currently wider than its five-year average and where the five-year average discount is wider than that of its peer group.
This methodology uncovered 37 trusts but Winterflood ruled out 20 of them because corporate action is unlikely for idiosyncratic reasons, such as a controlling shareholder disinclined towards strategic change.
The firm has a decent track record of identifying trusts that could pursue corporate action. Of the 14 sub-scale trusts it named in a May 2023 report, three are winding down, two are merging with another trust and three more have initiated a strategic review where a wind-down is one possibility being considered.
Almost 10% of the investment trust sector by number of companies (9.7%) are winding down currently, including acquisitions and companies that have proposed a liquidation. This trend impacts smaller investment companies the most; only 3.3% of the sector by asset value is in realisation, according to the Association of Investment Companies (AIC).
An additional 2.3% of investment companies have a strategic review underway (representing 0.9% of the sector’s assets). All these figures exclude venture capital trusts.
Companies that have announced a wind-down this year include Digital 9 Infrastructure Trust, Home REIT, abrdn European Logistics Income and Aquila European Renewables.
Annabel Brodie-Smith, communications director at the AIC, views wind-downs as a “positive” because “it means boards of directors are listening to shareholders and taking their views on board, which is what the investment trust structure is all about”.
Mergers are a related trend – one that Winterflood expects to gather pace due to pervasive discounts, as well as tie-ups between wealth managers, leading to a preference for larger trusts.
This has been a record year for mergers, agreed Brodie-Smith, with seven having gone through already, not counting the tie-up between Alliance Trust and Witan.
Generally speaking, shareholders prefer “larger, more liquid, more cost-effective companies [but] I think small can be beautiful, especially for specialist mandates like micro-caps”, she concluded.
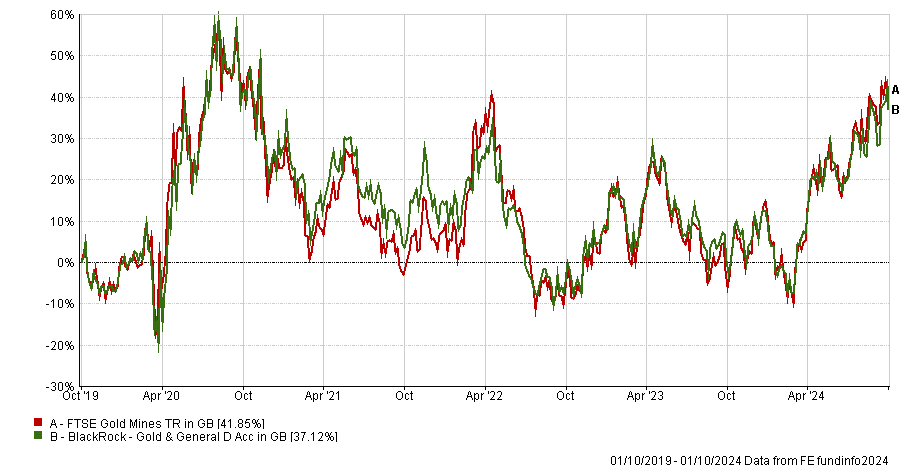
Experts expect gold prices to remain volatile into 2025.
Buying things when they are at the top is rarely a good strategy when it comes to investing, but experts believe there is an exception to this rule at present.
UK gold investors have made a 21% return so far this year, as the price of the safe-haven asset reached new highs last week, peaking above £1,990 per ounce on Wednesday, the 25th new record in 2024 to date.
The increase was driven by multiple factors, including speculative trading, sterling depreciation and supply-and-demand dynamics, which experts believe might continue to support prices into 2025.
Performance of FTSE 100 index and gold in 2024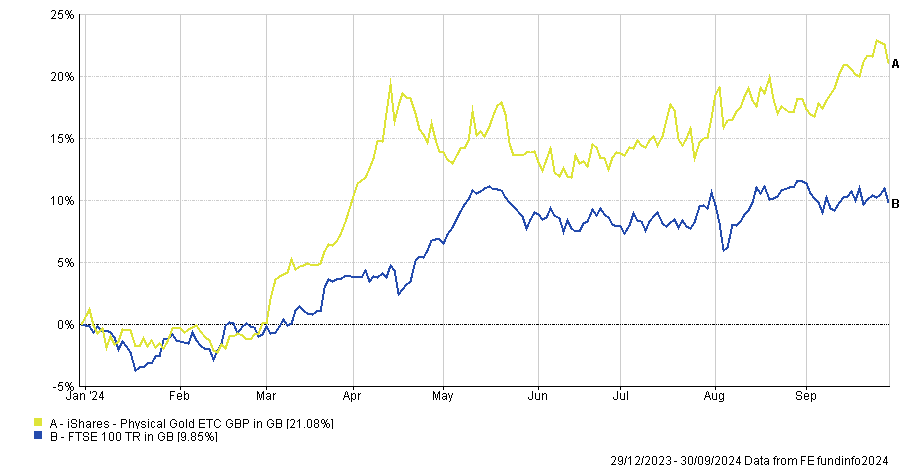
Source: FE Analytics
BullionVault director of research Adrian Ash noted how 2024's run of record gold price record highs marks the highest total since 2011 when riots in England coincided with the downgrading of US government debt and the peak of the Eurozone debt crisis.
It also matches the full-year total of 2008, when the global credit crunch became an all-out financial crisis with the collapse of Lehman Brothers.
This year, in contrast, Western stock markets also set new all-time highs, despite the wars in the Middle East and Ukraine.
"The latest gold bull market contrasts with the precious metal's jumps during both the Covid pandemic and financial crisis because Western investors haven't joined in to date,” Ash said. "The latest run was driven by speculative trading in futures and options contracts rather than by demand for physical bullion.”
For Rebekah McMillan, associate portfolio manager on the multi-asset team at Neuberger Berman, it is clear that gold prices are only going to head upwards as the precious metal should also benefit from a dovish Federal Reserve, a potentially softer dollar and declining real interest rates.
This prospect, alongside robust demand from China and India combined with the record pace of purchases from central banks, suggests “a sturdy price floor for gold”, according to McMillan.
“With the Fed beginning its policy easing, major sell-side analysts are now revising up their price estimates suggesting price risks skewed to the upside as sentiment is likely to spillover from analysts to investors,” she said.
“Furthermore, we anticipate heightened market volatility in the lead up to the US election, the potential implications for US-China relations, as well as ongoing uncertainty surrounding conflict in the Middle East, as well as between Russia and Ukraine. We believe this makes gold an attractive asset for those seeking stability in the face of geopolitical and recessionary risks.”
From an allocation perspective, Neuberger Berman has exposure to gold through an actively managed commodities strategy and maintains a long commodity position in gold within a “carefully risk-managed portfolio of tactical positions”.
As for how long this outperformance can continue, Isabel Albarran, investment officer at Close Brothers Asset Management, expects gold’s record-breaking rally to extend towards 2025.
“Expectations of interest rate cuts from prominent central banks could also support the gold price, but elsewhere, the rally could also continue not least because of a notable revival of large inflows into gold exchange-traded funds (ETFs).”
But not everyone was convinced about allocating significantly to the asset. Alastair Laing, manager of the Capital Gearing trust, was concerned about volatility.
While still seeing gold’s attractiveness at a portfolio level, which derives from its low correlation to equities and bonds, the precious metal has had such strong performance that he is “nervous about having a large amount in a portfolio”.
Instead, he prefers the “more reliable” returns of government bonds. Capital Gearing only has 1% in gold – a relatively low allocation for a defensively positioned trust.
“We wouldn't think of gold as a classic defensive asset like bonds are. If a bond price moves by 3%-4% in capital terms, that's a big movement – gold could move that much in a week,” he said.
“That's a volatility similar to an equity, so you’d want to have a sizing which is the equivalent of quite a decent single-equity holding, but not much more than that.”
Investors should also not misinterpret the high gold price as being an automatic win for producers, according to Duncan MacInnes, fund manager at Ruffer.
Mining companies should be a leveraged play on gold, but they have achieved somewhat of an “ugly ducklings” status because of “bad environmental, social and governance (ESG) credentials, bad management teams and bad mergers”.
“The last time the gold price was high, in 2021, oil was expensive and mines were facing labour market issues so their profit margins were constrained by cost pressures. This year however, gold has hit new highs but commodity prices are falling and the labour market is not as tight,” he said. “Gold miners are producing gold and printing money. That's just not reflected in the share price, in valuations.”
Investors are pulling money out of UK equities and fixed income.
Equity funds experienced their first monthly outflows since October 2023 this September, as investors withdrew a net £564m, ending nearly 10 months of record inflows, according to Calastone's latest fund flows report.
Most of the negativity was concentrated in the UK, where investors pulled a total of £666m from domestically-focused funds.
The reasons, according to Edward Glyn, head of global markets at Calastone, include the new government’s “rather pessimistic commentary about the UK economy, which appears to have put a stop to the nascent revival in interest in domestic equities that we first detected in trading data in July.”
Lacklustre performance didn’t help; the FTSE 100 ended last month slightly down, while UK small and mid-caps indices remained static in September.
Global equity income funds shed £416m and outflows from specialist sector funds accelerated to a record £512m. Here, gold-focused and sustainability-minded funds were particularly hit.
All other geographies saw decreased inflows in September – lower than August but also below their monthly averages over the year. Following “a slew of negative news coming from the Eurozone”, European equity funds experienced the largest decline in inflows, falling to £43m from a monthly average of £249m over the past year.
Global equity and US equity funds remained popular, however.
The largest outflows were in fixed income, where funds saw a £769m withdrawal – the biggest outflows from fixed income funds during Calastone’s 10-year record, excepting the pandemic crash in April 2020.
Bond markets have rallied over the past six months as prices soared while yields plummeted in anticipation of interest rate cuts.
Selling was concentrated in the first few days of the month, ahead of rate decisions by the UK, European and US central banks, as investors took profits from the bond-market rally.
Glyn said: “Expectations ran high that the US Federal Reserve would cut rates by half a percentage point in mid-September – which it duly delivered - so investors seemingly followed the adage ‘buy the rumour, sell the news’ and banked their gains.”
The company should halve its range, according to Ben Yearsley, director at Fairview Investing.
Columbia Threadneedle Investments (CT) has been among the 10 largest fund houses by assets under management since it assimilated BMO’s EMEA asset management business in November 2021. While the acquisition was mostly successful, it created some challenges that the firm has still to tackle, according to experts.
These include a very large range of funds, possibly too large, according to Ben Yearsley, director at Fairview Investing. Currently, CT has 95 funds available in the UK, plus investment trusts. In comparison, JP Morgan Asset Management has 44 open-ended funds.
“Fund managers seem largely content with how the integration went, but CT hasn’t got rid of any funds yet, which surely has to come,” Yearsley said.
“Do they need two different multi-manager ranges with 10 funds? Do they need American and American Select and North American Equity? And that's just a random brief selection. They need to halve their range.”
Another example of integration challenges was the departure of veteran manager Rob Burdett and his team earlier this year, said Darius McDermott, managing director of FundCalibre.
“Retaining key talent is always critical in such deals, and inevitably, some departures occur,” he said. “However, the situation has stabilised and the current teams are strong.”
A CT spokesperson said the acquisition brought together two business that were “genuinely complementary in both strengths and product sets” and that, despite the higher turnover this year, the team is “well-resourced”.
Turning to performance, the multi-asset team was among the worst-performing desks in the past five years, as the table below shows.
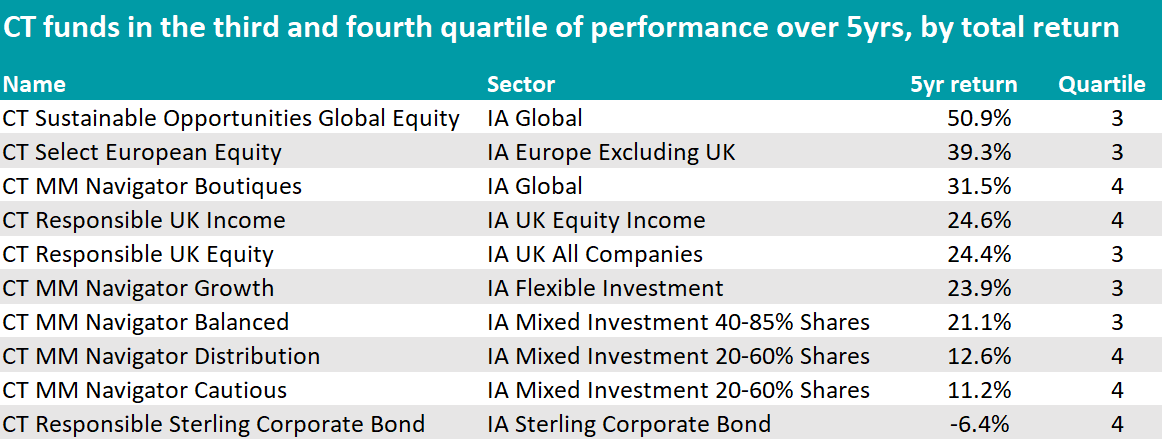
Source: FE Analytics
The CT MM Navigator Distribution and Cautious funds were close to the bottom of the IA Mixed Investment 20-60% Shares sector over the time frame.
McDermott said that for mixed-asset strategies and fixed income, he “tends to look elsewhere”.
However, Yearsley commended Keith Balmer and the team behind the multi-asset Universal MAP range, which is “very good” and charges “just 0.39% in fees”.
Among the less successful areas, fixed income was “definitely lacklustre”, according to Yearsley. “Bonds used to be a strong point years ago then [CT] seems to have lost its way a bit.”
For example, CT Responsible Sterling Corporate Bond has one of the worst track records among all CT funds, never having been able to rise above the fourth quartile of performance over the past 10, five and three years.
“UK equity income was a strong point at Threadneedle and again it feels like it’s slipped,” he continued. Here, CT Responsible UK Income came in in fourth quartile over five years, although it was in the second over the past decade and rose to the first over the past 12 months.
Many other CT strategies are working well for investors. The property team headed up by Marcus Phayre-Mudge is one of the largest pan-European real estate equity groups and is “top quality”, according to Yearsley, who highlighted CT Property Growth & Income and TR Property.
McDermott was also a fan of the “excellent” coverage of real estate investment trusts (REITs) through the TR Property investment trust and the suite of open-ended funds, including CT European Real Estate Securities.
The European franchise also has standouts, such as CT European Select and CT European Smaller Companies. The former, led by Ben Moore, has been “consistently strong” and represents a core European equities holding for McDermott.
“Moore’s patient approach has delivered some of the strongest returns in the sector, all while being less volatile than its peers,” he said.
The fund was previously managed by David Dudding, who has replicated his “strong” track record on a global scale with the Global Focus Strategy, a “hidden gem in the sector”, remaining relatively small in size despite consistently delivering “outstanding” performance, McDermott observed.
Source: FE Analytics
Both McDermott and FE Investments fund analyst Tom Green praised CT’s environmental, social and governance (ESG) funds. Green said he was impressed by Catherine Stanley, co-head of UK equities, and her colleagues’ stock-picking skills, as well as their ability to avoid “blow ups”. “Unlike most of her peers, the stock selection from Stanley’s team has been pretty good,” he said. “CT is very well resourced in the space.”
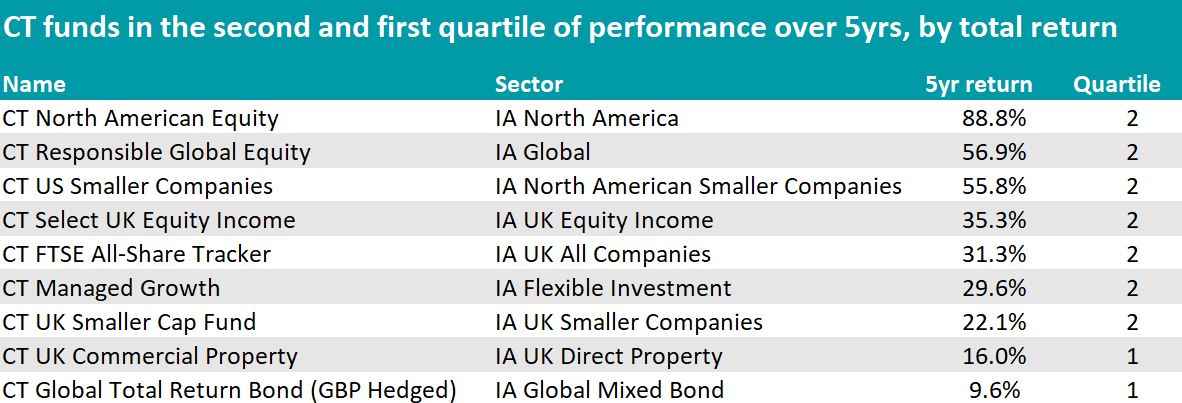
McDermott spoke highly of Nicolas Janvier, manager of the CT American Smaller Companies fund, who has delivered almost double the performance of the sector average.
Performance of fund versus sector and benchmark over 5yrs
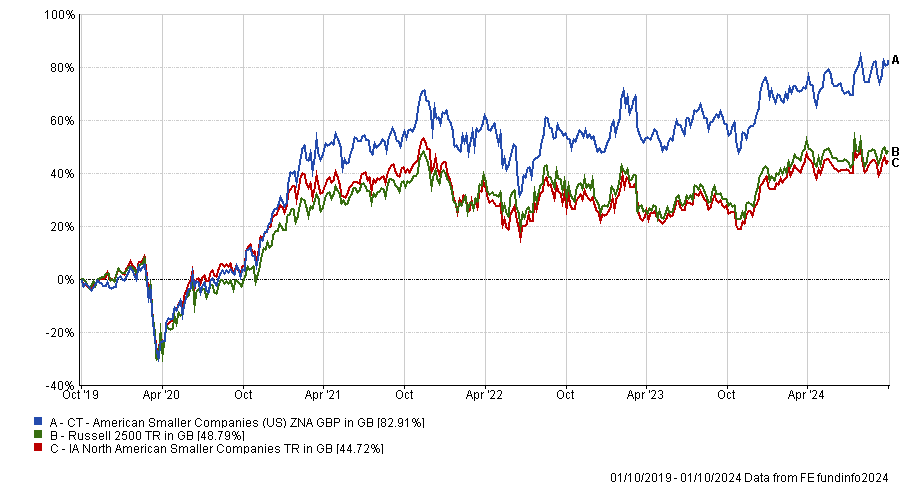
Source: FE Analytics
M&A deals continue at pace across the entire market capitalisation spectrum.
The UK continues to be a happy hunting ground for mergers and acquisitions, with a record 19 deals on the table for companies in the FTSE 350, according to data from Peel Hunt.
Charles Hall, head of research at the firm, said low valuations and willing sellers are two of the main reasons why UK companies are being bought up in their droves.
Bids worth £47bn are live, but this figure rockets to £97bn when factoring in bids announced last year and completing this year, as well as de-listings.
Of the 40 transactions announced year to date, 19 were for companies in the FTSE 350, five in the FTSE SmallCap and 14 on AIM.
Comparatively, there were 39 transactions announced in the entirety of last year, with just two from the FTSE 350, 14 in the FTSE SmallCap and 19 on AIM.
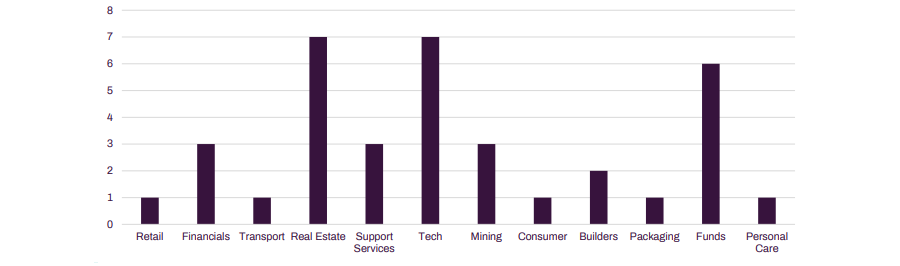
In terms of sectors, the biggest areas to be affected are tech (£10bn) and real estate (£4.5bn), as the below chart shows.
Bid activity by sector
Source: Peel Hunt
Companies representing 10% of the total value of the FTSE 250 are potentially leaving the market in the span of just nine months, including the UK’s largest fund supermarket Hargreaves Lansdown, which is included in the study as it wasn't promoted to the FTSE 100 until after its bid.
However, the effects could be even more directly felt in the FTSE SmallCap space, where stocks will be promoted to the FTSE 250 to replace their larger peers being bought up.
There was a drop in activity during the third quarter of the year, which Hall suggested was due to the normal summer lull, but he said more deals are likely in the latter half of this year.
“Given the improving economic environment and a more accommodating lending market, it feels highly likely that the elevated rate of M&A will continue,” he said.
Earlier this year Hall called on the Labour government to get to grips with rampant M&A activity, warning that the UK market will continue to shrink if nothing is done.
This time around he noted it was of particular importance for smaller companies. Typically this is solved by initial public offerings (IPOs) and although this area is “starting to emerge from hibernation”, there remain “structural issues in the UK that need to be addressed to retain a healthy UK equity market”.
“We believe we need to address the demand side, if the UK is to retain its growth companies and to ensure that the equity market is able to provide long-term growth capital. In our view this can be delivered through pension reform, ISA reform and a national wealth fund,” he said.
However, it is not all bad news. Investors in bid-for stocks have profited mightily. The average premium of these offers is 40%, with some materially higher. The report highlighted Wincanton (104% above the share price on the day of the bid), Spirent (86%), International Distributions Services (73%) and Keywords Studios (69%).
Most of the money is coming from corporate buyers (68% of the bids have come from rival firms) as the rate environment and economic outlook have become clearer, said Hall.
“It has been particularly noticeable that corporates have been the main acquirers. This suggests greater confidence in the economic outlook and the interest rate environment. It also shows the attractiveness of UK companies and the potential for synergies in a low-growth environment,” he said.
By contrast, it has been “surprising” to see relatively low activity from private equity, where an estimated $4trn remains on the sidelines.
“We expect this to change as financing conditions improve, which means that private equity is likely to be a more active acquirer going forwards,” said Hall.
Portfolio composition varies from person to person and depends on a variety of factors.
You’ve probably heard the phrase ‘the value of your investments can go down as well as up.’ Well, they do. Regularly. By the minute.
The extent to which you’re comfortable with fluctuations depends on the returns you want to achieve and over what time. The key consideration to remember is the correlation between risk and return. In general: the greater return you hope to achieve, the greater the risk of losing money.
The starting point for an investment manager in constructing a portfolio is understanding the ebbs and flows of our economy and their impact on investment portfolios.
Why are economic cycles important for investors?
Over time, economies fluctuate. They expand and contract. During expansion, indicators such as GDP, employment and consumer spending rise. Once you’ve passed the ‘peak’ when some – or all – of these measures start to fall, you’re entering the contractionary phase. That continues until you’re past the ‘trough’ when economic indicators start improving again.
Economic cycles are difficult to time but perpetuate approximately every five years.
Interest rate cycles also matter to investors
As countries’ economies expand and contract, the central banks of those countries try to keep things within acceptable boundaries.
A powerful tool they use is the setting of interest rates. When economies expand, they increase rates to have a ‘cooling’ effect. During downturns, they decrease rates, lowering the cost of borrowing, incentivising spending, and giving businesses and governments more capability to invest.
It’s a rather blunt instrument with far-reaching impacts on consumer spending power but it has proven to be effective. This is important for an investor because separate phases of economic cycles and interest rate cycles benefit different types of assets.
What equity balance is right for a portfolio?
Before you can answer this question, you need to understand what returns you hope to achieve over a specific time. You also need a clear sense of how much risk you are prepared to take on.
For example, if you’re in it for the medium term, you’re likely to have a limited appetite for risk because the shorter-term volatility of equities might not be for you.
Equities (shares in companies) perform well when the economy is growing, but poorly in contraction. In the 2008 global financial crisis, the FTSE All World Index declined by 58%.
Assets such as bonds, alternatives, and cash tend to perform more steadily, so adding them to your portfolio can insulate you somewhat from fluctuations in equities.
So, in the shorter term, a conservative approach with a higher allocation to bonds, alternatives and cash is appropriate. For a longer-term horizon, a more aggressive approach with a higher allocation to equities is suitable. Short-term volatility is not such a problem if you have an eye on longer-term returns.
There are only a few instances in the past century where rolling 10-year equity returns are negative, while for shorter rolling periods equity markets are often in negative territory.
In the past century for the US equity market there are only three periods where 10-year returns were negative, the second world war, 1970’s inflation and the global financial crisis.
Eliminating human bias in investing
Each economic cycle is different. And it's important to understand those differences and alter the make-up of portfolios to reflect the challenges and opportunities posed by a specific cycle.
When constructing a portfolio, the aim is to try to limit the impact of human bias by adopting a strict risk profiling framework, i.e. you shouldn't pick an asset or a sector simply because you like it.
Reducing bias as much as possible and the danger of over- or under-committing to risk aligns your asset allocation to match your goals over a typical economic cycle. The only problem is no economic cycle is typical, further adjustments are required.
Equities
Some equities are considered less risky than others. High-quality companies with strong fundamentals, such as consistent earnings growth, robust balance sheets and deep economic moats, are often more resilient during economic downturns. Valuation is crucial to avoid overpaying, and diversification helps mitigate risk.
Fixed Income
Bonds are a key component of a diversified portfolio. Including bonds in a portfolio should give you solid returns over the economic cycle and serve as a counterweight to the negative performance of equities during contraction or recession.
Understanding the interest rate cycle is central for fixed income investing. When interest rates rise (typically during an economic expansion) bond prices fall, during these periods interest rate risk should be reduced, and credit risk is favoured to enhance returns.
When the cycle turns and economies slow down or contract, central banks cut interest rates to stimulate growth. This stage in the cycle is best for traditional fixed income.
More interest rate risk is favourable and provides a ballast to equity market volatility. Here, government bonds and high-quality investment grade credit are favourable.
What is the benefit of alternative investments?
You can very crudely think of equities and bonds as two sides of a seesaw; there is often an inverse correlation in how they behave, particularly during recessions. Alternatives can do something different. Examples of alternative investments include hedge funds, commodities, and private equity.
We prefer liquid alternatives with a low correlation to equities and bonds and target returns in excess of cash.
Equity and bond prices often fall further and more quickly than when they rise. With this asymmetry in mind, protection against the worst periods is valuable.
‘Tail protection’ enhances overall portfolio resilience and provides a ‘smooth ride’ over a market cycle. This is particularly the case for lower-risk profiles with less tolerance for drawdowns.
Tom Hibbert is a multi-asset strategist at Canaccord Genuity Wealth Management. The views expressed above should not be taken as investment advice.
Liontrust European Dynamic, M&G Japan and Alliance Trust were among the new entrants, while Janus Henderson Strategic Bond and CT Responsible Global Equity lost their places.
Bestinvest has added seven strategies to its Best Funds List and removed eight since its last update in March 2024. Alliance Trust, which is undergoing a merger with Witan, is among the new entrants alongside three regional equity funds: Liontrust European Dynamic, M&G Japan and JPM UK Equity Core.
Two exchange-traded funds also made the grade: SPDR MSCI ACWI ETF and Xtrackers S&P 500 Equal Weight ETF.
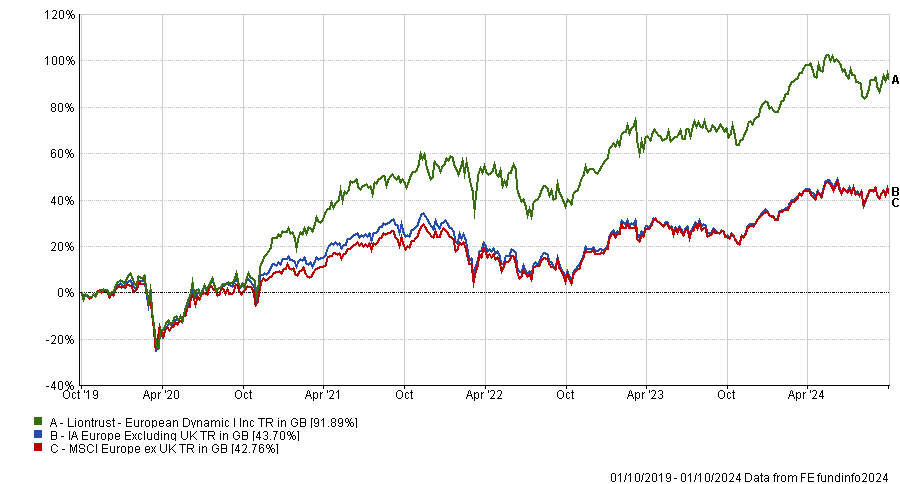
Liontrust European Dynamic is managed by James Inglis‑Jones and Samantha Gleave, who invest in companies with strong cashflows. Jason Hollands, managing director of Bestinvest, said: “Their process allows them to switch between growth and value stocks depending on the market environment.”
It is the best-performing fund in the IA Europe Excluding UK sector over five years to 1 October 2024 and sixth over three years. The £1.6bn fund has struggled in relative terms during the past 12 months, however, dropping to the fourth quartile within its sector.
Performance of fund vs sector and benchmark over 5yrs
Source: FE Analytics
M&G Japan, helmed by FE fundinfo Alpha Manager Carl Vine, and JPM UK Equity Core also have top-quartile three and five-year numbers but below-average one-year track records.
The Best Funds List does not use past performance as a primary selection criterion, however. “Using it to predict the future is about as accurate as rolling a dice,” said Hollands.
Instead, investment professionals at wealth manager Evelyn Partners (Bestinvest’s parent company) look for “a manager that invests their own money into the fund, someone who has a clear set of objectives, or a manager that adopts a high-conviction approach rather than hugging the benchmarks,” he explained. Being prepared to limit the size of the fund is also a key consideration.
M&G Japan was added to fill a gap in the Best Funds List for a core-plus Japanese option. “The fund is benchmark aware when it comes to sector exposure but takes risk at the stock specific level. It therefore avoids the style bias that typically drives the performance of many other Japanese funds,” Hollands explained.
“Similarly, JPM UK Equity Core is a low cost, index plus strategy, which takes incremental overweight and underweight positions relative to the benchmark. The investment process is highly quant driven.”
Also added to the list was Evy Hambro’s BlackRock Gold & General, which was included after the gold price hit fresh highs in sterling terms at the end of last month. The fund invests in equities that derive a significant proportion of their income from gold mining or commodities, such as precious metals. Its performance is closely correlated with gold mining stocks, which can be volatile but have risen sharply since March 2024.
Performance of fund vs benchmark over 5yrs
CHART 20241002_Bestinvest_3
At the other end of the spectrum, Janus Henderson Strategic Bond was removed ahead of co-manager John Pattullo’s retirement in March 2025.
LXI REIT was expelled following its merger with LondonMetric Property in March, while CT UK Commercial Property also lost its place.
Two ethical strategies followed suit: CT Responsible Global Equity, which suffered outflows of £175m during the first half of this year, and JPM Global Macro Sustainable.
Two long/short funds, Amundi Sandler US Equity and CIFC Long/Short Credit, were shown the door, as was Ashmore EM Local Currency Bond.
Generally speaking, funds are taken off the list if “a manager changes and we feel the replacement is unproven, or we believe changes in fund size mean the fund will need to be managed differently,” Hollands said.
Bestinvest’s latest Best Funds List contains 137 funds, including 30 investment trusts, 34 low-cost passive funds and 18 strategies focusing on environmental, social and governance (ESG) considerations.
Investors have been more interested in commodities than technology in September.
Scottish Mortgage has dropped from its podium as interactive investor (ii)’s most-bought trust this September, a place it held for an entire year. In its stead, BlackRock World Mining, which invests in mining and metal companies globally, climbed the ranks gaining eight positions since August.
This was the result of a diminished enthusiasm in technology and renewed interest for commodities, according to ii’s Kyle Caldwell.
The trend was also evident with the Allianz Technology trust losing one position and Polar Capital Technology exiting the top 10 entirely.
There were also signs in the open-ended space. Here, the L&G Global Technology index, once the most-bought fund, moved down to fourth place in favour of Vanguard LifeStrategy 80% Equity.
“Whenever there’s a strong short-term period for a sector or theme [such as technology], it’s prudent to reexamine whether your overall exposure needs trimming back to keep a lid on risk,” he said.
Another notable mover, Fundsmith Equity made a comeback after taking a break from the spotlight last month, when it slipped off the list for the first time since tracking began in 2018.
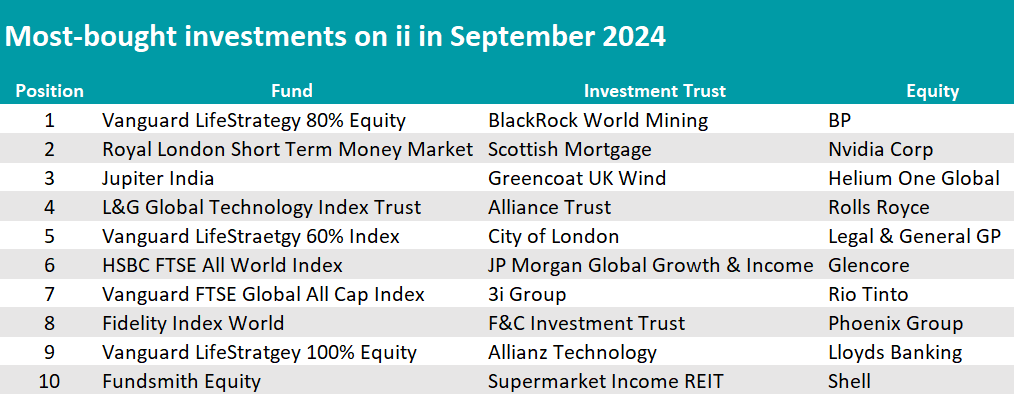
Source: interactive investor
Within the equities ranking, technology was ousted, with Amazon exiting, while oil took centre stage. BP became the new most-bought stock among ii clients and Shell also joined the cast, after both fell more than 9% over the month on the back of a weaker oil price, as ii’s head of markets Richard Hunter noted.
The “generous” dividend yields of 5.7% and 4.2% respectively were the cherry on top of the cake and were enough to lure investors back in.
Other “perennial” income-generating stocks were on the list, including financial wealth providers and insurers Phoenix Group and Legal & General, which were joined by Lloyds Banking and Rio Tinto. More usual suspects included Rolls Royce and Nvidia, whose popularity continued in September after some scathing in the previous month.
“Having suffered something of a summer lull, Nvidia shares have more recently returned to market darling status and continue to feature highly in the ii most bought list. The shares added a further 12% in the month taking the year-to-date gain to a stellar 152%,” said Hunter.
“Rolls-Royce remains well regarded by investors with the share price adding another 14% in the month to now register a gain of 78% so far this year.”
Manager Alastair Laing has picked up trusts on big discounts in his Capital Gearing portfolio.
Investment trusts have had a tough few years, with discounts widening across the board, thanks to factors such as pivotal changes in the interest rate environment hitting the alternatives market and Liz Truss’s mini-Budget in 2022.
Throw in the UK’s interpretation of the European cost disclosure directive, which created an obstacle that was removed only a few weeks ago, and it is clear to see why investors may have been hesitant.
But this is exactly why some managers find that now is the best time to get involved. One such person is Alastair Laing, who is in charge of Capital Gearing, a specialist multi-asset trust that derives all its equities allocation from trusts.
“A range of things have caused a big dislocation and large discounts to emerge, which for us is exciting,” said Laing. “There's a lot of doom and gloom around investment trusts, but that is typical when discounts are widening out. It's happened before and the narrative changes as to why, but financial markets are cyclical.”
Below, he shares some recent examples of high-quality managers of well-run portfolios that are trading on a discounts that should provide strong gains over the long term.
A good example of a position that he has built recently is the Smithson Investment Trust, run by Simon Barnard and Will Morgan.
Performance of fund against sector and index over 1yr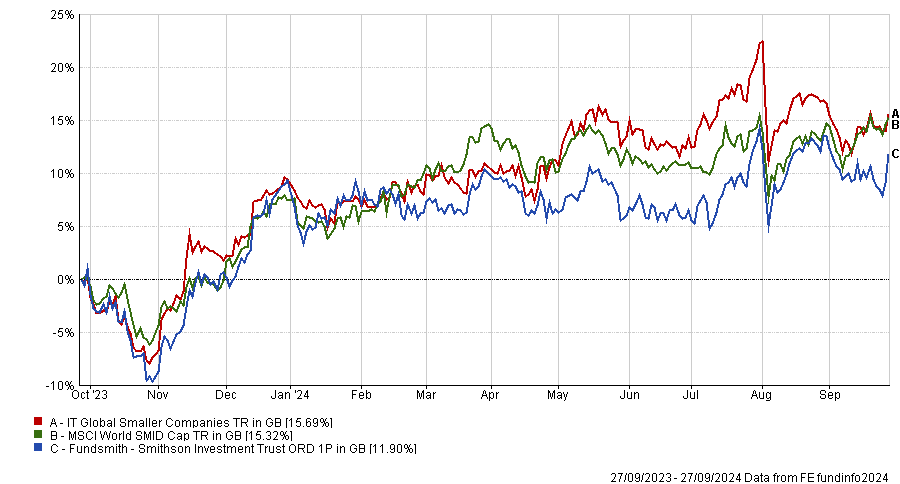
Source: FE Analytics
It is the closed-ended mid-cap equivalent of Terry Smith’s
“It performed incredibly strongly and was very in demand and trading on a premium for a while, so it wasn't of interest to us until later, when it had a really tough period and moved to a discount. Barnard is a good manager with a good process which you can now get on the cheap,” Laing said.
For the manager, the turning point was earlier this year, when Smithson was supposed to be involved in a continuation vote that was to be held at the annual general meeting.
It was cancelled by the board at the last minute and at that point, “all the stars aligned” for Laing, who took the opportunity to buy the trust on a discount and engage with the board.
“We built quite a big position and, along with other shareholders, made the case that cancelling the continuation vote was not appropriate corporate governance.”
The board listened by reinstating the continuation vote and also started a “very material” share buyback scheme. “We love share buybacks at discounts, that's risk-free upside,” Laing said.
Another example of a trust that he has bought is RIT Capital. It has an “outstanding long-term track record” but has fallen to big discounts since 2022, reaching today’s 30%. The trust was also “hit badly” by cost disclosure, having had to disclose ongoing charges of 4.5%. That's now gone away with the Financial Conduct Authority’s intervention.
Performance of fund against sector and index over 1yr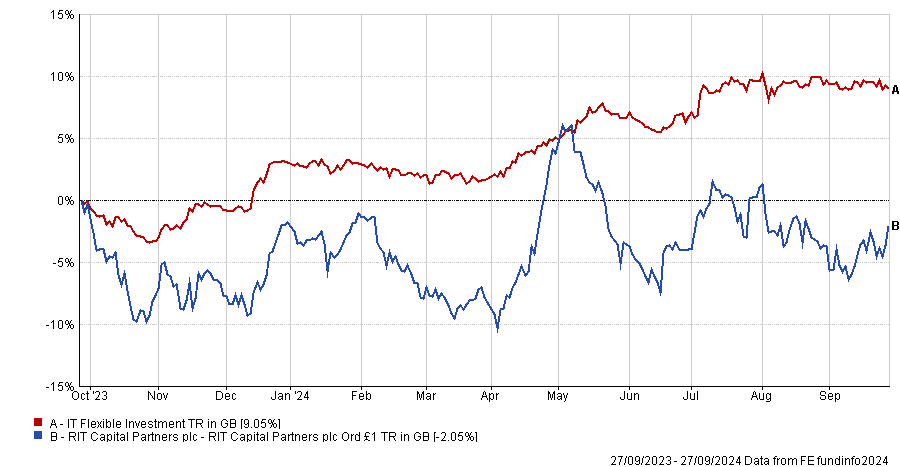
Source: FE Analytics
“We like the process, we like the manager and again historically, the board didn't do buybacks,” said Laing. “We built a position, engaged with the board and now it is buying shares. Buying shares at a 30% discount is very powerful.”
A final, more esoteric example is the £1.2bn hedge fund BH Macro. During the global financial crisis, Brevan Howard earned a solid reputation for delivering strong returns while most investors experienced losses.
Performance of fund against sector and index over 1yr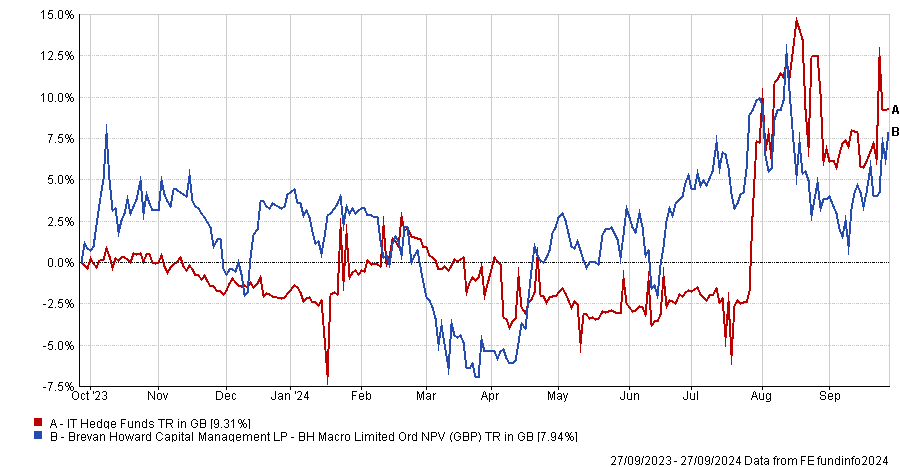
Source: FE Analytics
The trust was also successful during the market volatility of 2022, but last year was tougher, and the NAV total return was down 1.8%, as Winterflood analysts noted.
They said this discount is “an attractive entry point for access to a manager with an attractive record of protecting capital in difficult times. However, it may require corporate action for the discount to narrow, given that Investec and Rathbones combined hold a 25% stake according to Bloomberg, which is seen as an overhang by the market.”
The “very stable” underlying NAV has been eclipsed by the share price, which has gone from about a 10% premium to an 18% discount over the past 18 months, and Laing bought in on double-digit discounts, again engaging with the board and initiating share buybacks.
All of these positions amount to almost 1% of the Capital Gearing portfolio and were built over the past 12 months.
“We don't think those will be quick returns, but they will outperform the underlying asset class over the next three or four years,” said Laing. “That's how we seek to more reliably generate alpha than trying to beat the market at stock picking.”
Disappointing interim results and environmental concerns may have prompted hedge funds to bet against the natural gas company.
Diversified Energy Company is now the UK’s most-shorted stock, knocking Petrofac off that perch for the first time since November 2023.
Investment firms that bet against the natural gas company last month included Arrowstreet Capital, Bridgewater Associates, JPMorgan Asset Management, Millennium International Management, Point72 Asset Management and Qube Research & Technologies, according to the Financial Conduct Authority.
Diversified Energy's share price has fallen dramatically from £12.85 on 31 July 2024 to £8.44 on 30 September. It has almost halved (down 47.2%) in the 12 month period ending 30 September 2024 and is languishing close to five-year lows.
Performance of Diversified Energy Company vs FTSE 100 over 5yrs
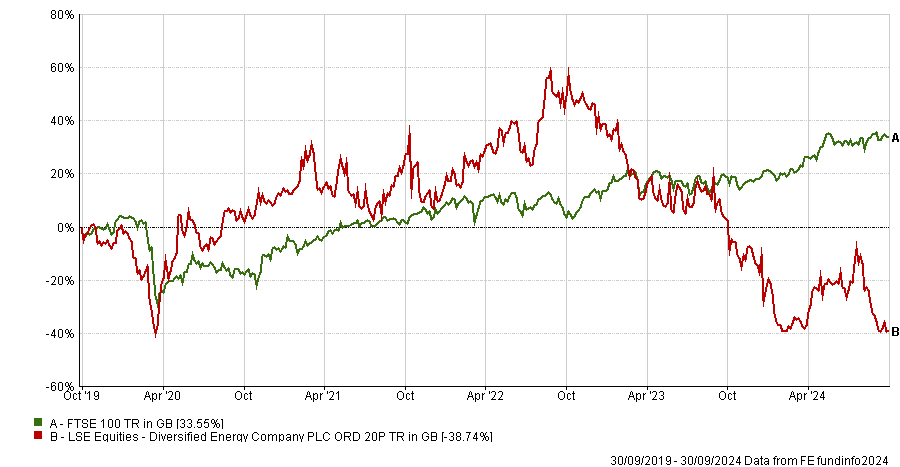
Source: FE Analytics
Diversified Energy specialises in the production, marketing, transportation and retirement of natural gas and is the largest owner of oil and gas wells in the US.
Last December, four Democratic members of the US House of Representatives Committee on Energy and Commerce wrote to the company requesting information about how it stops methane leaks from its mature gas wells.
The letter, addressed to chief executive officer Rusty Hutson Jr., stated: “Diversified Energy is responsible for remediating a substantial share of the country’s ageing oil and gas wells, but we are concerned that your company may be vastly underestimating well cleanup costs.”
A significant number of the company’s wells are low-producing, marginal wells, which are expensive and difficult to maintain, the letter noted. “Reports suggest that many of your company’s marginal wells may be leaking a substantial amount of methane.”
This enquiry caused Diversified Energy’s share price to tumble, prompting a public response from the company, stating that it had “dramatically reduced its reported Scope 1 emissions by more than 25% compared to 2020” and was deploying “emissions best-in-class detection equipment and protocols, which includes completing emissions detection surveys on all its natural gas wells”.
Diversified Energy also said it had achieved a gold rating from the Oil & Gas Methane Partnership and Project Canary, two independent emissions monitoring programs.
Furthermore, it has partnered with several states within the Appalachian region of the US to retire state-owned orphan wells “in a cost-efficient and environmentally sound manner”.
The gas company has been one of the UK’s most shorted stocks since February but the recent spate of bets may have been triggered by its interim results for the six month period to 30 June 2024, released on 15 August.
Diversified Energy’s net income of $16m fell dramatically compared to $631m for the first half of 2023. Total revenue of $369m decreased 24% versus $487m for the same period of last year, primarily due to a 16% decrease in the average realized sales price and a 12% slump in sold volumes.
Elsewhere, the list of the UK’s 10 most shorted stocks, below, remains similar to recent months.
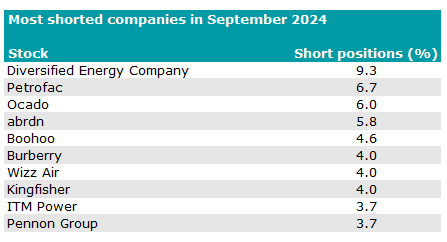
Source: Financial Conduct Authority
Just outside of the above list, in eleventh place was Domino’s Pizza, following a disappointing set of results in early August. AJ Bell investment director Russ Mould said those results were “about as soggy as day-old pizza, guiding for full-year performance at the lower end of expectations after a slower-than-anticipated start to the first half”.
Domino’s has been passing on the benefits of lower food costs to its franchise partners: “presumably to help sustain a positive relationship given historic issues with franchisees”, said Mould.
“The company has tried to signal some confidence in the outlook with a £20m share buyback programme but the market appears unconvinced.”
Japanese small-caps are being overlooked, despite huge valuation discrepancies.
It’s no secret small-caps across the globe have taken a pounding in recent years, as the rise in a narrow set of mega-caps – coupled with rising interest rates – have made them an unpalatable choice for investors.
The numbers reflect this harsh reality. Global equities have returned 23.6% to investors in the past three years, compared with 2.5% for the MSCI World Small Cap index.
The squeeze in appetite is apparent. Small-caps account for roughly two-thirds of all global companies (68%). That figure is significant when you consider that global smaller companies normally account for 7-8% of the global stock market valuation but recent underperformance has seen this fall closer to 4%, a 50-year valuation low.
But there are hopes the headwinds are gradually becoming tailwinds, with rate cuts and increased buybacks in the small-cap universe indicating an upswing is not far away.
We have seen a lot of discussion about the opportunities in the UK small-cap market, but another market being overlooked, despite huge valuation discrepancies, is Japan.
Like many other parts of the world, Japanese small-caps have faced a raft of challenges since 2021. The largest of these being the fall in the yen (it has been down as much as 30% versus the US dollar between June 2021 and 2024), which has been good for exporters such as large tech and artificial intelligence (AI) companies, electric vehicles, semiconductor-related businesses and renewables.
By contrast, high growth, small-cap companies have become almost untouchable for investors, despite many continuing to bring in strong sales and grow rapidly. A recent research update from Hennessy Funds says the market’s hesitance to value these stocks appropriately may stem from a prolonged period of economic stagnation, exacerbated by the impacts of the global pandemic on the Japanese economy.
Why now for unloved Japanese small-caps?
Since the start of 2023, Japanese equity markets have recorded strong returns, heavily driven by large-caps, many of which are exporters benefitting from the depreciation in the yen.
Janus Henderson portfolio manager Yunyoung Lee believes we have only seen the beginning of a resurgence in the region, citing moderate inflation driven by rising labour costs – a move which tends to improve valuations. He also pointed to changes in the macro-environment, such as the reorganization of global supply chains due to rising US-China trade tensions. There are already signs of domestic repatriation of manufacturing bases, particularly in the semiconductor and medical device sectors.
Given current market fundamentals and the growth in Japan's domestic economy, he said he would be surprised if small- and mid-caps did not grow as fast as large-caps.
There are signs of a turnaround; the yen has started to strengthen against the US dollar in recent months, albeit from low levels, traditionally a good sign for small-caps.
Baillie Gifford Shin Nippon trust manager Praveen Kumar also believes domestic retail investors – often a key indicator for wider appetite for Japanese stocks – are starting to take an interest in small-caps.
Why Japan versus other global markets?
In addition to attractive valuations, Kumar said small to medium-sized businesses are the ones facilitating change in the country – allowing them to tackle structural issues, such as software technology gaps, labour market demographic challenges and cyber security concerns. By contrast, the larger firms have global footprints and do not have as great a focus on these longer-term domestic challenges.
Then there is the research angle – compared to many of its global peers, Japanese small-caps are thoroughly under-researched. The Topix small-cap index has 1,649 companies with an average of three analysts covering each company, in contrast to the Russell 2000 (5.9) and the BBG DM Europe small-cap (8.4). It should be noted that companies with a market-cap of less than ¥200bn are seldom covered at all.
As a result, strong corporate results are often not reflected in price-to-sales figures, Kumar said, which was the case for online real estate company GA Technologies and food retailer Oisix. This creates opportunities for active managers to step in.
With supply chain issues being resolved and economic conditions improving, now might be the ideal time to tap into this sector of the market. It has been a challenging period, but rebounds tend to be hard and fast for small-caps.
Investors may want to consider a specialist Japanese small-cap vehicle such as Baillie Gifford Shin Nippon or the M&G Japan Smaller Companies fund. The latter is a bottom-up, valuation-sensitive fund that aims to provide a combination of strong capital growth and income by investing in mid and small-caps.
For an all-cap Japanese strategy, the Comgest Growth Japan fund historically held 30% in small-caps but the current allocation is only 13% as a pragmatic response to the market’s preference for liquidity.
Those wanting exposure within a global offering might prefer the Global Smaller Companies Trust managed by Nish Patel, which currently has around 10% in Japanese small-caps.
Chris Salih is head of investment trust and multi-asset research at FundCalibre. The views expressed above should not be taken as investment advice.
Trustnet looks back at a turbulent month in which Chinese equities boomed while the UK floundered.
China was the main place to be invested in September, according to monthly performance figures from FE Analytics, with Chinese funds and trusts making more than three times the next best peer group.
The country has been in the doldrums for much of the year, with the MSCI China index moving sideways from January to mid-September. But it rocketed higher over the past two weeks after fresh stimulus from the government propelled the market.
The People’s Bank of China (PBOC) freed up around 1trn yuan in long-term liquidity by reducing the reserve requirement ratio for banks by 0.5 percentage points, allowing them to lend more and support the economy. It also reduced interest rates by 0.2 percentage points and lowered existing mortgage rates by 50 basis points.
Ben Yearsley, director at Fairview Investing, added: “There is also the possibility of some helicopter money at some point and the PBOC will essentially lend to banks and brokers to invest in the stock market.”
These measures triggered the best week in nearly a decade at China’s stock exchanges towards the end of the month, propelling all assets invested in the region, as well as ancillary benefactors such as Europe, which relies heavily on exports to the country.
IA China/Greater China topped the best performing Investment Association (IA) sectors last month, up some 16.3%, while IT China/Greater China did even better, with the average trust in the Association of Investment Companies (AIC) peer group up 22.9%.
The top five IA sectors last month were dominated by the news, with IA Asia Pacific Excluding Japan in second with an average gain of 5.3% for its funds. It was followed by IA Global Emerging Markets, IA Asia Pacific Including Japan and IA Global EM Bonds Local Currency.
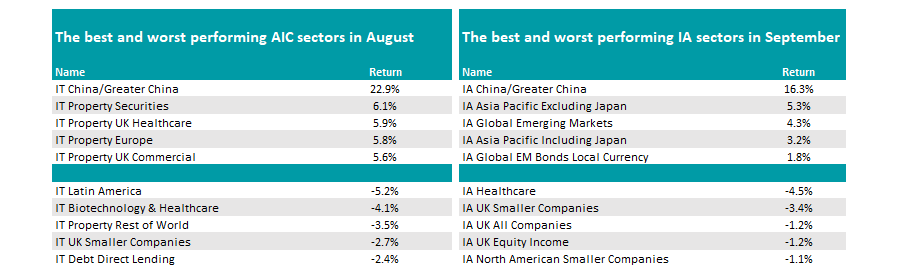
Source: FE Analytics
In the trust space, however, it was another asset class that caught the eye: property. Part of this could be because investors have finally agreed that inflation is now under control.
“Base rate cuts and a taming of inflation has led to investors rediscovering property as an asset class,” Yearsley noted.
In the UK, the consumer prices index (CPI) was flat in August at 2.2%, while in the US, one key measure of inflation fell from 2.9% to 2.5%.
Perhaps surprisingly, US funds and trusts failed to break into the top performers of the past month despite the Federal Reserve cutting rates for the first time in four years.
“The 0.5 percentage point cut was a bit of a surprise having only been trailed a week or two before. However, the US consumer continues to defy belief with retail sales increasing by 0.1% in August,” said Yearsley.
He suggested this could be because markets had previously priced in heavy rate cuts this year, before tempering their expectations. It is worth noting that the S&P 500 hit its 43rd record high of 2024 during the month.
Yearsley suggested, however, that the US rate cut may have been the key driver for the Chinese stimulus package. If true, this would make it indirectly responsible for the gains in Asia.
“China will occupy many column inches this month, but the Fed pivot was surely the catalyst. Without the slightly surprising 0.5 percentage point cut in September would Beijing have countenanced its multi-faceted approach? Will authorities there now wait for the next Fed cut, probably in November, before unleashing further measures?” he said.
Turning to individual funds, the roll call of top performers was dominated by China. It is the first time that the top 20 funds in the list below have all come from the same asset class.
Topping the table was Redwheel China Equity with an impressive 30.2% rise, while Matthews China was up 30.1%. These were the only two on the list to cross the 30% threshold, with the remaining 18 making gains of between 20% and 27.1%.
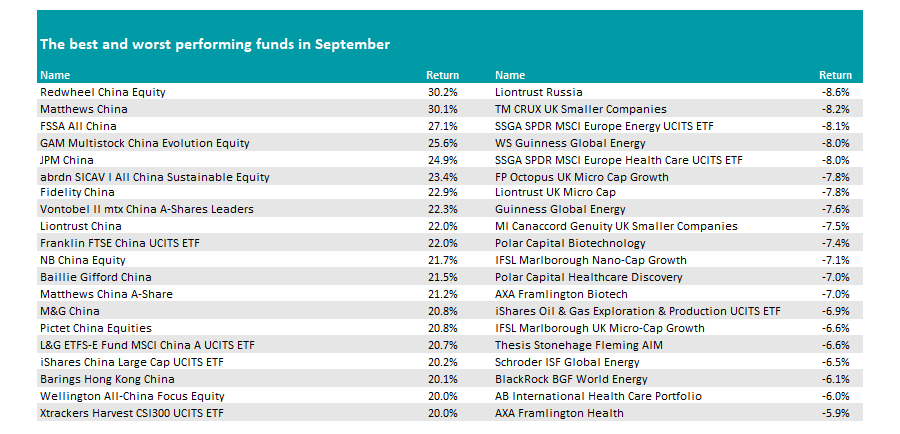
Source: FE Analytics
Among investment trusts, JPMorgan China Growth & Income, Fidelity China Special Situations and Baillie Gifford China Growth all made more than 20%, leading the way.
At the other end of the spectrum, it was a poor month for UK funds, with the IA UK Smaller Companies, IA UK All Companies and IA UK Equity Income sectors all among the worst performers in September.
Market commentators are expecting a tough autumn Budget from chancellor Rachel Reeves later this month, while the Bank of England was the only of the major three central banks to opt against cutting rates in September.
Additionally, the Office for National Statistics has revised down GDP, with the second quarter growth this year reduced by 10 basis points to 0.5%.
Yearsley said: “The pace of growth has faltered with [Keir] Starmer and Reeves being blamed for talking the UK down. Growth has now stalled for two months, and the third quarter could see no growth at all.
“UK flash PMI fell from 53.8 in August to 52.9 last month. At the same time, borrowing has overshot with debt to GDP now over 100% for the first time since the 1960s.”
IA Healthcare however took the top spot, with the average fund down 4.5%, while in the trust space, IT Latin America led the way lower, losing 5.2% on average.
In terms of individual funds, Liontrust Russia propped up the standings down 8.6%. “There didn’t seem any particular reason except the ongoing/never-ending war in Ukraine,” said Yearsley.
“The only real theme was UK micro-cap funds, especially those exposed to AIM. Rumours abound that the chancellor will remove the IHT break from AIM shares, which would be a devastating blow to the junior market and at complete odds with the Labour Party’s promise to be pro-growth.”
Energy funds also featured near the foot with the oil price falling near the $70 mark over the course of the month.
Trustnet reviews the past three months from a range of perspectives.
Global equities appeared to make little progress over the third quarter of 2024, data from FE fundinfo shows, although a closer look shows that plenty was going on just below the surface.
The MSCI AC World posted a slight gain over the past three months, after a V-shaped journey that saw the index slump on worries over the health of the global economy, lofty valuations among tech stocks and the unwinding of the yen carry trade.
Things then turned around with the publication of better economic data and the Federal Reserve making a 0.5 percentage point cut to interest rates. The recovery was then cemented when China launched an aggressive stimulus package, which ranged from rate cuts to fiscal support.
Below, Trustnet looks in closer detail at how markets moved over 2024’s third quarter.
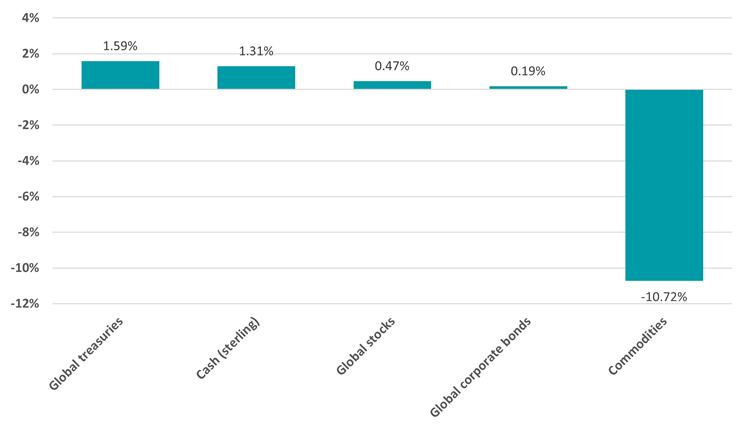
Performance of asset classes in Q3 2024
Source: FinXL
As noted above, global stocks performed mutedly, with the MSCI AC World making a total return of just 0.5% in sterling terms. This reflects a volatile quarter where concerns about a global slowdown and the unwinding of the yen carry trade weighed heavily on investor sentiment. However, the Fed’s rate cut and China’s stimulus in September helped stabilise markets towards the end of the quarter.
In comparison, global treasuries and cash in sterling performed better, delivering respective returns of 1.5% and 1.3% as investors sought safety in these assets amidst a mixed economic outlook. The anticipation of peak interest rates and concerns about economic stability led to a continued preference for lower-risk assets like government bonds and cash, while bonds were the beneficiaries of the Fed’s rate cut.
Commodities fared the worst, however, with a decline of 10.7% in the broad S&P GSCI index. Slowing growth in China put pressure on commodity prices during the quarter.
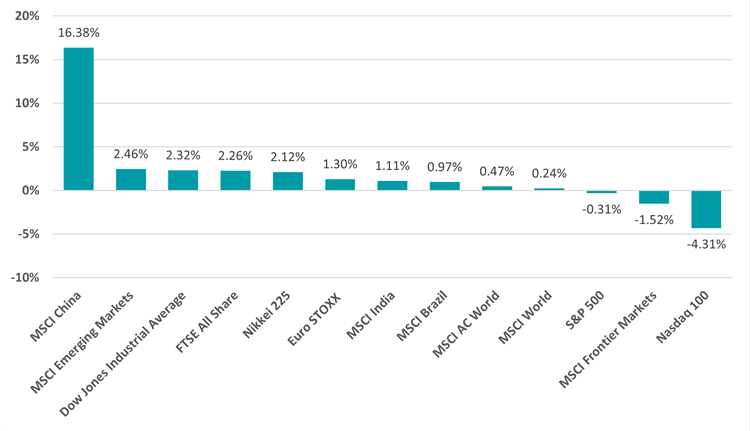
Performance of geographies in Q3 2024
Source: FinXL
Chinese equities – which have struggled for an extended period – were the standout performers of the quarter, with a 16.4% gain in the MSCI China index fuelled by the large-scale stimulus measures. These policy actions, aimed at spurring economic growth after a period of stagnation, sparked investor optimism, particularly in technology and consumer-driven sectors.
In contrast, the Nasdaq 100 fell by 4.3% as investors became increasingly wary of high valuations in US tech stocks and macro uncertainty. After several years of outperformance in technology and ‘new economy’ stocks, the market began to broaden out and shifted attention towards ‘old economy’ sectors in 2024’s third quarter, reflected in the modest rise in the Dow Jones.
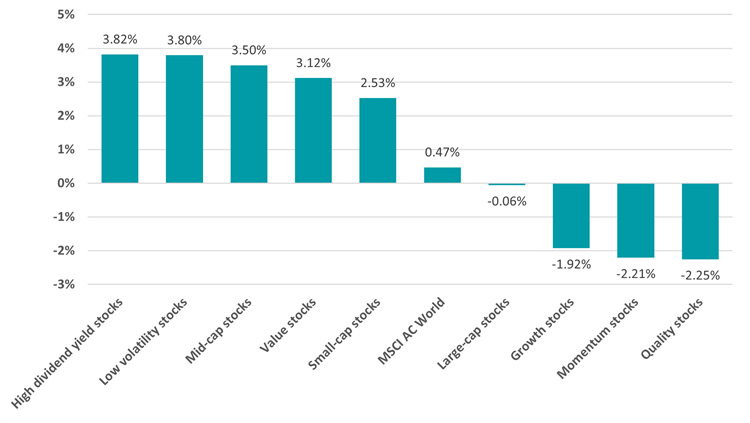
Performance of investment factors in Q3 2024
Source: FinXL
High-dividend yield and low-volatility stocks led the market as investors sought stability amid global economic uncertainties. Income stocks were favoured with investors looking for strong dividends as bond yields fall alongside interest rates.
On the downside, quality, growth and momentum stocks underperformed. This shift reflects investor caution around high-growth areas after several years of outperformance.
Performance of industries in Q3 2024
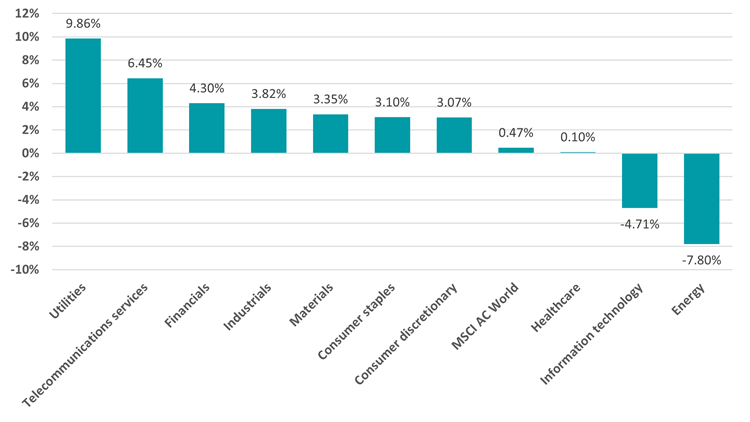
Source: FinXL
Utilities led the stock sectors in the third quarter with a 9.7% return, thanks to investor interest in defensive sectors amid economic uncertainty. These companies also tend to pay reliable dividends, which are tied to the demand for income noted above.
At the other end of the spectrum, energy stocks struggled with a decline of 7.8% on the back of weaker demand and falling oil prices. Information technology also experienced losses, falling by 4.7% in the broader market rotation away from high-growth sectors.
Performance of commodities in Q3 2024
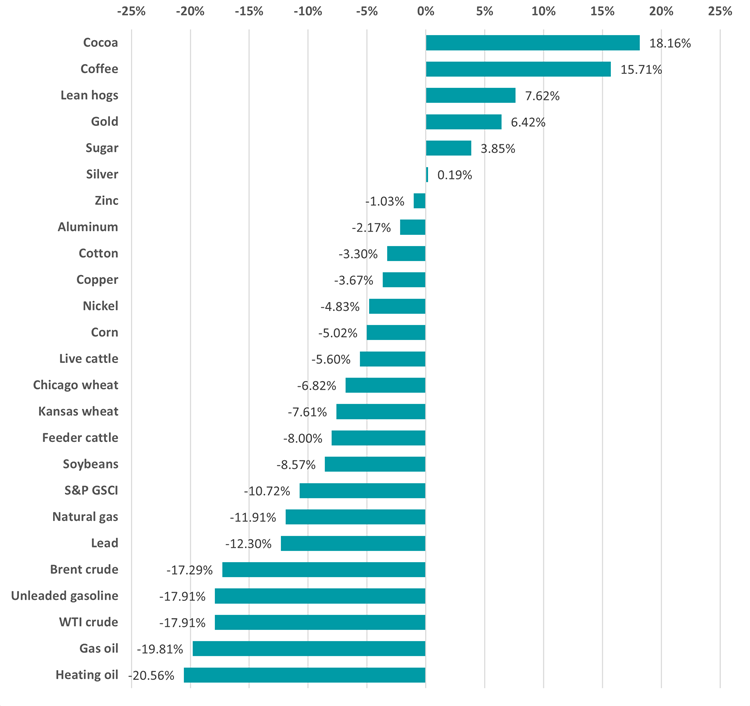
Source: FinXL
Although commodities in general fell over the quarter, cocoa prices rose 18.2% while coffee was up 15.7%, following supply shortages and increasing demand. Lean hogs also performed well and gold climbed 6.4%.
Conversely, energy prices declined sharply, with heating oil down 20.6%, gas oil falling 19.8% and WTI crude off 17.9%. These losses were driven by a combination of lower demand, particularly as economic growth slowed in key regions like China and Europe.
Performance of IA fund sectors in Q3 2024
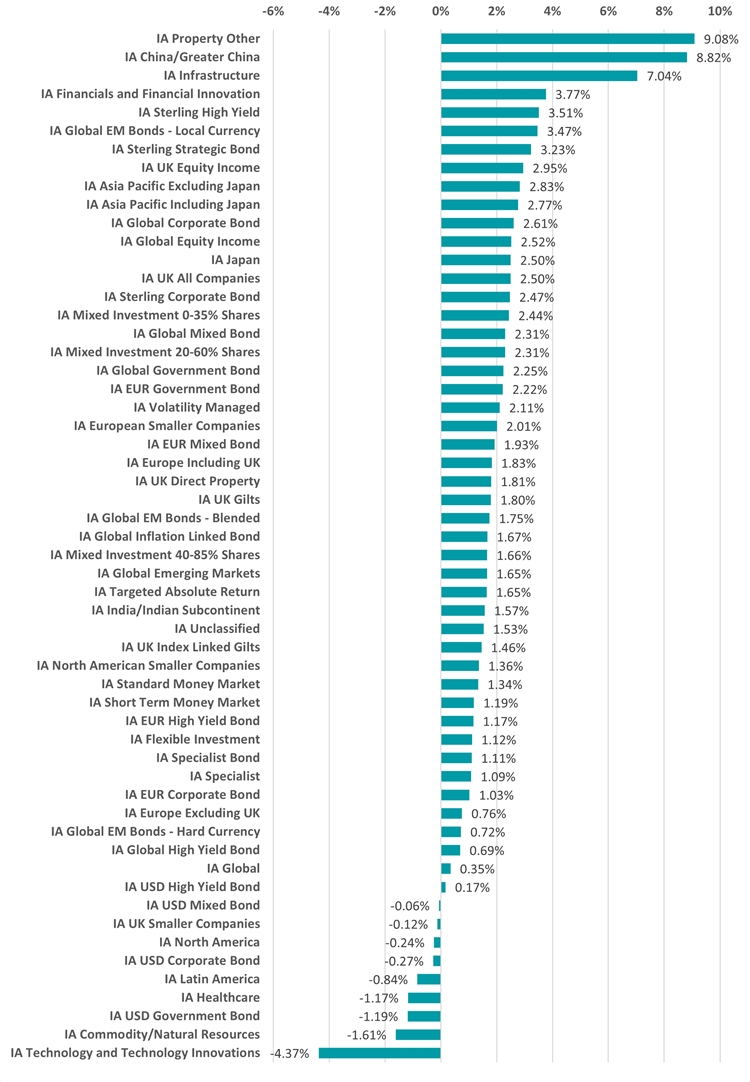
Source: FinXL
When it comes to the Investment Association fund sectors, IA Property Other led the way with a 9.1% average return as falling interest rates made property investments more attractive.
The average IA China/Greater China fund gained 8.8% thanks to the stimulus package unveiled by Beijing. This represents a significant turnaround as Chinese equity funds were consistently at the bottom of the performance rankings because of slowing growth and recent regulatory crackdowns.
On the other hand, the IA Technology and Technology Innovations sector fell 4.4% over the quarter. This underperformance reflects broader market caution around high-valuation tech stocks, a recurring theme during the quarter as investors rotated into more defensive sectors.
Cathie Wood’s house has partnered with the investment platform.
A new investment vehicle by Ark Invest, the investment management firm founded by Cathie Wood, is now available on the eToro platform.
Called Ark Future First, it focuses on companies across technology, healthcare and sustainability, accessing them via seven of Ark’s exchange-traded funds (ETFs).
The largest allocations are to the Ark Artificial Intelligence and Robotics ETF (28.6%), followed by Ark Innovation (25.8%) and Rize Cybersecurity and Data Privacy (12.7%). These positions give investors access to “transformative growth opportunities” in artificial intelligence and blockchain.
There are three sustainability names: Rize Global Sustainable Infrastructure; Rize Environmental Impact; and Rize Sustainable Future of Food.
Finally, Ark Genomic Revolution targets the gene editing revolution, which is enabling “personalised medicine, early disease detection and more effective treatments”.
These three areas are poised for “transformative growth”, according to founder and chief executive officer of Ark Invest Cathie Wood.
Gil Shapira, chief investment officer at eToro, said through the Ark Future First portfolio investors can “seek growth through truly long-term, cross-sector trends that are predicted to not just shift markets but the world for decades to come”.
Experts look at two popular funds topping the charts in 2024, asking which investors should back.
Growth funds have been outperforming their value peers so far in 2024 and two formerly popular options are on the rise once again.
Alexis Deladerriere, Nathan Lin and Jennifer Sullivan’s GS Global Millennials Equity Portfolio invests in companies that play into what younger generations enjoy, such as social media and the internet, with top holdings including Apple, Meta and Amazon.
WS Blue Whale Growth, meanwhile, is managed by FE fundinfo Alpha Manager Stephen Yiu and is a concentrated portfolio of 26 companies that he believes are “high-quality businesses”. Examples in its top 10 include Flutter, Nvidia and Visa.
Despite their different methods, they have had similar trajectories. Both have made top-quartile returns so far in 2024 and were above the average IA Global fund in 2023, but struggled in 2022, sitting in the fourth quartile with 31% and 27.6% losses respectively.
Performance of funds vs sector and benchmark over YTD
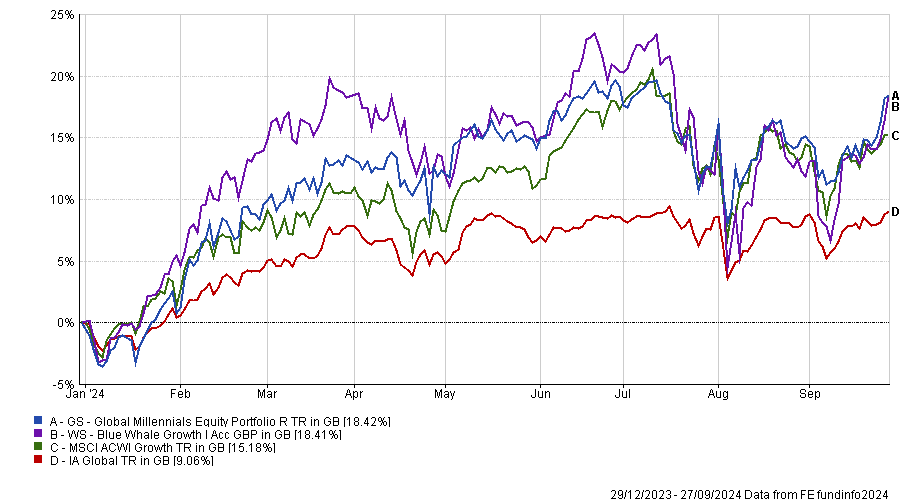
Source: FE Analytics
They have a correlation over the past six months of 0.99 (a score of 1 means they have moved identically) and 0.9 over the past year. This widens slightly over longer periods to 0.83 and 0.84 over three and five years, although both have a correlation of 0.9 to the MSCI All Countries World index over the past half a decade.
The funds have around £1bn in assets under management and more than 50% of their portfolios in their top 10 positions, but for Tom Sparke, portfolio manager at Progeny Asset Management, Blue Whale could provide greater diversification.
While both have delivered “very good returns for their long-term supporters” and are “true to their remits”, containing “exactly the kind of stocks that one might expect to see”, he noted that the Global Millennials fund encompasses more of the most familiar mega-cap names in typical US and global funds so overall.
“Looking at these top holdings, the Global Millennials fund encompasses many more of the most familiar mega-cap names in typical US and global funds so overall, if you are looking to diversify your holdings, then Blue Whale would provide greater diversification,” he said.
Ben Yearsley, director at Fairview Investing, agreed that Blue Whale was the preferred choice, noting he generally likes boutiques over the large fund management groups.
“Purity of process and clarity of decision making makes boutiques compelling in my mind,” he said. In the case of Blue Whale, it has one product that has delivered “decent results” over its life and the team are focused solely on this.
While 2022 was “tough” as the high-growth stocks that had boomed during the era of low interest rates tumbled, Yearsley said Yiu “took that as an opportunity to re-look at the process to see if it was fit for purpose”.
“Largely it was, he concluded, but he made some tweaks that meant going forward he wasn’t so reliant on the uber-high growth stocks. I like this kind of honest appraisal.”
Not all agreed, however. Jason Hollands, managing director of Bestinvest, said Blue Whale can be more opaque than its peers. For example, although it lists the top 10 holdings in its monthly factsheets, it omits the position sizing.
“This isn’t helpful,” said Hollands. However, investors can see that 45% of the concentrated 26 stock portfolio is in technology positions and a further 7.8% in communication services, which “probably explains the strong performance over the past couple of years”.
The Goldman Sachs fund also has big positions in tech (26%) and communication services (26%), but another notable theme is 24% in consumer discretionary stocks.
Its top 10 includes big positions in a number of the artificial intelligence (AI) related darlings, including Nvidia, TSMC, Meta, Alphabet, Amazon and Apple and is a slightly more globally diversified with 61% in the US, versus Blue Whale Growth which is 75% invested in US stocks.
“Personally, I wouldn’t buy funds with heavy positioning in tech and AI names given currently frothy valuations, but If I had to invest in one of these two I would have a marginal preference for the Goldman Sachs product given better disclosure and slightly more diversification,” he said.
However, he recommended investors interested in these funds look at Brown Advisory Global Leaders, a 30-40 stock portfolio of mostly large-cap companies.
“Its investment philosophy is focused on high-quality, cash-generating businesses delivering positive and sustainable returns on capital and holding them for the long term. Diversification across sectors and geographies is important, with the portfolio typically having 40% outside of the US. Currently US exposure is 43%,” said Hollands.
It sits in the second quartile of the IA Global sector so far this year but its drawdowns in 2022 were far less severe.
Performance of funds vs sector and benchmark over 5yrs
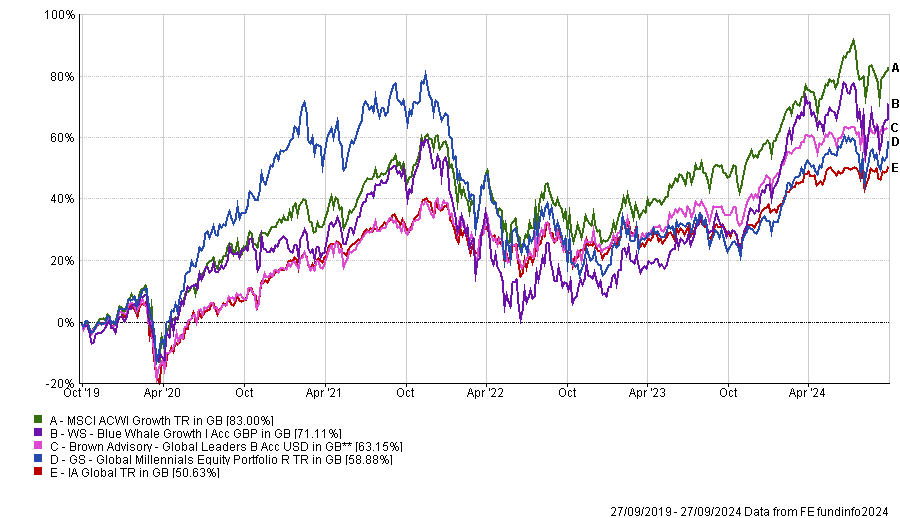
Source: FE Analytics
It is a better performer than both over three years although lags the Blue Whale fund over five years, as the above chart shows.
Fees based on “subjective” NAV calculations are “nonsense”, Hawksmoor’s CIO argues.
Investment trusts are charging unfair fees, according to Hawksmoor Investment Management’s Ben Conway.
Most fund managers and investment advisers base their fees on the net asset value of investment trusts’ underlying portfolios, but for trusts holding hard-to-value private assets, those valuations are subjective and can fluctuate wildly, he argued.
Conway, who is Hawksmoor’s chief investment officer, thinks it would be fairer for all investment advisers to charge fees based on a trust’s market capitalisation to align their interests with shareholders.
“Calculating fees as a percentage of a valuation figure that is so clearly subjective is simply a nonsense and creates horrific alignment issues for shareholders,” he stated.
Investment trust fees have been a hot topic of late, following their recent exemption from European Union cost disclosure rules. Conway’s argument concerns an unrelated point, however – whether charges themselves are fair, not how they are disclosed.
To illustrate his point he described two investment trusts whose portfolios have been written down recently – Gresham House Energy Storage and Digital 9 Infrastructure – causing shareholders to wonder whether the investment managers have been charging fees based on inflated valuations.
Gresham House Energy Storage (GRID) announced a material write-down to its NAV on 9 September after replacing one of the two third-party consultants it uses to calculate its NAV. The new firm used lower revenue forecasts for the trust’s batteries than the previous consultant.
“The fact that GRID switched from one provider to another – both doing the same job, looking at the same information and yet coming up with different forecasts – shows how subjective this analysis of revenue forecasts is,” Conway said.
“In GRID’s case, the natural question for shareholders to ask is: have they been overcharged during the period when a more aggressive provider of revenue assumptions was used?”
The board of Digital 9 Infrastructure, meanwhile, announced a provisional NAV of 45p per share on 6 September – a 43.2% reduction from the December 2023 NAV.
The trust’s assets rely on future capital investment to fund their expansion, making them hard to value. “Fees on an NAV that is subject to such a huge and sudden revaluation is just not acceptable,” Conway argued.
“For any asset where there is scope for subjectivity or sudden revision due to external factors, fees must be levied on market cap,” he continued. Otherwise, “the scope for misalignment between the investment adviser and the shareholder is too great”.
Furthermore, with many trusts trading at wide discounts to their net asset values, the returns experienced by shareholders are intrinsically linked to the trusts’ market capitalisations and share price – but bear a more distant relationship to the underlying portfolio’s NAV.
Three-quarters of investment trusts base their fees on NAV. This is a bigger problem for trusts invested in alternative assets given that their NAVs are calculated less frequently and subject to greater mark-to-market revisions. Nonetheless, Hawksmoor would like to see all trusts switching to fees calculated on market cap, even equity-oriented trusts whose portfolios are easy to value, to ensure alignment with shareholders.
Currently, 8% of investment companies (excluding venture capital trusts) charge on a market cap basis, according to the Association of Investment Companies (AIC).
Bellevue Healthcare (BBH) is one example, said William Heathcoat Amory, managing partner at Kepler Partners. "We like this feature, as it incentivises the manager to see the shares trade close to NAV and aligns their interests more with those of shareholders. BBH’s fee of 0.95% is also lower than the 1.25% weighted average for the AIC Biotechnology & Healthcare sector and there is no performance fee," he said.
James Carthew, head of investment companies at QuotedData, has a different perspective. "Our stance has always been that the best fees are based on the lower of market cap and net asset value," he said. Just 4% of investment trusts do this currently, according to the AIC.
Meanwhile, WhiteOak Capital Management, which manages Ashoka India Equity and Ashoka WhiteOak Emerging Markets, has pioneered another approach. It does not charge a fixed management fee at all but instead levies a performance fee on a three-year cumulative alpha basis.
Founder Prashant Khemka said: “We only get paid if we outperform. The alignment of interest is strong because we can't just sit on our laurels and expect to get paid.”
The Artemis SmartGARP Global Emerging Markets Equity fund has almost 30% of its assets in China, a significant overweight.
Reading some fund sales literature, you might think that it is possible to invest successfully in emerging markets only by being some sort of Indiana Jones character.
I like to imagine myself racing from country to country in my Artemis biplane, covered in dust and bruises from various adventures in a relentless search for companies no-one has heard about before.
Relentless, yes, but – for me at least – also pointless. I have not been on a foreign jaunt in years.
When I started my career at Fidelity, back in 2002, the legendary Anthony Bolton would say that going to meet companies gave you an edge. The analysts might all be forecasting earnings growth rates of 10% a year, but conversations on the ground could tell you a different story.
I recall an ex-colleague who covered Sub-Saharan Africa. He would go to Ghana and be met at the airport by a motorcyclist who would take him to see businesses so he could get company data disclosure directly. But data availability has really improved for more liquid emerging markets.
Our investable universe has doubled in the past decade. There are now around 3,000 companies around which there is sufficient and reliable data on which to make an investment decision. The asset class has matured. There are more big companies; they have a longer track record, and they have better data availability.
With so much information available online are we saying that somehow visiting a factory in the middle of nowhere would allow me to intuit extra vital insights? Ask my wife – intuition is not one of my strengths! Moreover, I am not sure that I could judge who has these ‘soft’ skills. So it would be no good giving me a global team of analysts to manage and telling them to do the legwork, because that would require me to make similar judgement calls on them – such as ‘that analyst is always very cautious’ or ‘that one can get a bit too enthusiastic’.
Some people will say that being on the ground enables you to see the facilities and reduces the chance of fraud. Most experienced fund managers have found at some point one of their holdings touched by fraud. It is hard to spot. If the perpetrators were so blatantly crooked that you could tell by meeting them or visiting their premises, I would hazard a guess that in the larger-cap arena in which we operate, everyone would soon know what they were up to. With the history of markets showing that many companies do not survive the test of time, we like to diversify our exposure across companies, geographies and sectors. This mitigates risk.
Another common argument for investing in a fund with teams on the ground is that they have a better sense of perspective. I understand this. Even despite the recent stimulus announcements, many looking at China through the prism of the UK and developed markets media see a property sector in turmoil, a failing economy and government curbs that restrict enterprise and growth.
While there are some truths in those observations, the reality is that China is undergoing change. It is becoming more self-sufficient. Many of the changes should have longer-term benefits for the country. The domestic recovery is taking time, but company valuations look attractive. China has seen huge innovation in technology, artificial intelligence (AI) and manufacturing. The government has not suppressed enterprise in these areas.
We have nearly 30% of our fund in China – a significant overweight position that puts us in a good place to benefit from stimulus. But I did not need to travel to China to make this judgement.
I took this position by gleaning insights from a rigorous analysis of data. If anything, there is too much information. We use a proprietary system to sift through data from a range of sources, to make analysis more manageable. The building blocks are company fundamentals, behavioural insights and market trends. By comparing the characteristics of one company with the rest of the universe, we are able to identify a shortlist of companies with good growth and quality features and attractive valuations that merit closer inspection. It helps ensure we are empowered by information, not overpowered.
And AI is helping even more. Today, managers like us can use a news service from a data provider that takes articles from over 100,000 international news sources, translates them and feeds them into an ever-improving language-processing algorithm to tell us whether the coverage around any company is positive or negative. It all adds to our knowledge. And it is fast – if a company has a data leakage you know about it the next day. It gives you a more objective way of assessing the more granular characteristics of a business beyond company disclosures.
This home-comforts approach is not the only one. I am sure other managers – particularly those with a small-cap bias – will raise objections and say meetings still matter. I acknowledge that.
But this model works for me. It helps us overcome behavioural biases that can develop from tracking companies for long periods of time. It frees us from the emotional attachments to a business that might emerge from visiting. And it focuses our minds on the financial characteristics that really matter.
Moreover, our investment process is designed to deal with a range of market conditions, with diversification at the heart of our risk management approach. Ultimately, I believe this should all feed into performance.
Raheel Altaf is manager of the Artemis SmartGARP Global Emerging Markets Equity fund. The views expressed above should not be taken as investment advice.
Several of the Templeton Emerging Markets Investment Trust’s best performing holdings year-to-date are Chinese names.
China has been struggling to meet investors’ expectations in the post-Covid world, but just when people started wondering whether it was high time for a rebound, the CSI300 index (which tracks the performance of the top 300 stocks on the Shanghai and Shenzhen stock exchanges) shot up by 15.7% last week, taking some by surprise.
The catalyst for this sudden upswing came from the People’s Bank of China, which freed up about ¥1tn in long-term liquidity by reducing the reserve requirement ratio for banks by 0.5 percentage points, allowing them to lend more and support the economy.
It also cut the seven-day reverse repo rate (a tool used to manage liquidity and control short-term interest rates in the banking system) from 1.7% to 1.5%.
Performance of indices over 1 month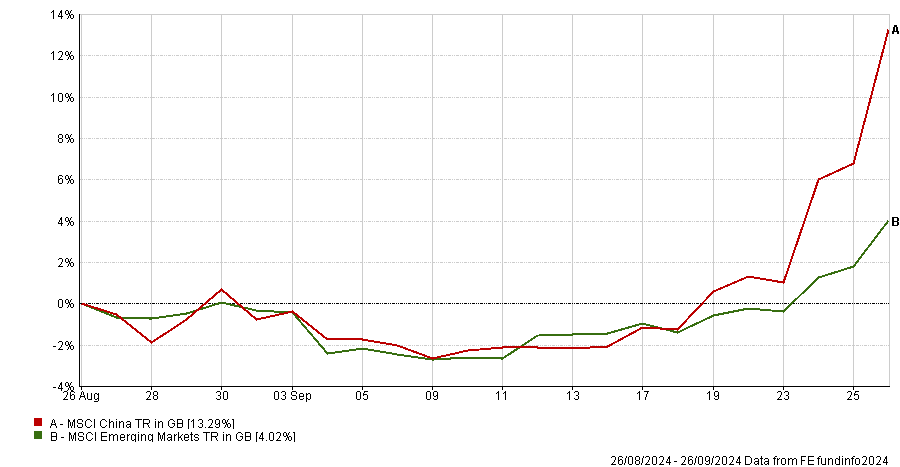
Source: FE Analytics
These measures triggered the best week in nearly a decade at China’s stock exchanges, as well as an upswing in European equities given the region’s trade links with China. But one good week doesn’t mean China is out of the woods. Below, Trustnet asked experts what investors should make of China’s stimulus package and how long the rally can continue.
Franklin Templeton’s Ness: Some of our best performers are Chinese companies
China used to be one of the largest underweights in the Templeton Emerging Markets Investment Trust portfolio, but manager Andrew Ness has gradually closed that underweight over the past three to four years. When last week’s moves began, the trust’s Chinese exposure was close to matching the 24.4% allocation of its benchmark, the MSCI Emerging Markets index.
“People talk about this China rally as if it has just happened, but if we look year-to-date, a significant number of our largest performers in the portfolio were Chinese names.”
They included internet and technology company Tencent, which was up 63% year-to-date, white goods manufacturer Haier Smart Home (+68%) and Brilliance China, the BMW joint venture partner.
Despite being “not without a challenge”, China remains an “investible” market, with plenty of strong points, including its “highly educated work force, world-class infrastructure and significant advantages in manufacturing, renewable energy and elective vehicles”.
The manager also argued that China could be considered as “politically stable, unlike much of the rest of the world”.
Whether the rally continues will depend on domestic consumption and investment, Ness said.
“Last week’s stimulus is going to be impactful in the short term, but the long-term sustainability of this rally is dependent upon the real economy impact and a pickup in domestic confidence from both a consumption and investment perspective,” he explained.
“The government finally recognizes that it needs to stimulate both those areas now, but will the combination of the monetary policy changes be sufficient for that? We are not sure. It is just too soon to say.”
Dennehy Wealth’s Richardson: We feel positive about China over the long-term
Joe Richardson, a discretionary investment manager at Dennehy Wealth, sold out of China a couple of months ago and decided to await “a more stable footing before considering re-entry”. He previously had direct exposure to Chinese stocks but used a stop-loss.
To him, the country is in a “painful but necessary” transition period and still facing “significant headwinds”, including an aging population and US sanctions.
“There is only so much technology you can copy, at some point China needed to innovate internally, shifting from producing low-tech goods like furniture and textiles to much more advanced sectors, such as semiconductors and broadcasting equipment,” he said.
“While still far behind Taiwan, it is making strides in key areas like electric batteries and artificial intelligence (AI).”
Almost 68% of top-quality electric battery papers cite Chinese research, compared to just 10% for the US. Similarly, in AI, 31% of top papers reference Chinese work, while the US accounts for 14%.
“They are really pushing technological breakthroughs so their limited labour force with high skills and capital can still flourish – that’s their number one priority,” he said. “We feel positive about China over the long-term.”
AJ Bell’s Mould: Chinese stimulus measures have a patchy success rate
Among the sceptics was AJ Bell investment director Russ Mould, who thinks the rally implies a level of investors’ FOMO (fear of missing out) but warned that in the past, stimulus measures have not lived up to investors’ expectations.
“A veritable feast of economic stimulus measures has led investors to take a more optimistic view of the earnings potential for Chinese companies,” he said.
Lower borrowing costs, smaller deposits for buying homes and more capacity for banks to lend money should lay the foundations for “greater economic activity” among businesses and consumers.
“On paper, it looks interesting. But whether the desired results end up meeting investors’ expectations is another thing,” he continued.
“China is notorious for throwing stimulus measures left, right and centre, and the success rate is patchy to say the least.”
Trustnet looks at the best performing global funds which took the most risks in the past five years.
Investment demands an element of risk-taking to generate returns but highly volatile funds are more likely to experience wide fluctuations in performance. While cautious savers often avoid volatile funds, for investors comfortable with taking higher risks, the pay-off of greater returns can be worth the bumpy ride.
Several global equity funds have successfully toed the line between high risks and high rewards. Below, we look at the funds in the bottom decile for volatility over the past five years that have enjoyed top-decile performance within the IA Global Sector.
This was a turbulent period for global equities, with the impact of the pandemic and high interest rates leading to challenging years for many of the funds below.
Returns and volatility of IA Global funds over 5yrs
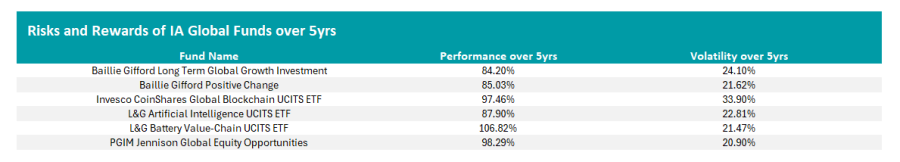
Source: FE Analytics; data in sterling terms to 31 Aug 2024
First up is the £739.6m PGIM Jennison Global Equal Opportunities fund, managed by Mark Baribeau and Thomas Davis.
Performance of fund vs sector and benchmark over 5yrs
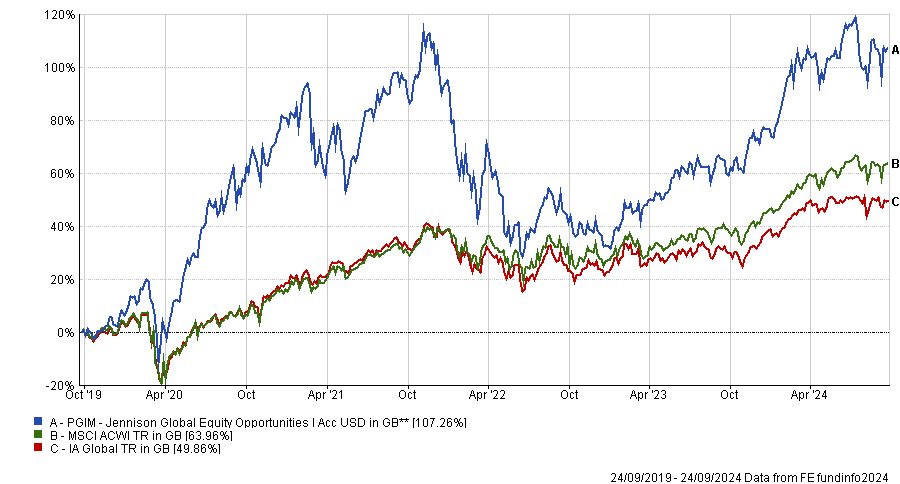
Source: FE Analytics
With volatility of 20.9%, the portfolio is one of the riskiest funds in the IA Global peer group, with one of the widest tracking errors in its sector at 14.7%.
This comparatively aggressive strategy saw one of the worst maximum drawdowns of -39.9% over the past five years. Yet the fund recouped its losses and achieved top-decile performance over the past five years, up by 98.3%.
As a result, its 0.53% Sharpe ratio ranks in the top quartile for risk-adjusted returns. Its other metrics have also been respectable with the portfolio enjoying alpha of 2.3 above the MSCI All Country World Index over the past five years. This makes the fund top-decile for alpha generation in the IA global sector.
This means that while the fund has doubtlessly been high risk, its investors have been amply compensated for the volatility.
Second, we have the £1.8bn Baillie Gifford Positive Change fund. Led by Kate Fox and Lian Qian since 2017, the fund has returned 84.2% over five years, with a total volatility of 21.8%.
Performance of fund vs sector and benchmark over 5yrs
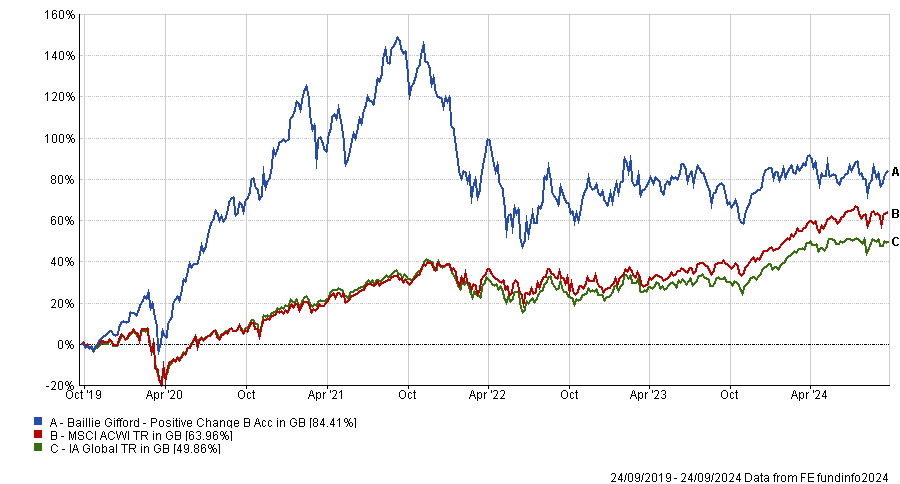
Source: FE Analytics
These results were down to consistently strong performance between 2018 and 2020. The fund has struggled more recently, however. Its top-quartile five-year performance was followed by a drop to the fourth quartile over three years and the past year.
The fund has maintained a strong reputation and is recommended by Square Mile, who have given it a Responsible A ranking on their Academy of Funds.
“We believe this fund is currently one of the most attractive responsible fund offerings in the market. Baillie Gifford has clearly put a lot of thought, effort and resources into this product,” analysts at Square Mile commented.
“It has a well-defined and distinctive investment process and places a strong emphasis on both returns and providing a positive impact over the long run.”
Finally, the £1.8bn Baillie Gifford Long-Term Global Growth Investment fund is one of the 10 riskiest funds in the sector, with 24.1% volatility.
Nevertheless, FE fundinfo Alpha Managers Mark Urquhart and John MacDougall, who helm the fund, have achieved top-decile performance, returning 84.2% over five years.
Moreover, the portfolio has enjoyed strong excess returns, generating alpha of 2.6 above the MSCI ACWI. This puts the fund within the top quartile for alpha generation in this period.
Performance of fund vs sector and benchmark over 5yrs
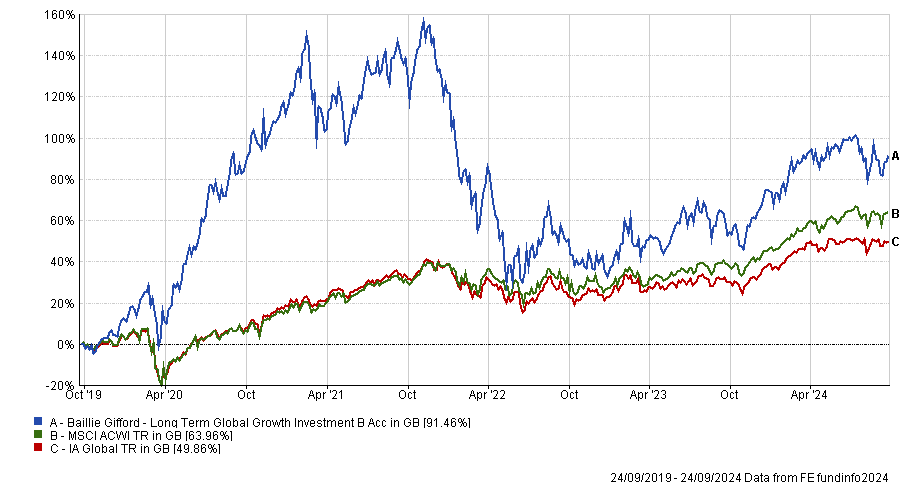
Source: FE Analytics
Over the past five years, the fund has experienced one of the widest tracking errors in the peer group, at 21.4%, a bottom-quartile ranking. It also experienced one of the largest maximum drawdowns compared to its peers at -49.4%, the sixth largest in its sector.
Finally, three sector-specific exchanged-traded funds (ETFs) in the IA Global peer group gave their investors a white-knuckle ride that was ultimately rewarding. The most notable of these was the £389m L&G Battery Value-Chain UCITS ETF, which was the only fund that matched our criteria and enjoyed returns of over 100%.
Other examples include the £514.3m L&G Artificial Intelligence UCITS ETF, as well as the £405.3m Invesco CoinShares Global Blockchain UCITS ETF which ranked amongst the most volatile funds in the IA Global sector but delivered top-decile performance.
Experts suggest satellite strategies to complement core fund holdings and construct a simple portfolio.
A well-diversified portfolio isn’t born overnight. Not only does it take effort, it also takes money – it’s no use finding a long list of great fund combinations if your investible pot is limited.
When time and money are scarce, investors must work with what they have got. One option would be to invest in a one-stop-shop solution, be it a multi-manager, multi-asset or index fund – but it doesn’t have to stop there.
Trustnet asked experts what other options are available for investors who want to go beyond one-stop-shop funds, but keep things simple. Below, they suggested two-fund portfolios with a core/satellite approach, whereby one fund bears the brunt of the heavy lifting while the second one complements and enhances it.
Fidelity Index World and Templeton Emerging Markets
Long-term, buy-and-hold investors might want to focus on equities rather than a multi-asset approach.
For them, a good pairing would be a core holding in a global developed market equities fund, coupled with a modest satellite position in emerging markets, according to Jason Hollands, managing director of Bestinvest.
His suggestion for global developed market equities is the Fidelity Index World fund, which tracks the MSCI World Index and has a low ongoing charges figure (OCF) of 0.12%. It provides “significant diversification across stocks at low cost,” he said.
For the satellite position in “less efficient” emerging markets, he proposed a selective approach through an actively managed portfolio such as the Templeton Emerging Markets investment trust.
Performance of fund against sector and index over 10yrs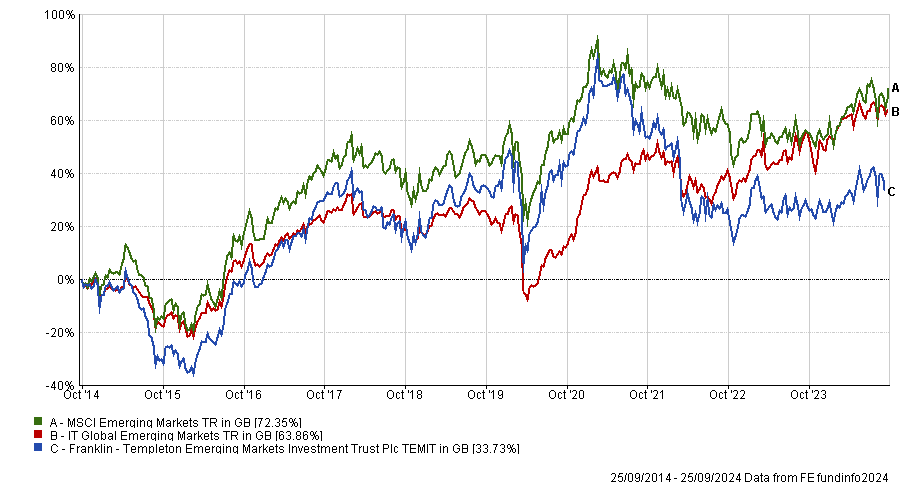 Source: FE Analytics
This trust is “the grandaddy of emerging market investments”, having been launched in 1989. Since the departure of veteran investor Mark Mobius, it has been managed by Chetan Seghal and Andrew Ness, who “leverage a research team that is embedded across local markets”.
“The trust benefits from having a very pragmatic and patient philosophy, investing in companies with sustainable earnings power that are mispriced,” Hollands said.
Currently, nearly 81% of the portfolio is invested in Asia, with technology and financials being notable themes.
Polar Global Insurance and Troy Trojan
Director of Fairview Investing Ben Yearsley picked the satellite fund first – Polar Global Insurance.
“The satellite is easy. It’s one of my favourite funds, albeit a niche one; I use it for low and high risk,” he said.
“You’d be hard-pressed to find any of its stocks in most other portfolios, as it mainly focuses on reinsurance and catastrophe insurance companies.”
The £2.4bn strategy has achieved a maximum FE fundinfo Crown Rating of five and has been “very consistent over the long term”, having delivered 10% per annum over a very long period.
Performance of fund against sector and index over 10yrs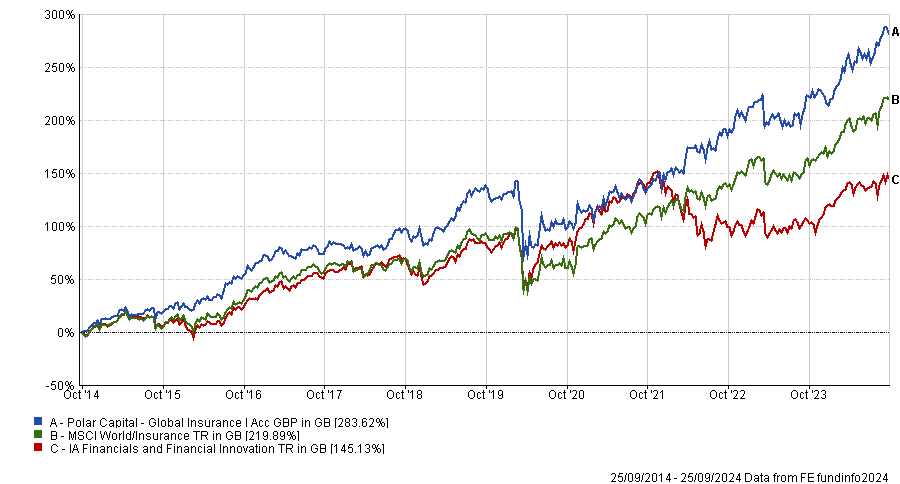
Source: FE Analytics
For core exposure in a small portfolio, he wanted to avoid excessive volatility, so he also went with Fidelity Index World. It offers “cheap, broad-based coverage” and is suitable for higher-risk investors.
Those who would rather keep risks at a minimum might prefer Troy Trojan, managed by FE fundinfo Alpha Manager Sebastian Lyon and Charlotte Yonge. It seeks to protect wealth from inflation through exposure to quality companies, gold and inflation-linked government bonds.
JOHCM Global Opportunities and BlackRock Global Unconstrained Equity
Finally, Rob Morgan, chief analyst at Charles Stanley Direct, opted for two global equity funds – JOHCM Global Opportunities for the core allocation and BlackRock Global Unconstrained Equity as the satellite.
Performance of portfolios (with 70% in core and 30% in satellite) against IA Global sector over 3yrs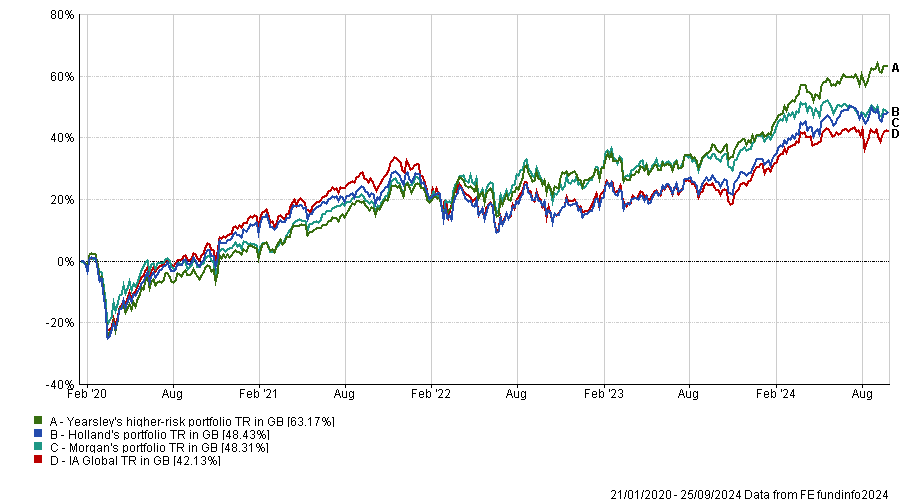
Source: FE Analytics
The JOHCM fund can be considered for “part of an investor’s core allocation to global shares, especially for those wishing to keep their portfolio anchored by characteristics of quality and value”, he explained.
The fund is neither growth or value biased, instead exploring what the managers refer to as the ‘forgotten middle’ where quality, growth and value styles intersect.
“As well as a concentrated portfolio, where stock picking has a significant impact, the approach emphasises capital preservation,” Morgan said.
“If insufficient attractive opportunities are identified, the managers are prepared to hold some cash.”
This all-weather fund is paired with BlackRock Global Unconstrained Equity, a “punchy, growth-orientated option” that is likely to be “more volatile, given the very high-conviction approach”.
It is managed by Alistair Hibbert, best-known for his success in unconstrained European equity funds. The manager searches for the “growth compounders” of the coming decade and beyond, with no regard for any benchmark.
“This is a pure stock-picking fund with a very defined approach and style in the hands of an accomplished manager,” said Morgan.
“It makes for a good complement to a broader equities fund or a tracker.”
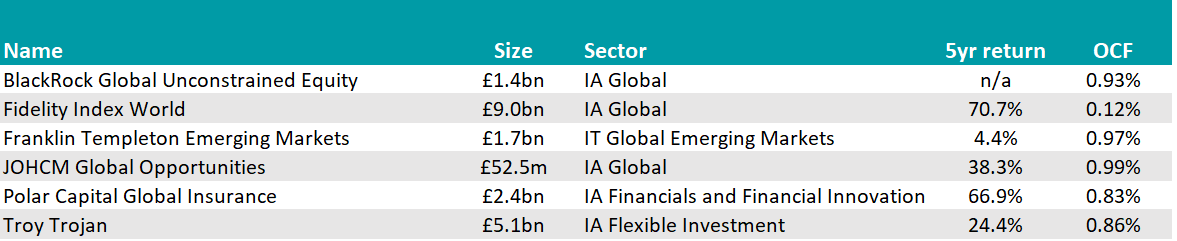
Source: FE Analytics
The information contained within this website is provided by Allfunds Digital, S.L.U. acting through its business division Digital Look Ltd unless otherwise stated. The information is not intended to be advice or a recommendation to buy, sell or hold any of the shares, companies or investment vehicles mentioned, nor is it information meant to be a research recommendation. This is a solution powered by Allfunds Digital, S.L.U. acting through its business division Digital Look Ltd incorporating their prices, data news, charts, fundamentals and investor tools on this site. Terms and conditions apply. Prices and trades are provided by Allfunds Digital, S.L.U. acting through its business division Digital Look Ltd and are delayed by at least 15 minutes.
© 2024 Refinitiv, an LSEG business. All rights reserved.
 Please wait...
Barclays Investment Solutions Limited provides wealth and investment products and services (including the Smart Investor investment services) and is authorised and regulated by the Financial Conduct Authority and is a member of the London Stock Exchange and NEX. Registered in England. Registered No. 2752982. Registered Office: 1 Churchill Place, London E14 5HP.
Barclays Bank UK PLC provides banking services to its customers and is authorised by the Prudential Regulation Authority and regulated by the Financial Conduct Authority and the Prudential Regulation Authority (Financial Services Register No. 759676). Registered in England. Registered No. 9740322. Registered Office: 1 Churchill Place, London E14 5HP.