Mergers and acquisitions are “part of life” for smaller companies, but the Strategic Equity Capital manager expects the current M&A frenzy to calm down.
Private equity firms have capitalised on low valuations in the UK stock market to acquire a spate of small- and mid-cap companies, prompting concerns about the ‘smid’-cap sector shrinking.
However, FE fundinfo Alpha Manager Ken Wotton disagrees, believing M&A to be a cyclical phenomenon unlikely to persist at the current pace.
Besides, mergers and acquisitions constitute one of the strategies he uses to create value for Strategic Equity Capital, the investment trust Wotton has managed since 2020.
Performance of fund since Wotton’s appointment vs sector and benchmark
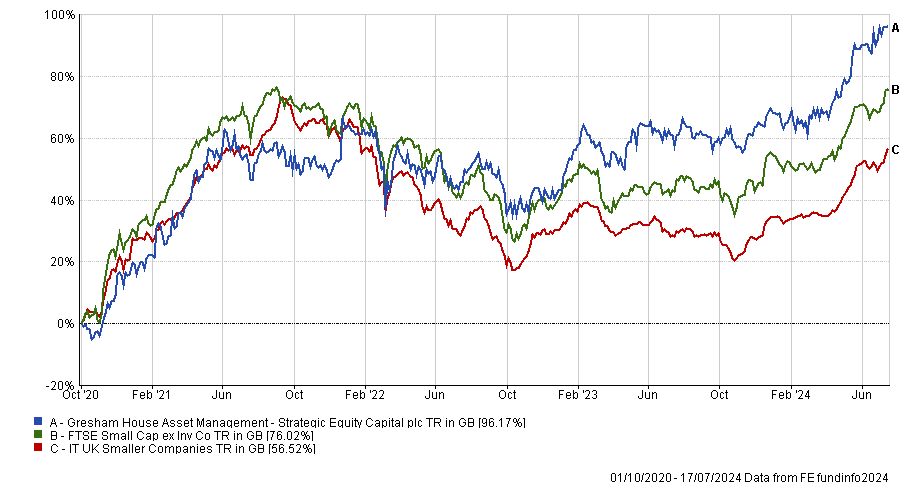
Source: FE Analytics
Below, Wotton explains why at least 75% of his fund is held in just 10 companies and how he sometimes intervenes to prevent M&A transactions.
Could you explain your investment strategy?
We describe it as taking a private equity approach to investing in public markets. When we invest in a company, we expect to hold it for three to five years, and because of that time horizon, we think of ourselves as owners of the business rather than holders of shares.
We do more due diligence than the typical public market investor. We try to build high conviction investment cases on the individual holdings.
We take a very concentrated portfolio approach and typically have around 20 holdings in the fund, with 75% to 80% of the value of the fund in the top 10. The next 10 holdings are toehold stakes where we look to potentially increase our investment in the future.
Because we take larger equity stakes in the companies we back, we have a platform for active engagement with their management teams and boards, enabling us to add more alpha.
What characteristics do you look for in a business?
We want to find businesses that are growing. Ideally, they are benefiting from structural growth drivers in their market or have self-help levers allowing them to gain market share even if the overall market isn't growing.
We're also looking for businesses that are profitable, have good margins and can turn profits into cash. Typically, they don't have much financial gearing, because we're trying to find low-risk situations.
We also want to back high-quality management teams. We might complement that by introducing non-executive directors who have the right skills and capabilities to help our investee companies.
There are certain sectors we avoid. We don't invest in oil and gas, mining, banks or real estate. That’s because we want businesses that are not overly impacted by external cyclical factors.
Why should investors buy your trust?
It provides an idiosyncratic, low correlation play on UK small-caps. The businesses we hold are not well researched, not well known and the market they operate in is less efficient.
Because UK small-caps are currently out of favour, we think there's a structural discount for businesses that have the size we're targeting. If we can apply our resources and expertise to find the right companies, there's an opportunity to get a really attractive return.
We try to help our companies tell their stories more effectively and do certain things to get recognised. Even if they are not re-rated, we can make returns through earnings growth and cash generation.
The M&A market is an alternative option for value realisation. Because of the stakes we take in our businesses, we have influence over that and can typically enable an M&A transaction to happen if we think it's a good price. However, we will stop the transaction from happening if the price is bad.
We don't want all our companies to be taken over, but it is an option for value creation.
Several UK small-cap companies are being taken over by private equity firms; does that worry you?
Not really, M&A is a part of life when investing in smaller companies and it's always been a feature of the fund. More than a quarter of the names we've ever owned have ended up being taken out.
We're at a point in the cycle where the disconnect between equity valuations and private markets is such that there's an arbitrage opportunity, which is attractive to private equity and corporates, but that won’t stay around forever.
We were in the opposite situation three years ago. In fact, 2021 was the biggest year for initial public offerings (IPOs) in the UK in a decade. Private equity and venture capital funds IPO-ed their businesses rather than buying businesses from the market. That’s why I think it's a cyclical phenomenon.
What have been your best and worst performing stocks over the past 12 months?
Our best performer has been XPS Pensions Group, which is an actuarial consultancy business and pensions administrator. It's our largest holding and has all the financial characteristics that we like.
It operates in a non-cyclical market because regardless of whether the economy is growing, trustees of pension funds require actuarial valuations and advice on how to comply with regulation.
Over the past 12 months, the share price has performed very strongly because XPS Group has had a series of upgraded forecasts and accelerating earnings growth.
Performance of stock over 1yr
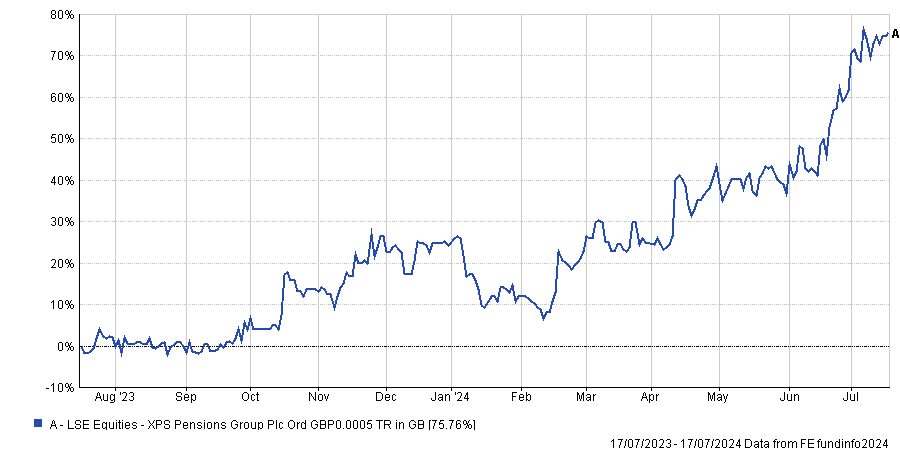
Source: FE Analytics
The worst performer has been R&Q Insurance Holdings, which is a specialist insurance business.
Its historic business model was balance sheet-based. The company made money by acquiring books and legacy liabilities from other insurers or corporates and then running off those books more profitably.
R&Q Insurance Holdings has been switching to a fee-for-service model, akin to the fund management industry. It means getting third-party capital to acquire these books of business through fund vehicles and then getting a fee for managing them. That's a better quality of earnings and less capital intensive business model.
Unfortunately, some issues in the legacy part of the business came to the fore and caused a profit warning, which has inflicted stress on the balance sheet.
Performance of stock over 1yr
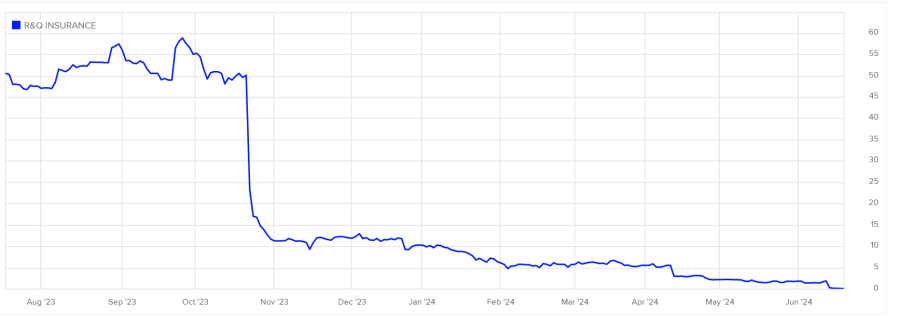
Source: London Stock Exchange
What do you do outside of fund management
I am into electronic music, so I like DJing.
Trustnet reveals which regional equity funds investors are backing and ditching this year.
Investors have been making extensive use of cheap passive funds to increase their exposure to regional equity markets during the first half of this year, according to fund flow data from FE Analytics.
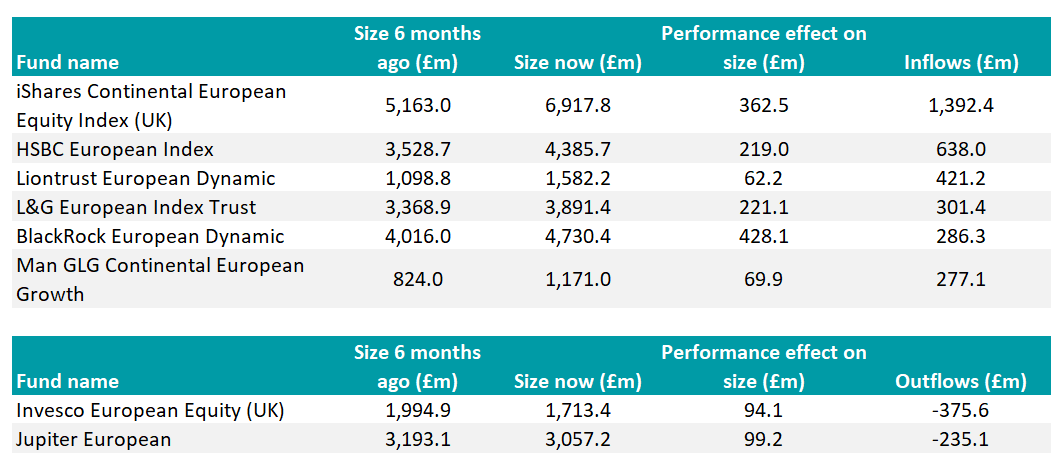
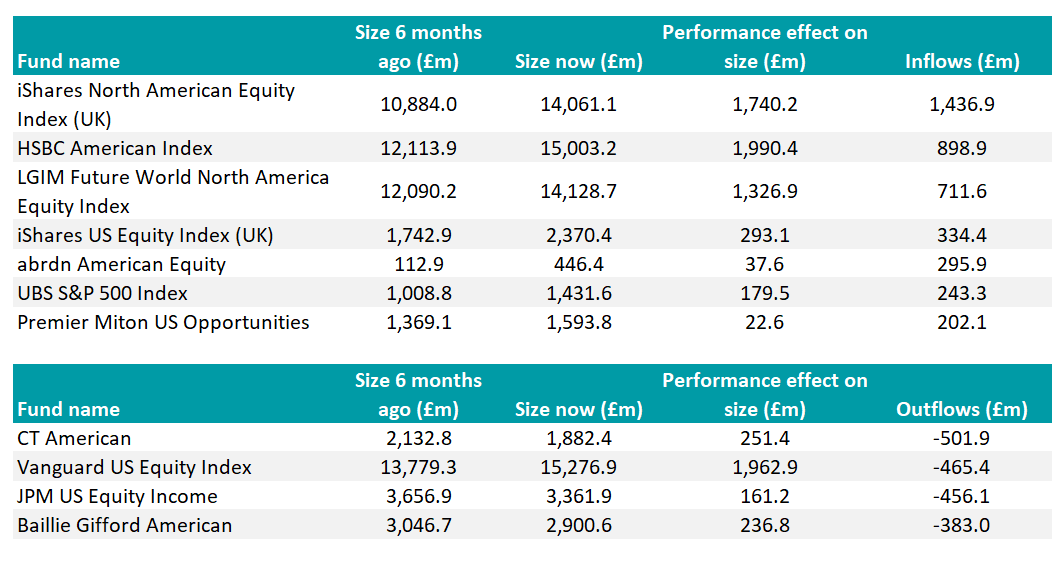
BlackRock’s iShares range of passive regional strategies proved the most popular with investors, who funnelled £1.4bn apiece into iShares Continental European Equity Index (UK) and iShares North American Equity Index (UK) during the first six months of this year.
They also ploughed £925m into iShares Japan Equity Index (UK), £353m into iShares Pacific ex Japan Equity Index (UK), and almost £200m apiece into iShares Emerging Markets Equity Index (UK) and iShares Emerging Markets Equity ESG Index (UK).
European equities
Investors increasing their exposure to Europe ex-UK chose passive funds managed by HSBC Asset Management, Legal & General Investment Management and Vanguard.
The most popular active funds were Liontrust European Dynamic, BlackRock European Dynamic and Man GLG Continental European Growth, which took in £421m, £286m and £277m, respectively.
Of these, only Liontrust European Dynamic beat the average fund in the IA Europe Excluding UK sector over three years, losing less than the others in the 2022 bear market. All three funds beat their peer group over five and 10 years.
Performance of funds vs sector over 3yrs
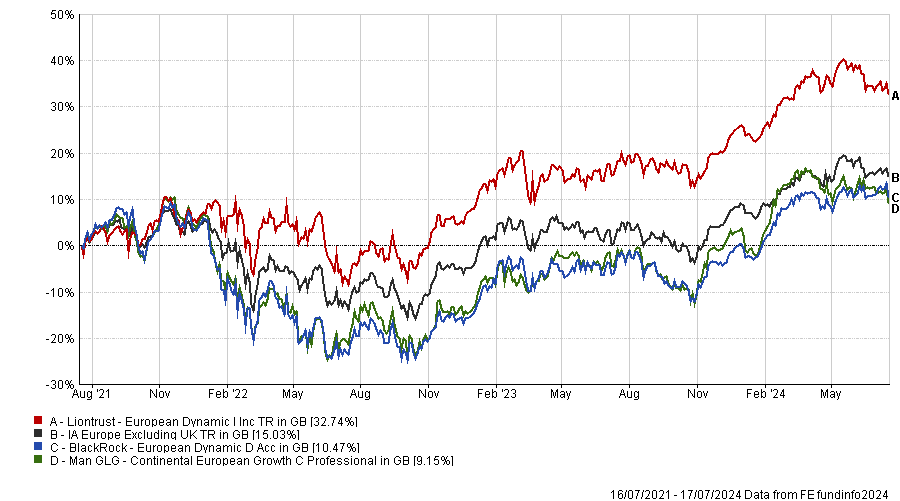
Source: FE Analytics
Managed by James Inglis-Jones and Samantha Gleave, the £1.5bn Liontrust European Dynamic fund is a top-quartile performer over three and five years but slipped to the second quartile in the past 12 months.
Its largest holdings are Novo Nordisk, which has a dominant position in the diabetes and weight loss drug market, and ASML, whose lithography technology is used to mass produce semiconductor chips.
Meanwhile, investors took £376m out of Invesco European Equity (UK) and £235m from Jupiter European.
Invesco European Equity achieved top-quartile performance over three years but slipped to the fourth quartile in the past 12 months and its five-year track record has lagged the sector average.
Jupiter European is fourth quartile over one and three years but FE Alpha Manager Mark Heslop, who has been running the fund with Mark Nichols since 2019, has a stronger long-term track record.
Funds attracting or shedding more than £200m in 1H 2024
 Source: FE Analytics
North America
Given how well the major US benchmarks and their largest sector, technology, have performed this year – and how efficient the US large-cap market is generally believed to be – it is no surprise that investors gravitated towards cost-effective passive strategies.
HSBC American Index gained £899m in inflows and LGIM Future World North America Equity Index took in £712m, on top of the £1.4bn flooding into iShares North American Equity Index (UK). However, investors took £465m out of Vanguard US Equity Index.
Funds attracting or shedding more than £200m in 1H 2024
Source: FE Analytics
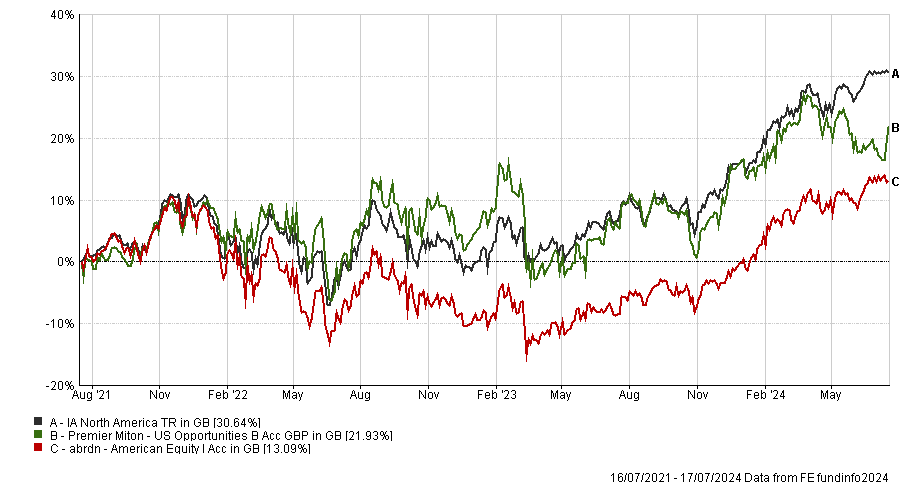
Just two actively managed funds received more than £200m in inflows: abrdn American Equity and Premier Miton US Opportunities. Both funds lagged their peer group average over three years, as the chart below shows.
Performance of funds vs sector over 3yrs
Source: FE Analytics
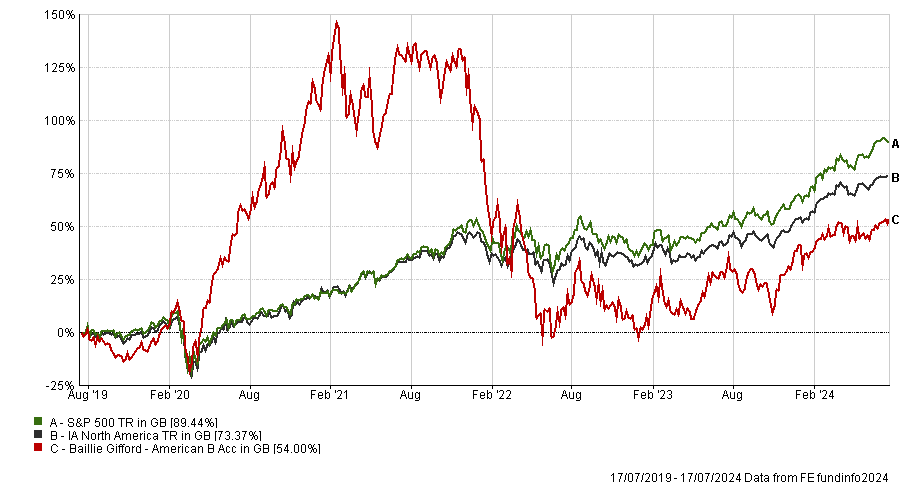
Three active funds suffered significant outflows: CT American (shedding £502m), JPM US Equity Income (£456m) and Baillie Gifford American (£383m). The latter spiked during the Covid recovery but then gave back most of its gains, as the chart below illustrates.
Performance of funds vs sector and benchmark over 5yrs
Source: FE Analytics
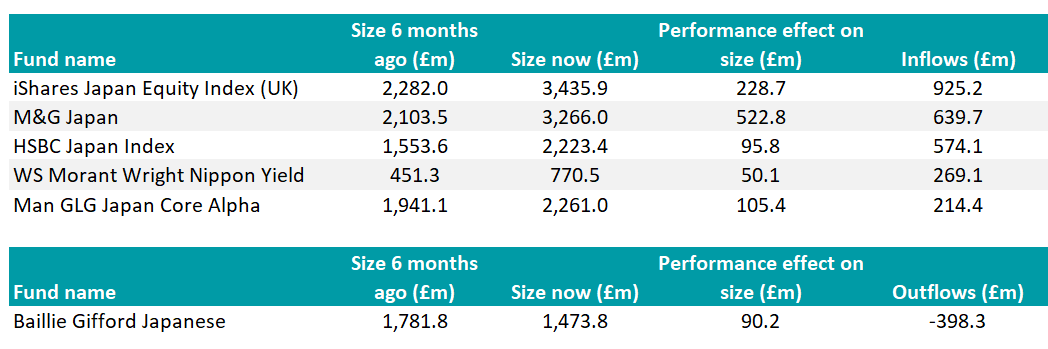
Japan
Investors bought into Japan’s equity rally, selecting M&G Japan, Man GLG Japan Core Alpha and Morant Wright Nippon Yield – complemented by passive strategies from iShares and HSBC.
Performance of funds vs sector over 3yrs
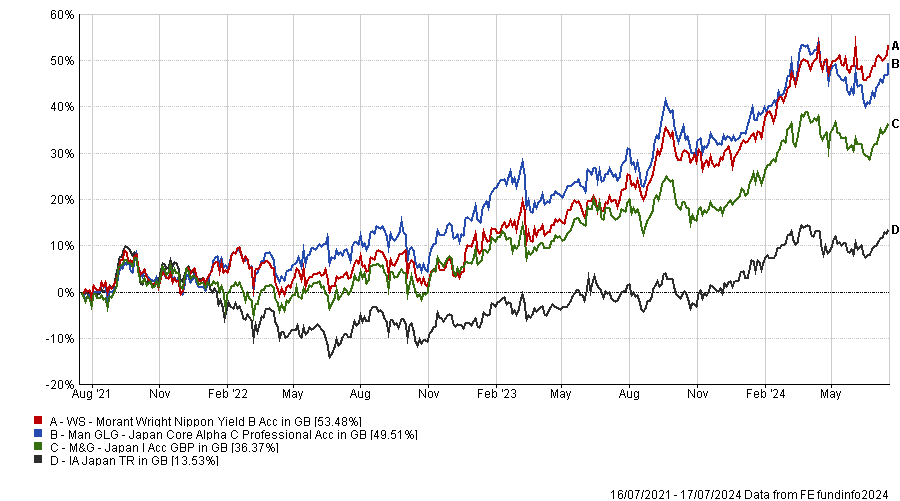
Source: FE Analytics
The Tokyo Stock Exchange’s reforms are targeting companies trading at a price-to-book value below one, and to find them, investors need to look at mid-caps, said Rob Starkey, a multi-asset portfolio manager at Schroder Investment Solutions. That is Morant Wright’s “hunting ground”, he added.
Value managers such as Man Group are also well placed to find cheap companies that will benefit from corporate governance reforms, he argued. Schroders uses Morant Wright Nippon Yield and Man GLG Japan Core Alpha in its multi-asset and model portfolio solutions.
Baillie Gifford Japanese was the only fund in this region to see significant outflows, with investors pulling £398m in reaction to poor performance.
Funds attracting or shedding more than £200m in 1H 2024
Source: FE Analytics
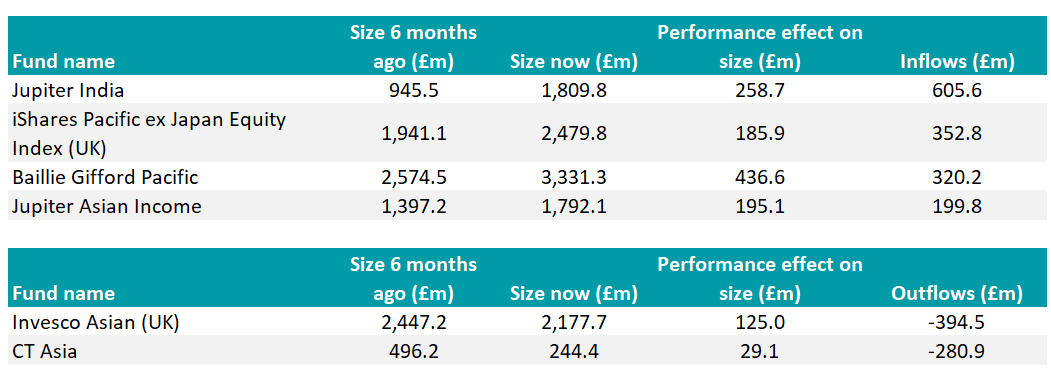
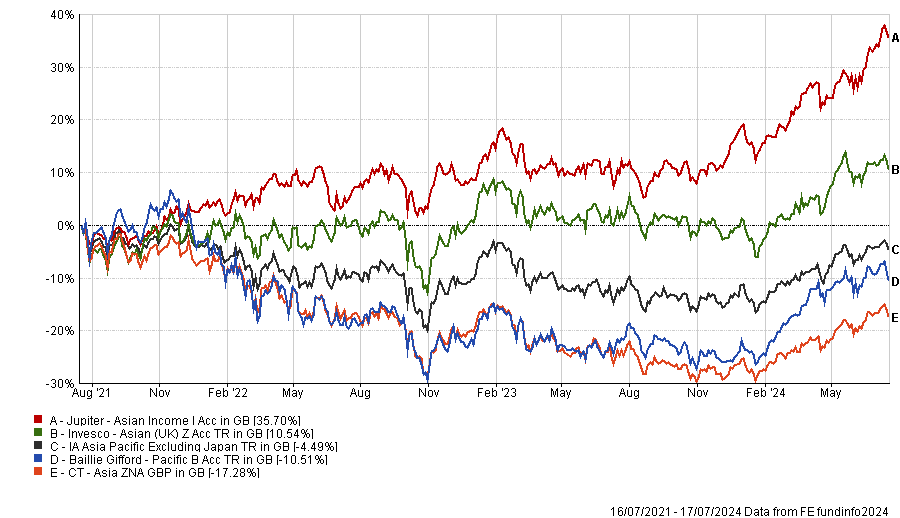
Asia Pacific
For their Asian equity allocations, investors put £320m into Baillie Gifford Pacific for growth and gave £200m to Jupiter Asian Income for stellar performance plus dividend yields, whilst also allocating to passive strategies from iShares and abrdn.
Jason Pidcock’s £1.9bn Jupiter Asian Income fund is a top-quartile performer over one, three and five years, beating its peers by avoiding China completely and favouring Australia, Taiwan and India.
Jupiter India was also popular with investors seeking exposure to one of the world’s best performing markets. It took in £606m during the first half of this year.
Funds attracting or shedding more than £200m in 1H 2024
Source: FE Analytics
At the other end of the spectrum, investors took £395m out of Invesco Asian (UK) and £281m from CT Asia.
Performance of funds vs sector over 3yrs
Source: FE Analytics
Emerging markets
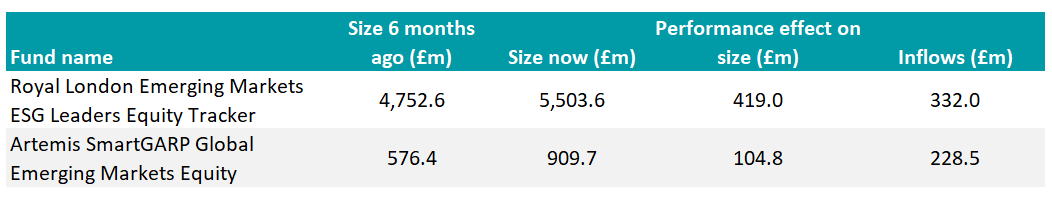
Investors chose a combination of active and passive funds for emerging markets. Royal London Emerging Markets ESG Leaders Equity Tracker was the most popular strategy, bringing in £332m.
Artemis SmartGARP Global Emerging Markets Equity was the top choice amongst actively managed funds, gaining £229m. No funds had outflows over £200m.
Performance of fund vs sector and benchmark over 3yrs
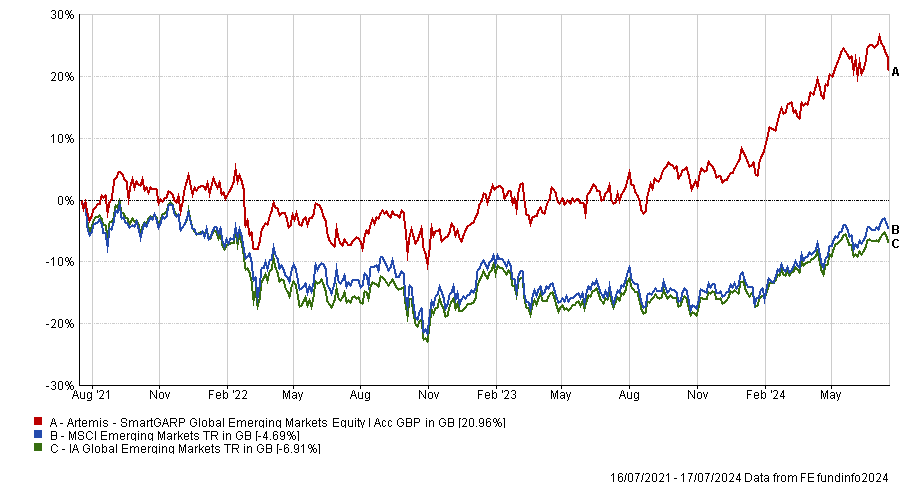
Source: FE Analytics
Artemis has combined its portfolio managers’ stock-picking abilities with quantitative tools to generate “phenomenal performance”, Starkey said.
Investors were undeterred by the resignation of former fund manager and leader of the SmartGARP strategy Peter Saacke, who left the firm at the end of June to become a maths teacher.
Funds attracting or shedding more than £200m in 1H 2024
Source: FE Analytics
Trustnet reveals which investment companies in alternative sectors are top-quartile performers, with yields above government bonds.
Perhaps more than any other area of the market, those assets listed as alternatives have a crucial role in portfolios. In most cases they need to provide returns but also diversification away from the more vanilla equities and bonds. For some, such as those in retirement, income will also be a key priority.
A range of investment trusts with exposure to debt, property, infrastructure and renewable energy are ticking all the boxes – delivering top-quartile total returns over three years, a steady income stream and diversification away from investors’ equity and bond allocations. Below Trustnet reveals the best.
Debt strategies
Six trusts across the three IT Debt sectors (Direct Lending, Structured Finance and Loans & Bonds) meet the criteria.
Marble Point Loan Financing was the best performer from a total return perspective, returning 54.6% over three years to 17 July 2024 and paying a 15.8% annual dividend yield (as of April 2024).
Total returns and yields of debt trusts

Source: FE Analytics, trusts’ factsheets
While falling interest rates should provide a boon for most debt strategies, QuotedData analyst Matthew Read singled out CQS New City High Yield as “the best-positioned of its peers to benefit” because it has locked in decent yields in advance of rate cuts.
The trust is “consistently one of the highest-dividend-yielding funds in its peer group and, over the longer term, is also one of its best-performing,” Read continued.
“It has benefitted from an uplift in capital values as the headwind of higher interest rates that weighed on bond valuations in 2022 and 2023 has turned tailwind.”
Leasing
Two trusts in the leasing sector delivered impressive three-year total returns and high yields.
Amedeo Air Four Plus and Doric Nimrod Air Two are paying out 19.4% and 15.3% respectively, with three-year total returns of 99.4% and 119.5%. Amadeo has a market capitalisation of £125.4m and Doric is slightly larger with £145.6m.
Total returns of trusts vs sector over 3yrs
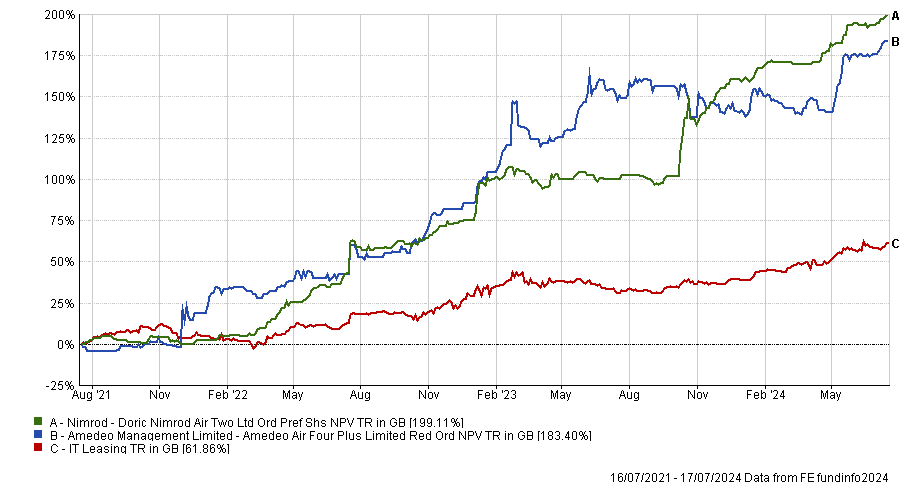
Source: FE Analytics
Both trusts acquire, lease and sell aircraft and they benefited from a strong recovery in air passenger traffic last year.
Amadeo’s chairman Robin Hallam said: “Demand for travel remains strong and constraining factors are related to capacity. Manufacturers cannot make up the shortfall in supply of aircraft, engines and parts which occurred between 2019 and 2022, which means lease rates and values for in demand aircraft are rising, especially if they are off lease and immediately available.”
Infrastructure
Four trusts investing in renewable energy infrastructure delivered top-quartile, positive returns for the three years to 18 July 2024 and yields above 4%.
The NextEnergy Solar fund had the highest yield of the group at 10.2%, followed by Bluefield Solar Income with an 8.8% payout, Greencoat UK Wind (7.4%) and Foresight Solar (6.3%).
The top performer over three years was Greencoat UK Wind, which returned 24.5% and is expected to benefit from the Labour government repealing the ban on onshore windfarms.
Performance of trusts vs sector over 3yrs
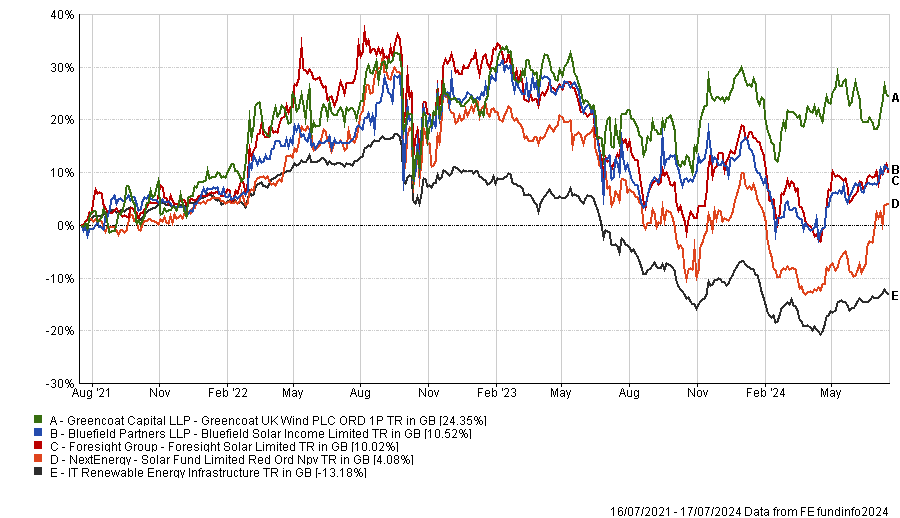
Source: FE Analytics
As Tommy Kristoffersen, manager of EdenTree Green Infrastructure, explained: “Last week, new chancellor Rachel Reeves arguably did more for onshore wind development in England in 72 hours than previous governments had done in over a decade by removing the restrictive clauses which had made onshore wind development nigh on impossible since 2015, marking a significant advancement in renewable energy support and opening up a pipeline of investment potential.”
Peter Hewitt, who manages the CT Global Managed Portfolio Trust, expects the value of Greencoat UK Wind’s assets to rise now the sector has a “clearer road ahead” and the government is making “positive noises”. The £3.2bn trust is trading on a 13% discount.
Real estate investment trusts
Three trusts in the UK commercial property sector and two property debt strategies delivered top-quartile, positive total returns over three years and yields above 4%.
The best performer was Starwood European Real Estate Finance, up 22.3% over three years. It pays a 6% yield. Next in line was Alternative Income REIT, which returned 17.5% over three years and yields 8.7%.
Cheyne Capital Management’s Real Estate Credit Investments had the highest yield of 9.8%, although its three-year total return was just 9.2%. AEW UK REIT yields 7.96% and returned 10.2% over three years.
The fifth trust on the list, Schroder Real Estate Investment Trust, returned 8.1% over three years and yields 8.2%.
Four more REITs were top-quartile performers in their sectors but they lost money over three years as the interest rate hiking cycle took its toll, so they have been excluded from this study.
Going forward, however, a range of tailwinds including imminent interest rate cuts and the Labour government’s housebuilding initiatives and planning reforms should boost the property sector.
Hedge funds
Gabelli Merger Plus was the best performing strategy in the IT Hedge Fund sector over three years to 17 July 2024 (up 46.1% whereas the sector was flat) and it has a 5% distribution yield.
The trust invests in cash-generating franchise companies, selling at a significant discount to Gabelli’s appraisal of their private market value. The trust generates returns when the prices of its investee companies rise due to corporate events such as mergers, acquisitions, takeovers or leveraged buyouts.
Interest rate cuts, elections and markets in different stages of the economic cycle may make investing tricky in the coming months, the wealth manager warns.
The world is going through a period of uncertainty. Although the perils of Covid appear to be over, geopolitical tension, wars, elections and sluggish macroeconomics are all things investors may be concerned about for the remainder of 2024.
Hetal Mehta, head of economic research at St. James's Place (SJP), believes there are some important areas that will shape markets over the remaining six months.
The first is economies worldwide, which are in various stages of either recovery of repricing. “Recession risks have subsided, but the conditions necessary for strong economic acceleration are not yet present,” she said.
The overall picture is an improving one, with global economic uncertainty broadly returning to pre-Covid levels.
Heading around the world, in the US a ‘soft landing’ scenario of inflation gradually reducing and growth picking up remains on the cards, but issues persist. “Inflation is on a gradual decline, but services inflation is still elevated and higher commodity prices are filtering through to the economy,” he added.
However, the upcoming US election adds a layer of uncertainty that could affect market volatility, said Mehta. She believes the result is “too close to call”.
In the UK meanwhile, the new Labour government is likely to leave high-level policies unchanged and will have little ability to “borrow or grow its way out of trouble” as inflation and wages are still “too high for comfort”.
For emerging markets, China still looms large, she noted, with “scepticism about Chinese stimulus”. However, inflation is less of a concern here.
Justin Onuekwusi, chief investment officer at SJP, said interest rates will play a big role for the rest of the year.
“Central banks face high-stakes decisions. After years of hiking interest rates, attention is turning to how quickly and easily central banks can reverse course,” he said.
In June, Canada became the first country in the G7 to cut rates, with the European Central Bank opting to follow suit soon after.
It is a different story in the UK, where inflation has fallen to 2% but the Bank of England’s key metric – service sector inflation – remains at 5%.
This is even worse in the US, where the Federal Reserve is contending with 3% inflation. Onuekwusi said here it was “even stickier, which could cause the Fed to be “even more cautious”.
Even if rates do fall, however, investors should not expect them to go back to the ultra-low era of the recent past.
How SJP is investing
Onuekwusi noted that higher interest rates should be good for equities, but not those that are heavily indebted. “Focusing on companies that are less sensitive to higher interest rates, especially those with strong balance sheets, low debt levels and solid cash flows, can be prudent,” he said.
Robin Ellis, director of portfolio strategies at SJP, added that markets are likely to be more volatile, but still able to deliver “attractive risk-adjusted returns”.
The firm is underweight the US, although it remains the largest regional allocation across the firm’s Growth Portfolios, as well as the Polaris and InRetirement ranges.
"This boils down to recent high performance and valuations. We believe it is wise to diversify more into other global markets to balance future risks and returns. Specifically, we increased our allocations to developed markets outside the US, which we feel are well placed to provide good returns from a cheaper starting point,” he said.
On bonds, Onuekwusi said interest rates have upped yields and made bonds attractive, particularly if central banks are slow to cut. Fixed income therefore “once again provides effective diversification”, he added.
This also impacts alternatives, where “the bar for incorporating alternatives into our portfolios has been raised” as the risk-reward potential for owning these assets instead of bonds is lower.
Ellis noted the firm’s multi-asset ranges are “more constructive” on the outlook for government bonds, both in terms of yield and diversification, moving this allocation towards neutral at the expense of corporate bonds, which have “continued to benefit from strong demand and supportive credit conditions”.
“Following robust performance and a tightening of spreads across corporate bond markets, we have now reduced our positioning to neutral,” he concluded.
If you are looking for undervalued stocks, you will find them in Japan.
Although the Japanese equity market is the second largest among the world's developed markets, it still has the inefficiencies of an emerging market. For investment managers, there are many opportunities to generate alpha.
Large, but inefficient
As the world's second-largest stock market in a developed nation after the USA, the Japanese stock market offers investors a large and broadly diversified investment universe.
At the same time, however, it exhibits inefficiencies that are otherwise only found in the equity markets of emerging countries.
If a market is very inefficient, i.e. many companies are misvalued, this naturally creates investment opportunities for market experts. The chances of an investment manager outperforming a corresponding benchmark index are much higher in the Japanese equity market than in other parts of the world.
One reason for the inefficiency of the Japanese stock market is that, although Japan is home to several global market leaders in various industries and is therefore internationally positioned, it is also a very local market in many respects.
For international investors, many nuances are lost when talking to Japanese companies due to language and cultural barriers alone.
Inefficiencies are also caused by the low coverage of the Japanese equity market by analysts. There is a considerable amount of good coverage on the mega caps in Japan. But this coverage decreases significantly the smaller the stocks become, even though the Japanese equity market is dominated by companies with a medium market capitalisation. As a result, the Japanese equity market is less well covered on both the sell and buy side.
There are also historical reasons for the lack of interest from international investors.. In 1989, the Japanese stock market was the largest market in the world and made up around 45% of the MSCI World Index. Eight of the 10 largest companies in the world were Japanese banks, which is why Japan was a well-known and overvalued market for a long time.
After the bubble burst, a devaluation followed that went far beyond what would have been justified by the relative earnings growth of Japanese companies. As a result, Japanese equities are now trading at a significant valuation discount to their counterparts in other developed markets, and international investors are still heavily underweight Japanese equities despite the recent revival of interest.
A new view of Japan is needed
The existing narrative surrounding the Japanese stock market needs to change. In terms of earnings per share (EPS) growth, for example, Japan has outperformed not only Europe and Asia ex Japan, but also the US over the past 10 years.
There is another success story in the area of corporate governance. Under prime minister Shinzo Abe, structural reforms had already been initiated to improve the capital efficiency of listed Japanese companies and to strengthen the focus on shareholders.
These reforms have recently received further impetus from initiatives by the Tokyo Stock Exchange (TSE). These efforts are now bearing fruit. The data shows that Japanese companies have indeed improved their corporate governance in recent years and this is already having a positive impact on company performance.
As a result of decades of deflation, Japanese companies have also significantly reduced their debt levels, as debt would incur real costs in a deflationary environment. Around 45% of companies in the MSCI Japan Index that do not belong to the financial sector now have a net cash position. In addition, the non-financial sector's net debt to equity ratio is now lower than in the rest of the world and only half the historical highs.
However, these successes are not being recognised by global investors because they have not yet been reflected in spectacular returns, as is the rule with similar developments in the US.
In Japan, we see that profits are rising, but multiples are continuing to shrink. This is completely different from the US, where multiples are climbing along with earnings. For this reason, many investors are overlooking the fundamental improvement.
Return of inflation
And there is another factor that is having a positive effect on the Japanese economy and the country's stock market: the return of inflation. Following the end of the deflationary phase, Japanese companies and private households are now rethinking.
Companies are investing more again and are also prepared to take certain risks for strategic reasons, which is reflected in an increasing number of mergers and acquisitions, among other things.
There is a similar change in private households. The mindset of many Japanese, characterised by decades of deflation – as little debt as possible, as little consumption as possible, restraint in investments – is gradually reversing.
Consumer spending is increasing and investments in their own stock market have multiplied, supported by government subsidies.
The size of the market, its inefficiency, undervaluation, attractive companies and changing consumer attitudes – together these factors create an attractive environment for investors. If you are looking for undervalued stocks, you will find them in Japan.
June-Yon Kim is lead portfolio manager for Japanese equities at Lazard Asset Management. The views expressed above should not be taken as investment advice.
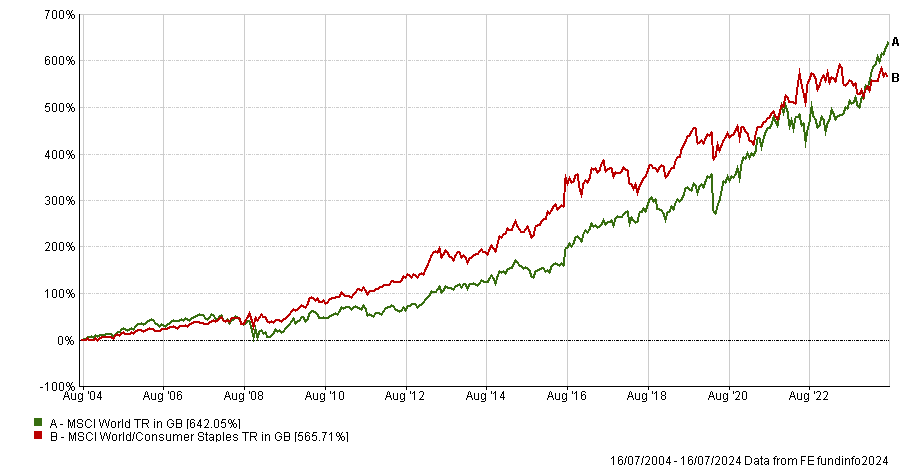
With valuations at attractive levels and margins expected to increase, this could be a buying opportunity for the consumer staples sector.
Consumer staples stocks have underperformed the broader market recently but the sector’s long-term credentials are compelling and, with valuations at historically cheap levels, this looks like an attractive entry point, according to global equity managers.
The MSCI World Consumer Staples sector has traded at an average premium of 15% to the MSCI World for the past two decades and 20% for the past 10 years. These are stable, high-quality businesses so they arguably justify a higher multiple, said Ian Mortimer, manager of Guinness Global Equity Income.
The sector outperformed during the bear market of 2022 and briefly got to a 30% premium but it has de-rated since then.
This year, it has fallen far behind the MSCI World due to technology’s dominance in the index and because investors have been rewarding growth, Mortimer explained.
Performance of consumer staples vs broader market over 20yrs
Source: FE Analytics, performance data in sterling terms
Today, the global consumer staples sector trades at less than a 5% premium to the broader market. “If you are a believer in reversion to the mean then you could see the upside potential of that premium going back to where it has been historically,” Mortimer said.
The $5.9bn Guinness Global Equity Income fund has been overweight staples since inception with a 15-20% average allocation due to these companies’ healthy dividends, high returns on capital, earnings growth and ability to outperform in falling markets. It currently holds 25% in staples versus 7% for its benchmark.
During the past couple of years, as inflation has increased, companies have passed on higher costs to their customers by raising prices. Now that input costs are coming down, companies are unlikely to reduce their prices in lockstep, so they have the potential to generate excess earnings.
“The margin picture has improved substantially year-over-year, and this expansion looks set to continue,” Mortimer explained.
Consumer staples companies usually grow their dividends in line with their earnings growth, so by 3-4% a year, but recently dividends have grown at about 5%, reflecting companies’ stronger earnings, he said.
Mortimer also likes the downside protection that consumer staples companies provide. The sector has a relative downside capture of 78% and has outperformed in all but one of the past 11 significant drawdowns.
Consumer staples outperform in most downturns
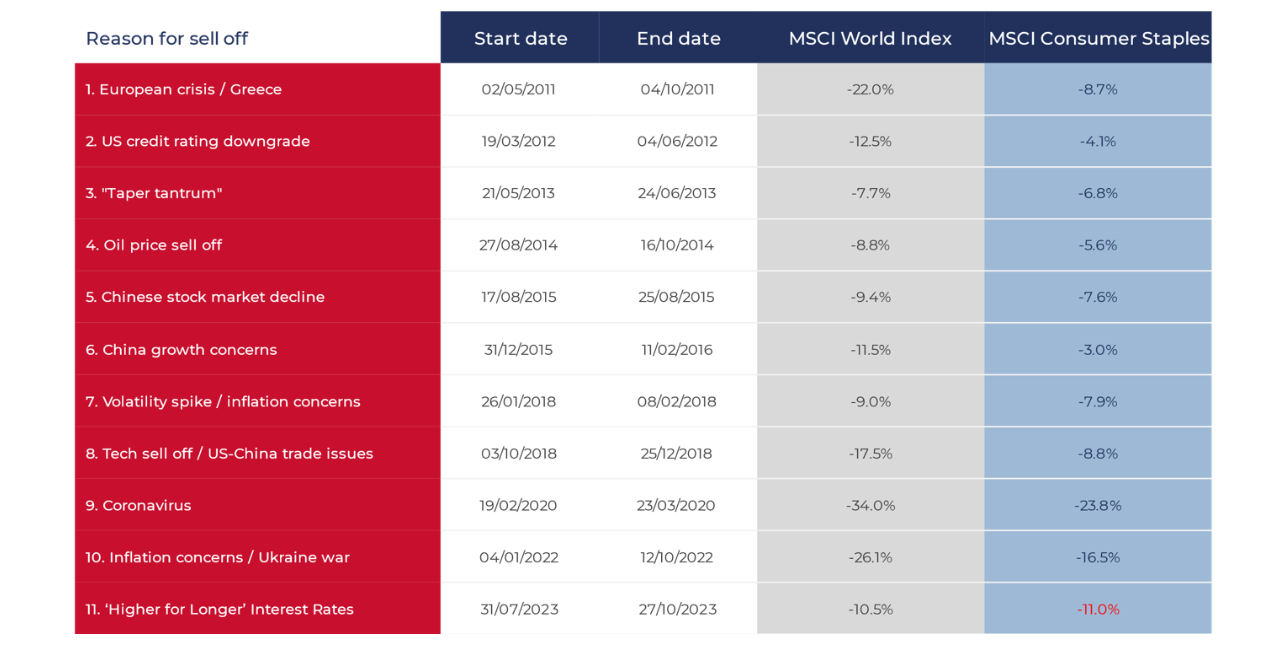
Sources: Guinness Global Investors, Bloomberg, data in US dollar terms
Below, three global equity managers pick out a consumer staple they are banking on.
Lindt
The £448m Evenlode Global Equity fund initiated a new position in Lindt this year. The premium chocolate maker had been on Evenlode’s watch list for a long time but portfolio manager Chris Elliott said it has always been “reassuringly expensive”. However, the cocoa price has shot up during the past six months, weighing on Lindt’s share price, which provided Evenlode with a buying opportunity.
Lindt is well positioned because it has hedged its cocoa supply for the rest of this year and into next year. The company possesses significant reserves of cocoa and it is more dependent on South America for its production (whereas most cocoa suppliers source from Africa.)
Share price over 12 months in Swiss francs
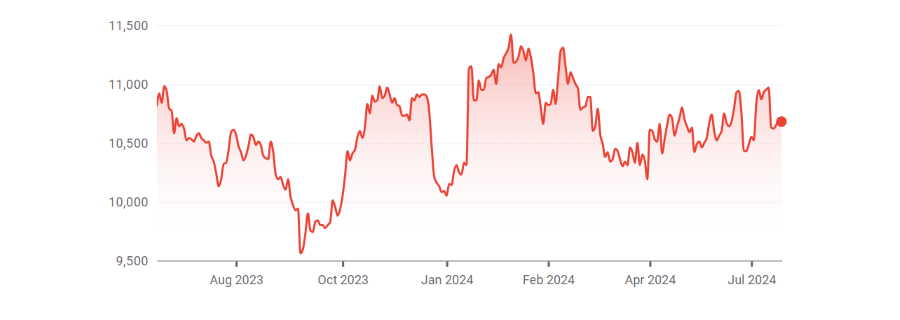
Source: Google Finance
Colgate-Palmolive
Within the diverse consumer staples sector, household, toiletry and health product producers have the best sustainable growth prospects, according to Gerrit Smit, manager of the Stonehage Fleming Global Best Ideas Equity fund. “These are everyday need products with less economic risk,” he said.
Smit holds Colgate-Palmolive, whose portfolio of items that everybody needs generates “very stable and certain organic growth”. Its main brands have “a high loyalty factor”, he added.
The company’s Hills Pet Nutrition business provides “further profitable organic growth” and has the potential to expand its distribution, both in the US and elsewhere, he added.
Share price over 12 months in dollars
Source: Google Finance
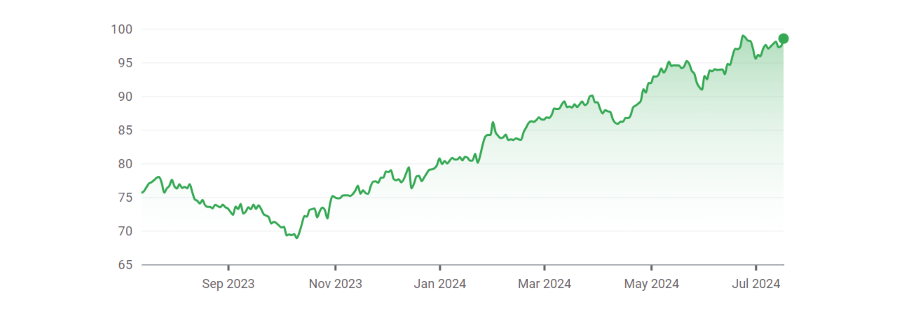
Mondelez International
Guinness Global Equity Income – an equally-weighted portfolio – holds a variety of consumer staples, including Diageo, Nestlé, Procter & Gamble, Danone, Unilever, Reckitt Benckiser, The Coca-Cola Company and PepsiCo.
Cadbury owner Mondelez International is one of the cheapest, Mortimer said, due to the increase in cocoa prices and concerns over its input costs.
Share price over 12 months in dollars
Source: Google Finance
Mondelez has tried to increase its margins by cutting costs, removing layers of management and improving operating efficiency, with early indications that these efforts are bearing fruit, he said.
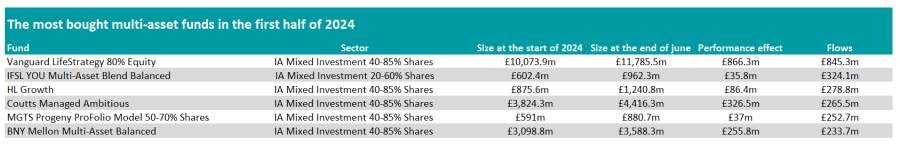
Trustnet looks at the multi-asset funds attracting and shedding the most money in the first half of the year.
Only six multi-asset funds across the IA Mixed Investment 40-85% Shares, IA Mixed Investment 20-60% Shares and IA Mixed Investment 0-35% Shares and IA Flexible Investment sectors received more than £200m of inflows in the first half of the year.
Vanguard LifeStrategy 80% Equity was by far the most sought-after multi-asset fund during that period, with investors pouring £845.3m into this popular low-cost passive investment solution.
In addition to inflows, the fund's performance in the first six months of the year enabled it to grow its assets under management by £866.3m
Vanguard LifeStrategy 80% Equity now boasts a size of £12bn, making it the second-largest fund in the IA Mixed Investment 40-85% Shares sector after its stablemate, Vanguard LifeStrategy 60% Equity.
IFSL YOU Multi-Asset Blend Balanced came in a distant second, with investors adding £324.1m to the fund.
It was the only multi-asset fund outside of the IA Mixed Investment 40-85% Shares sector to attract more than £200m of inflows.
Source: FE Analytics
Investors also contributed between £200m and £300m to HL Growth, Coutts Managed Ambitious, MGTS Progeny ProFolio Model 50-70% Shares and BNY Mellon Multi-Asset Balanced.
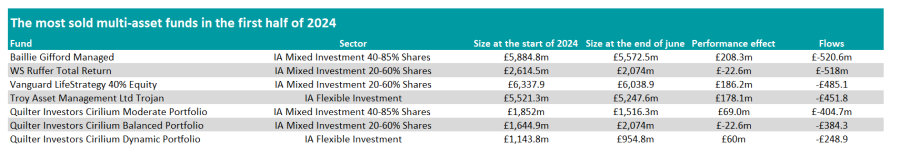
At the other end of the spectrum, Baillie Gifford Managed shed the most in client assets, as investors withdrew £520.6m.
The fund sits in the top quartile of the IA Mixed Investment 40-85% Shares sector over 10 years, but it is the sector’s worst performer over three years.
Like most Baillie Gifford funds, it follows a distinctive growth style that thrived in the post-global financial crisis era but suffered when inflation and interest rates began rising in the second half of 2021.
WS Ruffer Total Return also shed more than £500m in the first half of the year.
Ruffer took a bearish view on equity markets that did not materialise, which dragged on its performance.
However, the fund’s five-year returns were better, placing it in the top quartile of the IA Mixed Investment 20-60% Shares sector.
Trojan, which focuses on capital preservation, lost £451.8m in the first half of this year, as its low allocation to equities proved detrimental.
Deputy manager Charlotte Yonge explained her wariness toward equities at the beginning of the year, noting that they were not priced for the recession she was expecting.
The fund has a significant tilt toward fixed income but also holds gold, which has surged due to election uncertainties in 2024, wars and economic instability. As a result, the fund’s performance helped to compensate for the outflows.
Source: FE Analytics
Investors also withdrew £485.1m from Vanguard LifeStrategy 40% Equity, the largest fund in the IA Mixed Investment 20-60% Shares sector.
Finally, three funds from Quilter Investors shed more than £200m in the first half of the year.
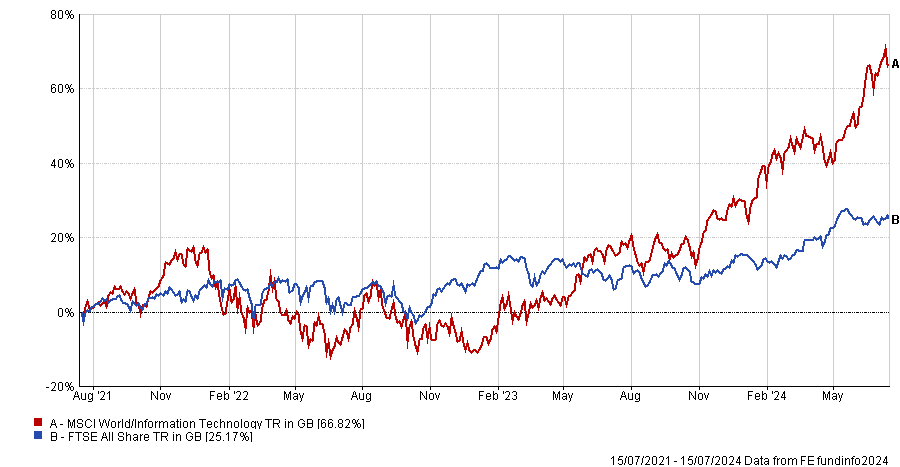
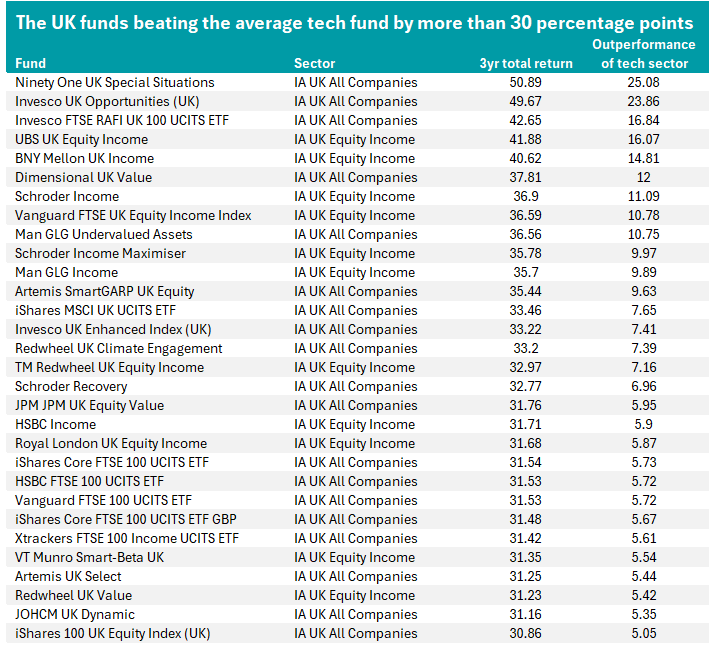
Trustnet finds that close to 20% of UK funds are ahead of the IA Technology & Technology Innovation sector over three years.
More than 60 UK funds are boasting three-year returns higher than the average tech fund, data from FE Analytics shows, as the domestic market comes back into favour.
Tech stocks have been the darlings of the market for an extended period, with the so-called Magnificent Seven (Apple, Microsoft, Alphabet, Amazon, Nvidia, Meta Platforms and Tesla) surging in recent years. At the same time, the UK market has been unloved as investors were put off by Brexit, a lacklustre economy and political infighting among multiple Conservative governments.
Given this, it should come as little surprise that the FTSE All Share is far behind the likes of the MSCI World Information Technology index. Over the past three years, the FTSE All Share made a total return of 25.2% while the global tech index gained close to 67%.
Performance of UK equities vs global tech over 3yrs
Source: FE Analytics
However, the Investment Association sectors focused on these stocks paint a different picture.
IA Technology & Technology Innovation is still in the lead, with its average member sitting on a 25.8% total return over the past three years. But the IA UK Equity Income sector isn’t too far behind with a 21% average return. IA UK All Companies is up 10.1% while the average IA UK Smaller Companies fund is down 13.2%.
Within the UK equity sectors, quite a few funds have managed to beat the average IA Technology & Technology Innovation strategy over three years: 65 out of 346 funds (or 18.7%) with a long enough track record.
The 30 UK funds that have beaten the IA Technology & Technology Innovation sector by at least 5 percentage points can be seen in the table below. At the very top is Ninety One UK Special Situations; its 50.9% three-year return is 25 percentage points ahead of the average tech fund.
Managed by Alessandro Dicorrado and Steve Woolley, the £485m fund has a value approach that looks for ‘cheap’ companies. These tend to be stocks that are down 50% from their peak relative to the FTSE All Share over the past seven years.
Analysts at Rayner Spencer Mills Research said Ninety One UK Special Situations is a good option for investors seeking exposure to value stocks but should be paired with a growth fund rather than being the only UK holding in a portfolio.
“This is a concentrated fund with a significant bias towards value stocks,” they added. “It is likely to underperform in markets driven by growth-orientated companies, particularly when sentiment is less valuation sensitive. When there is a rally in value stocks, this fund should be a major beneficiary and outperform the market and peer group.”
Source: FE Analytics. Total return in sterling between 16 Jul 2021 and 15 Jul 2024
Although value investing was out of favour for an extended period following the global financial crisis, it has had moments of strong outperformance in recent years. The MSCI United Kingdom Value index is up 43.2% over three years, compared with a 17.8% gain from the MSCI United Kingdom Growth.
This dynamic means that many of the funds at the top of the above table follow the value style, especially as the UK market tends to have a value tilt thanks to high allocations to sectors such as banks, energy, consumer staples and industrials.
Indeed, all of the funds that have beaten the IA Technology & Technology Innovation average by more than 10 percentage points – Invesco UK Opportunities, Invesco FTSE RAFI UK 100 UCITS ETF, UBS UK Equity Income, BNY Mellon UK Income, Dimensional UK Value, Schroder Income, Vanguard FTSE UK Equity Income Index and Man GLG Undervalued Assets – as well as many of those that follow have a value bias.
A general uptick in the UK market, thanks to attractive valuations, improving macroeconomic data and the expectation of political stability, could also explain why some UK funds have been able to beat the average tech fund.
BlackRock – the world’s largest asset management house – recently went overweight UK equities, saying: “We see the Labour Party’s landslide UK election victory increasing the likelihood of a two-term government. The potential for long-term policy implementation should bring relative political stability, in our view.
“We think perceived stability can help improve sentiment – especially among foreign investors who own more than half of UK shares.”
The divergence in performance among underlying tech stocks is also a factor: not all parts of the tech market are soaring.
The bulk of the gains in recent years have been driven by the Magnificent Seven, so funds that avoided these companies have struggled. In recent months, some of these companies have even started to underperform.
Within the IA Technology & Technology Innovation sector, the best fund over three years is up around 85% (iShares S&P 500 Information Technology Sector UCITS ETF) while another four made total returns in excess of 60%. However, the worst performer is down more than 35% (WisdomTree Cloud Computing UCITS ETF) and another three have lost over 10%.
This diverging performance has had the effect of dragging the sector average down to the level that some UK funds have been able to beat, although no UK funds have been able to outperform the best tech funds.
Experts suggest where to put your cash if the Republican candidate wins the next election.
Markets are anticipating a victory for Republican presidential candidate Donald Trump in the upcoming general election, according to experts.
The recent assassination attempt, while a horrific episode, has reinvigorated the party at a time when president Joe Biden has come under pressure from fellow Democrats for his seemingly ill health.
Should Trump regain the presidency, markets could be rocky, but his previous term in power was one that could give investors hope. Indeed, although his first time in office was full of uncertainty, markets performed quite well, with all bar one S&P 500 subsector making gains, as the below chart shows.
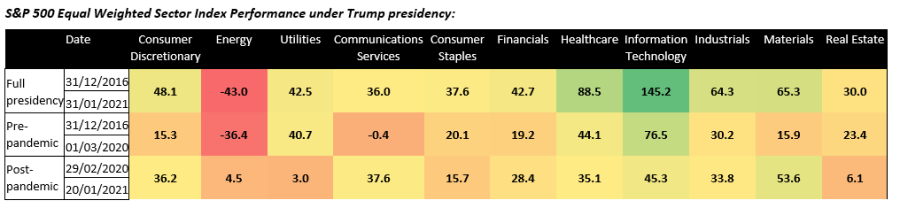
Source: Shore Capital
James Yardley, senior research director at Chelsea Financial Services, said defence stocks should thrive under Trump, who is expected to push for increased military spending.
“This focus on bolstering military capabilities, coupled with growing global security concerns, could create a strong tailwind for defence companies,” he said.
While the sector is largely admonished by environmental, social and governance (ESG) strategies, Yardley said the debate around the sector “is evolving”, and more investors “recognise the importance of security and defence in today's geopolitical climate”.
“This shift could lead to broader investment in defence stocks, potentially making them an attractive option in a Trump-led global economy,” he said.
Meanwhile, further down the market capitalisation spectrum, small-caps may do well under Trump as his ‘America First’ policies should encourage more spending on domestic goods.
Any potential increase in tariffs, particularly on goods from China, will likely benefit as a protectionist stance “could shield them from international competition and potentially boost their market share”.
Here, he likes the Artemis US Smaller Companies and T. Rowe Price US Smaller Companies Equity funds, which are “particularly well-positioned to benefit from this trend”.
“Furthermore, small-cap stocks tend to outperform in a falling interest rate environment, which will likely begin early into Trump's term,” Yardley said.
However, stocks that did well last time under Trump may continue to shine if he is re-elected, said Greg Eckel, portfolio manager of Canadian General Investments.
Leading the way during his previous tenure was technology, which gained 145%, with a particular rise during the final year when the Covid pandemic turbocharged online sales.
Eckel said the tech surge should continue
Healthcare names also thrived during his previous term, despite the former president’s efforts to overturn Obamacare and attempts to reduce the cost of pharmaceuticals.
This time around, however, investors should “be wary and expect a volatile environment irrespective of the next administration as the US healthcare industry is extremely complicated and highly prone to changes in government policy,” said Eckel.
Instead, investors may want to consider US industrials, which could benefit from “commitments to infrastructure build”, which seem to have “bipartisan support”.
Not all were convinced that US stocks would shine under Trump, however. Raphael Olszyna-Marzys, international economist at J. Safra Sarasin Sustainable Asset Management, said a possible “erosion of checks and balances” under Trump could hinder long-term economic growth, with bond yields expected to rise higher if there were to be a “Republican clean sweep”.
“The dollar might initially strengthen under Trump but could weaken over time,” he said, while equities “may gain from tax cuts initially but suffer later due to Trump’s broader policies impacting corporate profitability”.
“Overall, we believe Trump’s policies are likely to result in slower economic growth, higher inflation, increased bond yields, and a weaker dollar in the medium to long term,” said Olszyna-Marzys.
“In the short term, a looser fiscal policy stance could temporarily boost the economy, potentially lifting equity prices. Additional tariffs under Trump might initially strengthen the dollar, though this effect would likely diminish over time.”
Changing the rules might seem too clever by half, but are an effective way to mitigate some issues.
As Rachel Reeves moves into Number 11 Downing Street, she faces a fiscal conundrum. Her party’s manifesto pledged ‘no return to austerity’, yet she is inheriting plans containing significant spending cuts, and her room for manoeuvre is limited.
She’s pledged not to increase the four taxes that raise most revenue, and to retain fiscal rules that limit her scope to borrow. Squaring this circle won’t be easy. However, the situation is better than the gloomier prognoses suggest, and we’re still happy holding UK government bonds.
How did we get here?
A little history helps to explain Reeves’ bind. Since the late 1990s, the UK government has set itself fiscal rules designed to keep borrowing within sensible limits. The precise form of these rules has changed many times, as they have been overtaken by events.
But this time, the Starmer administration has pledged to retain the same key rule (the ‘fiscal mandate’) as its predecessor. This rule states that public debt must be projected (in the Office for Budget Responsibility (OBR) official forecasts) to fall relative to the size of the economy in five years.
The spectre of the market turmoil that followed former Prime Minister Liz Truss’ ill-fated ‘mini-Budget’ has quelled any appetite for big changes to this framework any time soon.
Fiscal rules are great in theory. However, in practice, they sometimes have significant unintended consequences. The debt rule has been no exception, which requires debt to be projected to fall relative to the size of the economy only in the fifth year of the forecast (and not over the period as a whole).
This meant Reeves’ predecessor Jeremy Hunt could offer tax cuts ahead of the vote, while meeting the rule by pencilling in spending restraint after the election. This respected the letter of the law, but not the spirit of it, kicking the can down the road for the next government.
Adjusted for inflation, the plans that Labour is inheriting leave spending per person on public services unchanged over the next five years. Since spending on the NHS is highly likely to rise by much more than inflation, that implies sharp inflation-adjusted cuts elsewhere.
Areas such as justice and local government, which are already under severe strain, in principle face reductions of more than 2% a year. That’s before factoring in the desire to raise defence spending to 2.5% of GDP.
The Institute for Fiscal Studies describes these plans (inherited from the previous government) as ‘fiscal fiction’ and argues they are not possible “while maintaining the current range and quality of public services”.
The new government will be unable (even with a large majority) and unwilling to push through what would be austerity 2.0. Doing so would do more harm than good, given signs that public services are still reeling from the impact of the pandemic on top of the original austerity programme.
Hospital waiting times are far longer today than in the early 2010s. Local government funding remains much lower now than in 2010 (after adjusting for inflation), contributing to problems including the growing number of car accidents caused by potholes. The justice system is under pressure too, with the backlog of Crown Court cases the longest on record.
Potential solutions
Therefore, Reeves needs to find a way to increase planned spending. In doing so, she faces several constraints. Labour has consistently emphasised its commitment to fiscal rules and included them explicitly in its manifesto. This limits her ability to borrow to fund more spending.
The party also promised in its manifesto not to raise the rates of income tax, national insurance, VAT and corporation tax — which together account for two-thirds of all government revenue.
The chancellor hopes that stronger economic growth will lend her a hand. If the economy performs better than the OBR’s projections, all the trade-offs she faces become much easier. Economic expansion lifts revenues without the need to raise tax rates.
With that in mind, Labour aims to support growth in three ways. First, by delivering the stability and predictability in policymaking that has been missing since the fallout of the 2016 EU referendum. Second, by directing more pension fund capital into UK companies. Third, by reform, especially of the planning system.
These goals are sensible enough. Investment in the UK has been held back by the post-2016 turmoil in domestic politics and in relations with our biggest trading partner. Pension funds invest much less than they could in UK firms, and the UK’s unusual planning system is clearly a barrier to growth.
If delivered, these changes may indeed help increase the long-term UK economic growth rate. Yet there are serious limits to this strategy when it comes to resolving the current fiscal bind.
One problem is that, even if all these proposals are enacted, any impact on growth may not be evident for years. In the coming quarters, blind luck will play a bigger role.
As an open economy, the UK is highly exposed to global developments, which are entirely out of the government’s hands. Whether the nascent economic recovery in the euro area flourishes or falters, for example, will probably make more difference in the short term than any of the domestic reforms floated.
A prudent working assumption is that there will be no surprise boost to growth in the next year or so, meaning the government will have to resort to a combination of other strategies.
One such strategy is to increase taxes not explicitly frozen in the manifesto. Capital gains tax and council tax are possible targets. They’re the biggest ‘unfrozen’ revenue raisers. While Labour officials may have said that they have no plans to change them, that can change.
A more left field idea (with advocates all the way from the Financial Times to Nigel Farage) is to change the way the Bank of England pays interest on reserves to commercial banks, reducing the amount it pays out. This would be a de facto tax on banks.
Reeves has sounded lukewarm when asked about this option, and Bank of England governor Andrew Bailey wasn’t enthusiastic either. But again, it can’t be ruled out entirely given the circumstances.
Another likely strategy is to test the flexibility of the fiscal rules. Ignoring them entirely, à la Kwasi Kwarteng, would be foolish and is not on the table. But many other chancellors have found ways to bend the rules to suit their objectives.
Like Hunt, Reeves could maintain as little ‘headroom’ against the rules as possible. Like Gordon Brown, she could use partnerships with the private sector to exempt some investment from the public borrowing statistics.
A further option this time around is to make a technical change to the way the Bank of England’s large holdings of government debt are treated in the fiscal rules. The independent Resolution Foundation estimates that this would allow the chancellor an additional £16bn of space against the debt rule — a significant difference.
Will markets care?
Treating the fiscal rules in this way may sound too clever by half. But experience suggests that markets will be forgiving. The rules are now in their 10th iteration since 1997, so alterations of this kind are the norm, not an aberration. There’s a difference between pushing the flexibility of the rules versus ignoring them entirely as Truss and Kwarteng did.
Markets are also likely to judge any extra borrowing based on its purpose. Borrowing to invest in the public services, which underpin the economy, is likely to be far more palatable than Truss-style unfunded tax cuts that today’s economic literature suggests were unlikely to boost growth.
Numerous studies of the UK and its peers have found that slashing public services proved to be a false economy in the 2010s, failing to prevent debt from rising. By hurting investment and growth, it ultimately weakened the government’s ability to meet its financial obligations. Avoiding a re-run would be a good thing.
With all of that in mind, we remain comfortable holding UK government bonds in portfolios. Yes, the spending restraint currently pencilled in almost certainly won’t happen, and the chancellor may find ways within the rules to borrow more than current plans imply.
However, investors have long been aware of the ‘fiscal fiction’ in these plans and are likely to tolerate some deviation from them. The global backdrop is also becoming more favourable for government bonds generally, with inflation back under control and interest rates starting to fall.
Oliver Jones is head of asset allocation at Rathbones Investment Management. The views expressed above should not be taken as investment advice.
The world’s largest asset management house highlights three ways it has moved to a risk-on stance.
BlackRock is upping risk – including by overweighting UK equities – despite macro headwinds such as sticky inflation, higher interest rates, slower growth and elevated debt as it believes “a transformation of a historic scale could be unfolding”.
In its latest note, the BlackRock Investment Institute said it is leaning into risk rather than waiting for clarity as it thinks the current investment opportunities transcend the “unusual macro backdrop”.
The firm, which is the world’s largest asset management house, pointed to the strong performance of US equities in the opening half of 2024, which rallied even as the Federal Reserve failed to deliver interest rate cuts.
Jean Boivin, head of the BlackRock Investment Institute, said: “The strength of US stock gains has been matched by corporate earnings beating expectations, led by a handful of AI [artificial intelligence] names. As a result, we see concentration as a feature, not a flaw, of today’s market environment.
“We expect some volatility ahead as markets grapple with a wide range of outcomes – as shown by last week’s brief retreat in tech shares. Recent low market volatility doesn’t reflect all risks ahead, in our view. We still think the next six to 12 months is a time to lean into risk but we prepare to reassess as new opportunities arise.”
S&P 500 relative performance, 2023-2024
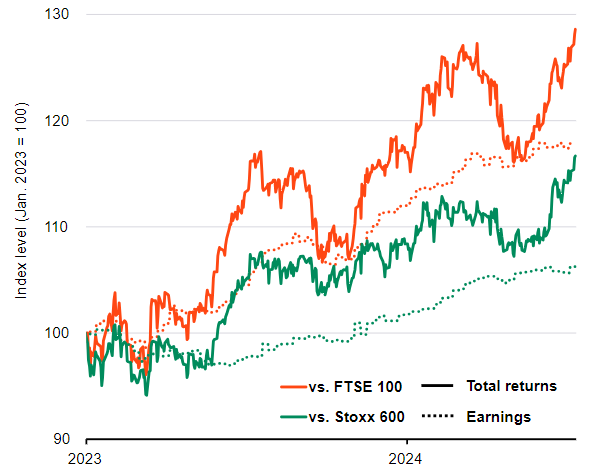
Source: BlackRock Investment Institute, with data from LSEG Datastream, Jul 2024. The chart shows the S&P 500 relative performance of total returns and 12-month forward earnings vs. the UK’s FTSE 100 and Europe’s Stoxx 600 indices
BlackRock highlighted three ways it is leaning into risk, with the first being maintaining an overweight to US stocks and the AI theme. The rationale behind this is the expectation that a concentrated group of AI winners will continue to drive returns.
The fund house believes the AI theme unfolding in three phases. The initial build-out phase is already yielding early winners, including major tech firms, chip producers and suppliers of essential inputs such as energy, utilities, materials and real estate. BlackRock thinks markets and central banks are underestimating the inflationary impact of this early phase.
The next phase could involve broader investment as more companies seek to leverage AI's power. The final phase, characterised by potential economy-wide AI productivity gains, remains highly uncertain and dependent on the full deployment of AI capabilities, a process that could take many years.
BlackRock has also gone overweight UK equities, which have been unloved for an extended period thanks to Brexit, a lacklustre economy and political infighting among multiple Conservative governments. However, attractive valuations, more resilient macroeconomic data and improved political stability have sparked optimism more recently.
“We see the Labour Party’s landslide UK election victory increasing the likelihood of a two-term government. The potential for long-term policy implementation should bring relative political stability, in our view,” Boivin said. “We think perceived stability can help improve sentiment – especially among foreign investors who own more than half of UK shares.”
The third way BlackRock is leaning into risk is by adding to its Japanese equity overweight, which is its highest conviction equity position because of the return of mild inflation, shareholder-friendly corporate reforms and a Bank of Japan that is cautiously normalising policy.
However, the firm added that it is balancing its risk-on stance with selective exposure to fixed income, focusing on quality. It prefers short-term government bonds and credit as they are yielding much higher income than pre-pandemic, following central banks’ interest rate hikes.
Rob Morgan, chief analyst at Charles Stanley, suggests a range of funds to meet new parents’ financial goals.
New parents face a multitude of competing demands, from immediate expenses like adjusting their home for the new family member, to longer-term investments such as building a portfolio for their child's future.
Accordingly, new parents might need to review their own investment portfolios and adjust them to their new situation.
Rob Morgan, chief analyst at Charles Stanley, urged parents to save and invest in different pots reflecting their different goals, be they short- or long-term in nature.
“Shorter-term needs are generally considered to be less than five years, perhaps putting money aside for family holidays or childcare. Longer-term goals include getting ready for retirement or preparing for school or education fees likely to be incurred in at least five years’ time,” he explained.
“Short-term needs are best addressed through saving cash and long-term ones through investing.”
He proposed a long-term asset allocation of around 85% to 90% in diversified equities, cushioned by and 10% to 15% in bonds and lower volatility investments.
“For the long-term portion of your investments, it’s necessary to harness growth through investing in the stock market, while perhaps having one eye on other costs that might crop up further down the road. It might therefore be appropriate to take sufficient risk to maximise returns whilst remaining diversified to take the edge off inevitable stock market volatility,” Morgan said.
He also called on investors to keep the long-term objective of the portfolio (at least 10 years) in mind and avoid tinkering with it.
Below, Morgan has built an investment portfolio tailored to the needs of new parents.
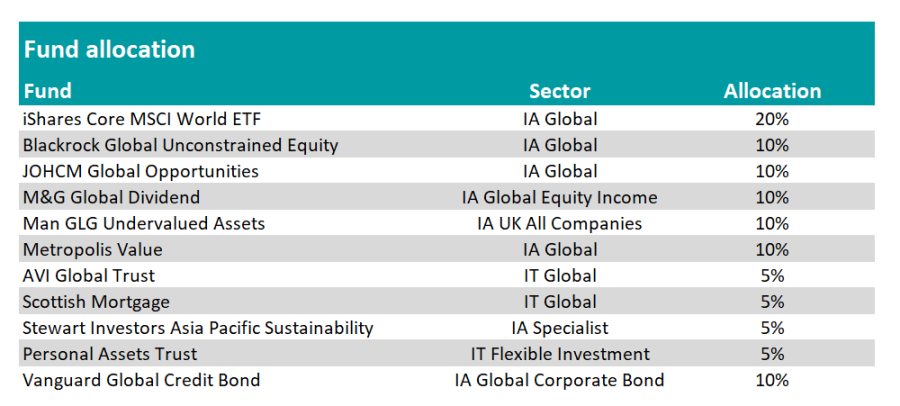
Source: FE Analytics
iShares Core MSCI World ETF
His largest allocation is iShares Core MSCI World ETF, which accounts for 20% of the overall portfolio.
The purpose of this fund is to provide low-cost core exposure to global markets, around which more specialist strategies can be added.
It charges investors 0.2% and has exhibited a tracking error of 0.49 relative to the MSCI World index over the past 10 years.
BlackRock Global Unconstrained Equity
The next fund in Morgan’s portfolio is BlackRock Global Unconstrainted Equity, with an allocation of 10%.
The fund, managed by FE fundinfo Alpha Manager Michael Constantis and Alister Hibbert, was launched in January 2020, with the top 10 holdings accounting for 63.7% of the portfolio.
Performance of fund since launch vs sector and benchmark
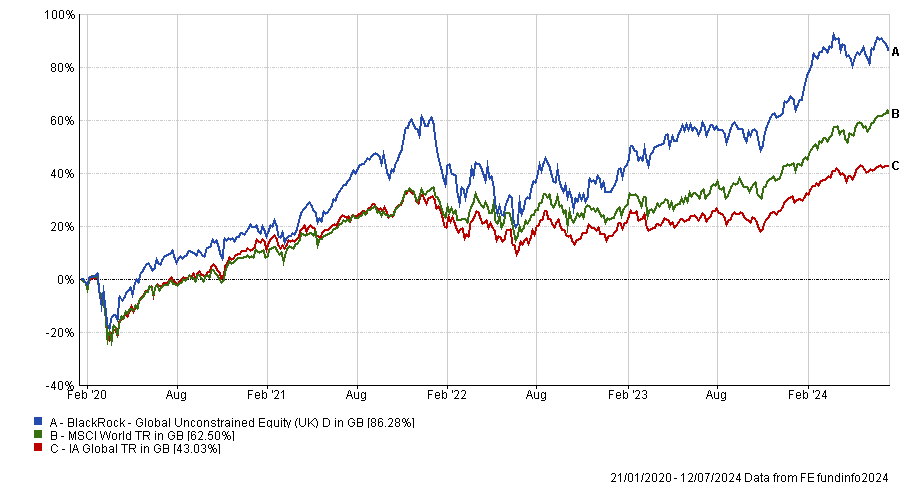
Source: FE Analytics
Morgan said: “A highly focussed global stock-picking fund with an excellent stock picker at the helm. It is growth orientated but has a very selective approach to identifying structural global ‘winners’.”
BlackRock Global Unconstrained Equity has been one of the best performing funds in the IA Global sector over three years, sitting in the first quartile and ranking 33rd out of 485.
JOHCM Global Opportunities
To diversify beyond the Magnificent Seven and broad market indices, Morgan added JOHCM Global Opportunities, attributing it a 10% weight.
He highlighted the tactical use of cash and the portfolio’s focus on “underappreciated quality”.
The fund, led by FE fundinfo Alpha Managers Ben Leyland and Robert Lancastle, has scant exposure to technology, with healthcare, consumer products and financial services being the most represented sectors through holdings such as UnitedHealth, Philip Morris International and Deutsche Boerse.
Performance of fund over the past 10yrs vs sector and benchmark
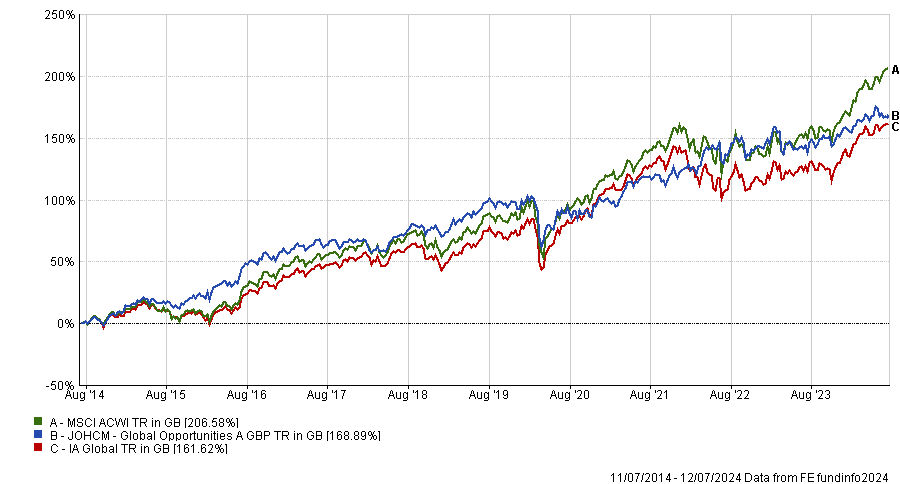
Source: FE Analytics
The fund has lagged the MSCI All Country World index over the past decade, but has made positive returns over every standard period.
M&G Global Dividend
Also accounting for 10% of the portfolio, M&G Global Dividend’s role is to harness growing dividends to provide an engine of performance when markets aren’t making progress in terms of capital growth.
“The focus on income provides good diversification from a tracker and growth strategies,” Morgan said.
The fund yields 2.5% and invests predominantly in the basic materials and consumer products sectors, with companies such as Methanex Corporation and Imperial Brands.
Performance of fund over the past 10yrs vs sector and benchmark

Source: FE Analytics
M&G Global Dividend sits in the second quartile of the IA Global Equity Income sector over 10 and five years.
Metropolis Value and Man GLG Undervalued Assets
For exposure to the value factor, Morgan included both Metropolis Value and Man GLG Undervalued Assets, with a 10% allocation for each of them.
The first fund, managed by FE fundinfo Alpha Managers Jonathan Mills and Simon Denison-Smith, blends both value and growth elements in its approach and has £434m under management.
“In a world of mega-funds and trillion-dollar asset managers, the value of a nimble strategy and efficiency of research and decision making should not be underestimated,” Morgan said.
Performance of funds over the past 10yrs vs sectors
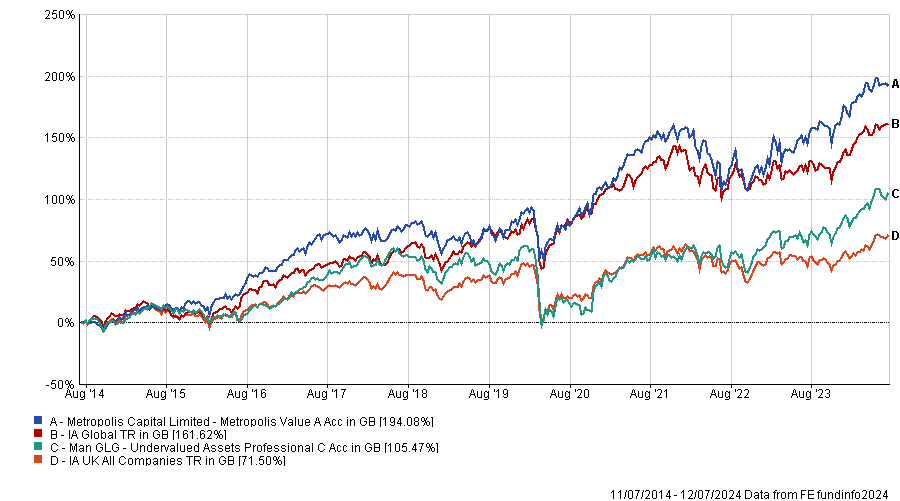
Source: FE Analytics
Man GLG Undervalued Assets focuses on UK equities and is a contrarian call, as investors have been turning their backs on the domestic market.
Morgan praised the fund’s “consistent process”, “disciplined approach” and “emphasis on balance sheets” as tools to take advantage of a potential future re-rating in the UK.
The £1.6bn fund has delivered top-quartile performance over one, three and five years and is run by Henry Dixon and Jack Barratt. They recently won the FE fundinfo Alpha Manager of the Year award for UK equities for the second year running.
Scottish Mortgage and AVI Global
Morgan also recommended making a 5% allocation to two investment trusts – Scottish Mortgage and AVI Global – which both boast distinctive strategies.
The former offers exposure to some of the world’s “most exciting” growth companies, including privately-owned ones, which can’t be easily accessed.
However, Morgan warned that this trust can by highly volatile and sensitive to investor sentiment, hence the small position size.
Performance of investment trusts over the past 10yrs vs sector and benchmarks
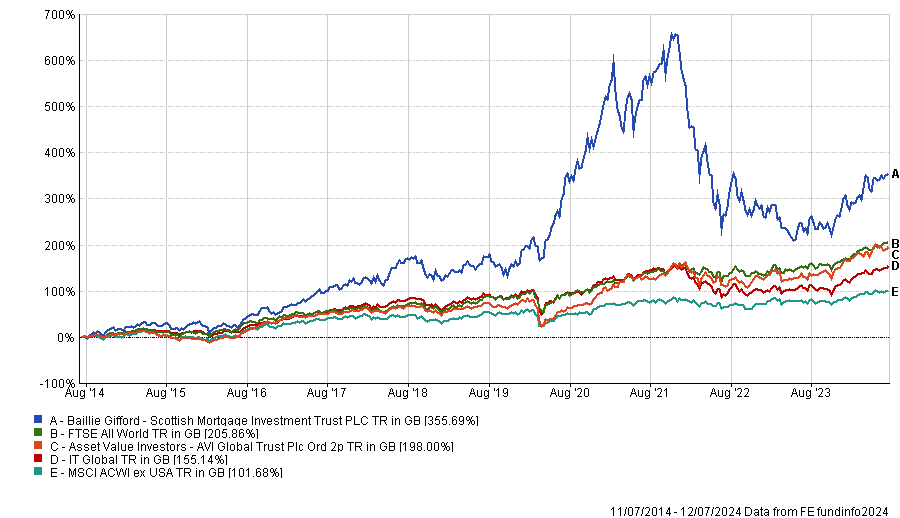
Source: FE Analytics
AVI Global takes a completely different route to generate returns, taking an activist approach in family-controlled holding companies, selected closed-ended vehicles and Japanese special situations.
Morgan said: “It is unlike anything else in the peer group or any index. This makes it an important diversifier with very different return drivers from other portfolio constituents.”
Stewart Investors Asia Pacific Sustainability
For exposure to the dynamic Asia Pacific region, Morgan selected Stewart Investors Asia Pacific Sustainability, attributing it a 5% weight.
He chose this fund for its large allocation to India and its exposure to parts of Southeast Asia where economic growth is rapid.
“Although companies [in those regions] are expensively rated, the fund’s emphasis on quality and good management should help it maximise the opportunities,” he noted.
The fund is managed by FE fundinfo Alpha Manager David Gait, who is underweight to China.
Performance of fund over the past 10yrs vs sector and benchmark
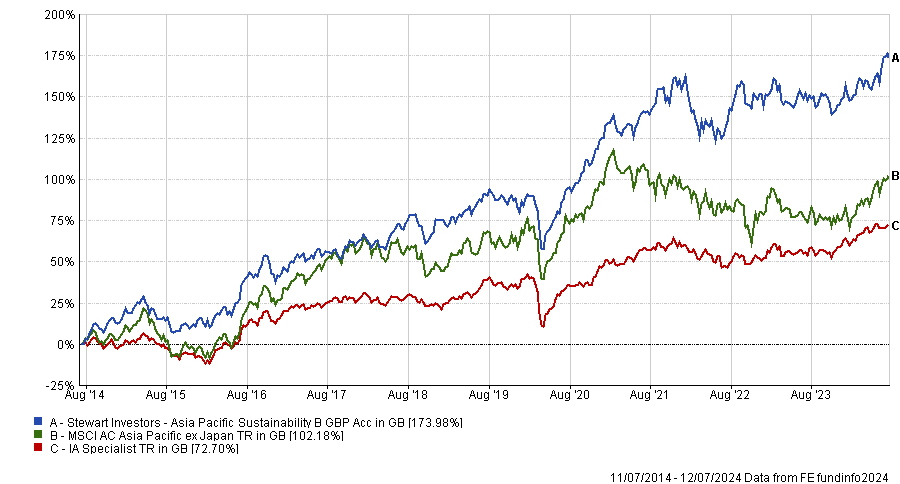
Source: FE Analytics
Personal Assets Trust
Morgan also included Personal Assets Trust, which blends blue-chip shares, government bonds and gold.
As this investment trust focuses on capital preservation, its role in the portfolio is to protect against downside risk while also delivering long-term growth.
Due to the nature of its strategy and purpose, Personal Assets is the least volatile strategy in the portfolio.
Performance of fund over the past 10yrs vs sector and benchmark
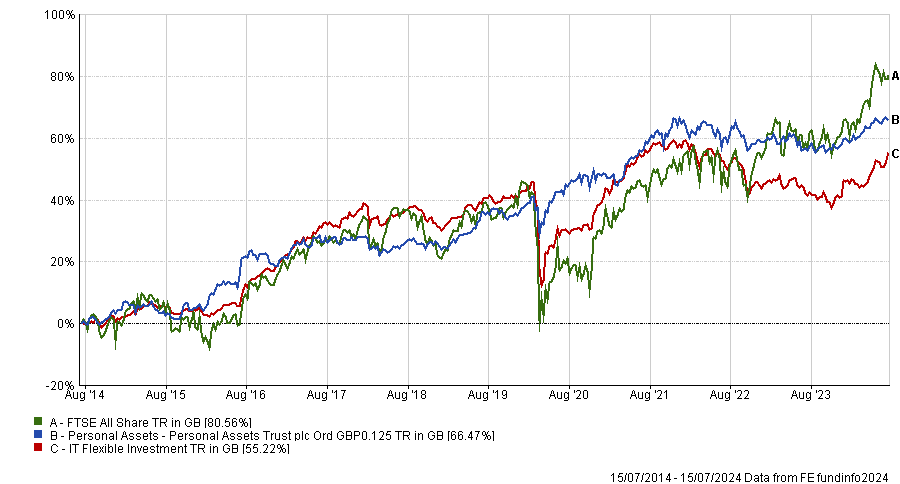
Source: FE Analytics
Vanguard Global Credit Bond
Finally, Morgan picked Vanguard Global Credit Bond to complete the portfolio with an allocation to fixed income.
This fund gives a broad exposure to global markets in a single, actively managed solution.
Morgan said: “It’s a one stop shop for bonds, simple and effective. Its focus is predominantly on developed market investment-grade securities, but with some scope to buy high yield bonds, investment-grade emerging market debt and other asset classes. The vast majority of the portfolio will be currency hedged to remove additional foreign exchange volatility.”
Performance of fund since launch vs sector and benchmark
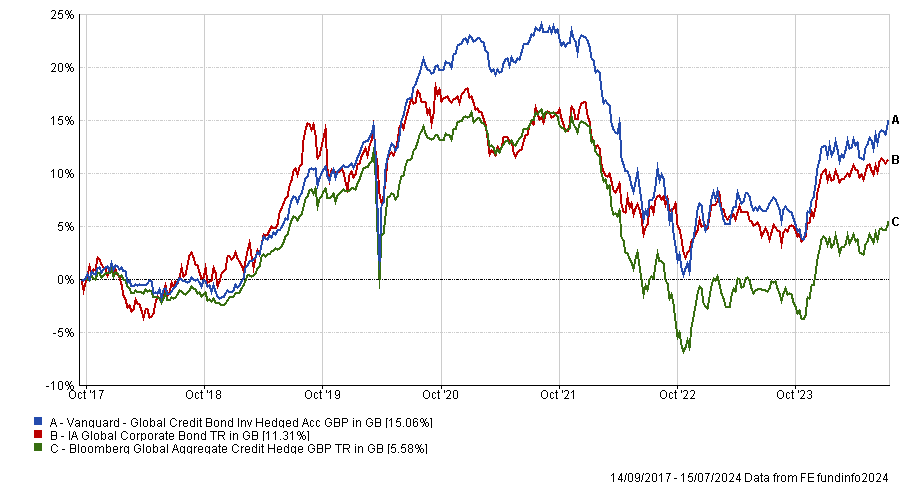
Source: FE Analytics
Vanguard Global Credit Bond was launched in 2017 and is the best performing fund in the IA Global Corporate Bond sector over five years.
Headline inflation came in at 2%, but services and core inflation remain above target.
Headline inflation in the UK flatlined in June, with consumer prices up 2% from the previous year.
This matches last month’s figures, when inflation hit the Bank of England’s target for the first time in three years. However, this stability may be disappointing, as expectations were for a softer print below the 2% target.
Laura Suter, director of personal finance at AJ Bell, said: “A fall to 1.9% had been predicted but didn’t materialise, putting the decision about a potential interest rate cut on 1 August finely in the balance.
“The odds are around 50:50 as to whether we will see the first rate cut from the Bank of England next month – a move that would be welcomed by the public and the new government alike.”
UK CPI inflation over 10yrs
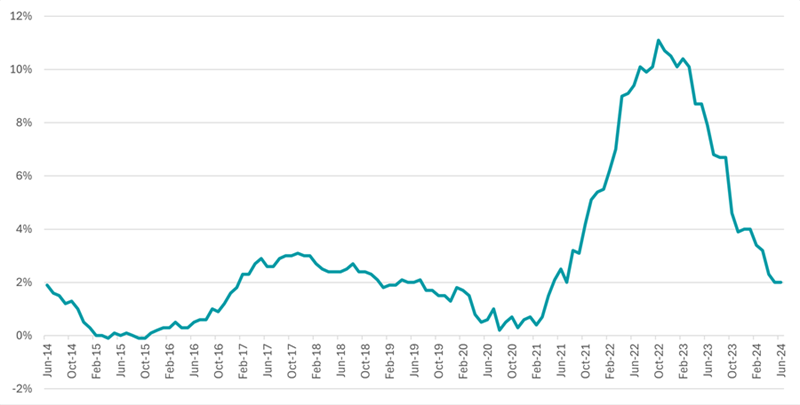
Source: Office for National Statistics
Moreover, services inflation overshot the Bank’s target, remaining steady at 5.7%, while core inflation (excluding food and energy) came in at 3.5%.
Derrick Dunne, chief executive of YOU Asset Management, commented: “The trouble with these measures is they are more embedded areas of price shifts in the economy which can reinvigorate the headline rate were they to stay higher for a longer period of time.”
A further indicator of whether the Bank of England may start its rate-cutting cycle will be tomorrow’s employment data, which is forecast to show a slight decline in wage growth from 6% to 5.7%.
While there are questions about whether the Bank will cut rates at all this year, Dunne believes it will have to balance inflation figures with the pressure on households with mortgages.
He said: “In all likelihood rates will come down, even if the labour market continues to show signs of strength tomorrow. It just might be a slower path than was expected at the beginning of the year.”
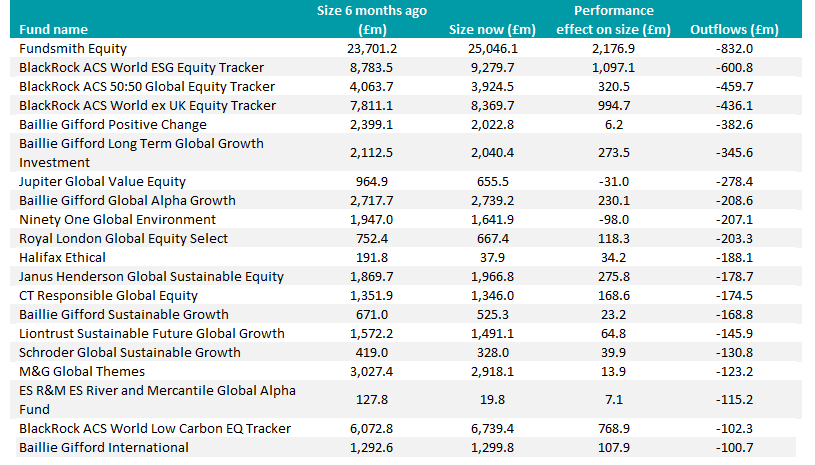
Investors abandon Fundsmith and flock to passive global equity funds.
Fundsmith Equity suffered the most outflows of any fund in the IA Global sector during the first half of this year, as investors pulled £832m from Terry Smith’s flagship strategy.
The fund has endured a spate of poor relative performance, falling behind the MSCI World index for the past three years, landing it in Bestinvest’s Spot the Dog list for the first time. Smith attributed his fallow run to the market’s concentration and his decision not to invest in Nvidia.
Performance of fund vs sector and MSCI World over 3yrs
Source: FE Analytics
Yet what the £25bn fund lost in flows, it more than made up in returns, which swelled its coffers by £2.2bn during the first half of this year.
Furthermore, Fundsmith Equity’s long-term performance has been spectacular. It returned 311% for the decade to 12 July 2024, almost double the IA Global sector average of 162%. Despite this year’s outflows, it remains popular with many retail investors and was the sixth most-bought fund on interactive investor’s platform in June.
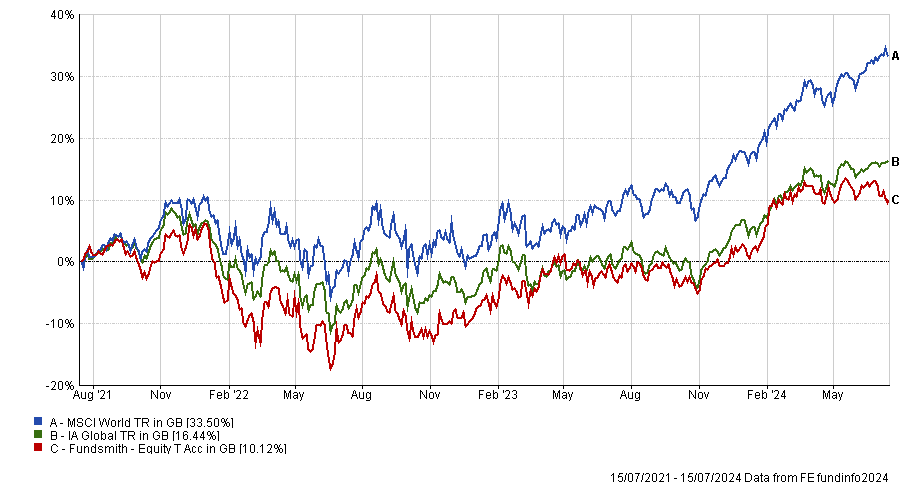
Elsewhere, investors abandoned sustainable investment strategies in their droves. BlackRock ACS World ESG Equity Tracker, Baillie Gifford Positive Change and Ninety One Global Environment all lost more than £200m in outflows.
Performance of funds vs sector and MSCI ACWI over 3yrs
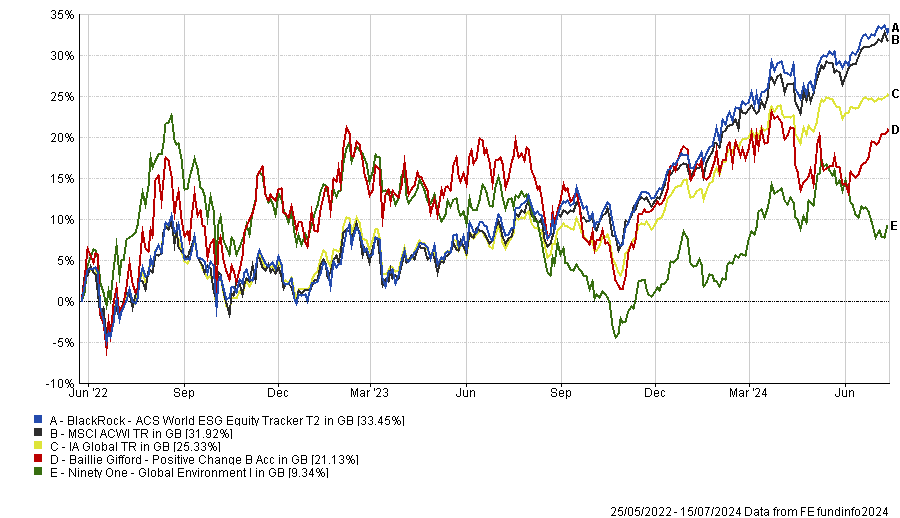
Source: FE Analytics
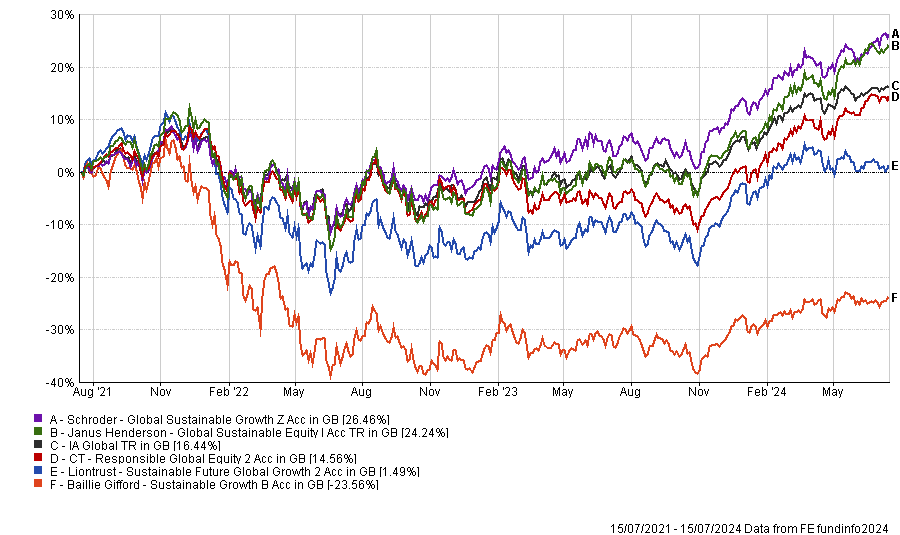
Meanwhile, Janus Henderson Global Sustainable Equity, CT Responsible Global Equity, Baillie Gifford Sustainable Growth, Liontrust Sustainable Future Global Growth and Schroder Global Sustainable Growth suffered outflows of £120m to £180m.
Performance of funds vs sector over 3yrs
Source: FE Analytics
Sustainable investment strategies have had a tough couple of years. Many of the growth-oriented companies in which they invest underperformed as interest rates were rapidly hiked in 2022.
Traditional energy, aerospace and defence stocks surged in reaction to Russia’s invasion of Ukraine and rising geopolitical tensions – areas where most sustainable strategies have scant exposure.
Then last year and this year, equity market performance was dominated by a handful of US tech giants. Some funds following environmental, social and governance (ESG) guidelines invest in a few of the ‘Magnificent Seven’, whereas others believe their relationships with stakeholders don’t pass muster.
Funds in the IA Global sector shedding more than £100m in 1H 2024
Source: FE Analytics
The aforementioned outflows were dwarfed by inflows as UK-based retail investors ploughed £7.6bn into global equity funds during the first half of this year, according to Calastone.
They showed a marked preference for cheap passive strategies. Of the five funds in the IA Global sector receiving the most inflows during the first half of this year, four were passively managed.
L&G International Index Trust led the way, raking in £913m of inflows, followed by Fidelity Index World, gaining £907m.
Three Vanguard funds each gained more than £500m of inflows, as the table below shows: Vanguard LifeStrategy 100% Equity, Vanguard FTSE Global All Cap Index and Vanguard FTSE Developed World ex-UK Equity Index.
This reflects a year in which global equity benchmarks (and strategies closely tracking them) have been exceptionally hard to beat. The most popular indices’ largest exposures – to US equities and mega-cap tech stocks – have delivered the greatest returns.
Funds in the IA Global sector attracting more than £100m in 1H 2024
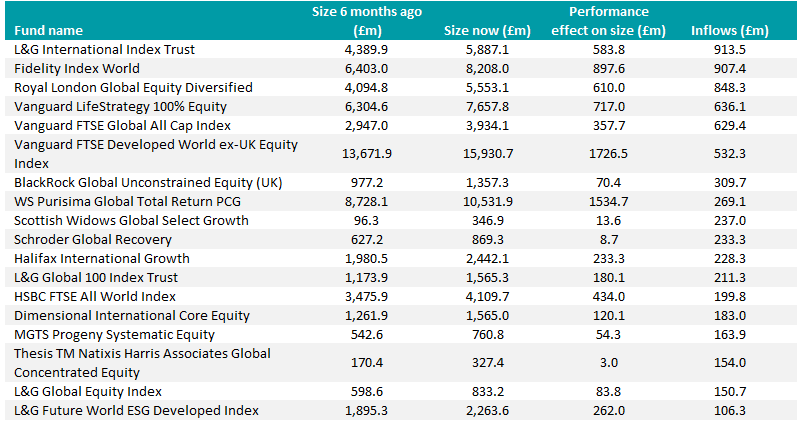
Source: FE Analytics
The only actively managed fund to rival the passive giants in popularity was Royal London Global Equity Diversified, which raked in £848m of inflows. The fund’s performance is top-quartile over one, three and five years.
However, the strategy’s long-standing fund managers, Peter Rutter, James Clarke and Will Kenney, have left to start their own investment boutique, backed by Australia’s Pinnacle Investment Management Group. Rutter was Royal London Asset Management’s (RLAM) head of equities.
RLAM’s chief investment officer Piers Hillier has taken over the Global Equity Diversified fund, with Matt Burgess deputising.
Despite the change to its managers, the fund’s size has actually grown from £4.9bn when Rutter and his team’s departure was announced at the end of April to £5.6bn today.
Other popular actively managed strategies include Schroder Global Recovery, Scottish Widows Global Select Growth, Purisima Global Total Return and Harris Associates Global Concentrated Equity.
The most and least popular global equity income funds
Investors backed the top performers in the IA Global Equity Income sector, with the two highest-returning funds in the sector over three years also the only ones to rake in more than £200m in inflows so far this year.
Aviva Investors Global Equity Income enjoyed inflows of £250m, almost doubling its size to £582m. It is managed by FE fundinfo Alpha Manager Richard Saldana and Matt Kirby.
Performance of funds vs sector and MSCI World over 3yrs
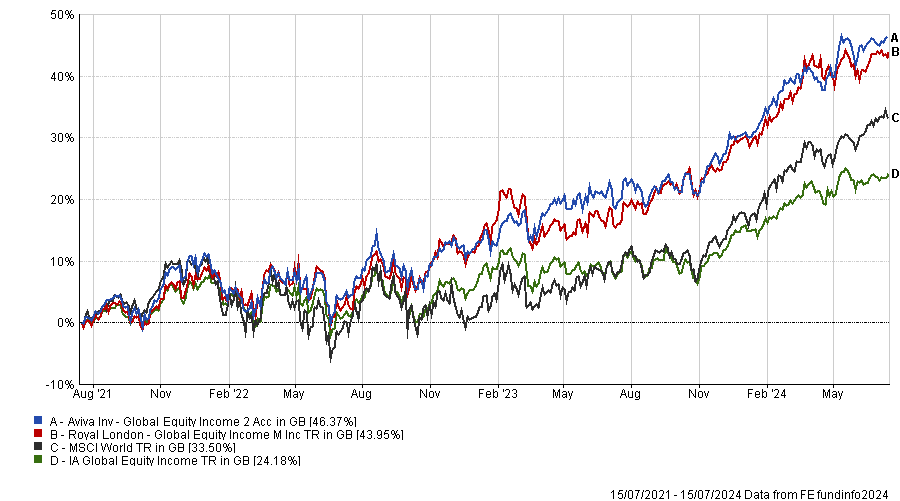
Source: FE Analytics
The £1.2bn Royal London Global Equity Income fund attracted £218m this year although its manager, Nico de Walden, has joined other former members of RLAM’s global equity team at Pinnacle.
Richard Marwood, head of RLAM’s equity income team, has taken over the fund together with Hillier and Burgess.
Funds in the IA Global Equity Income sector attracting or shedding more than £100m in 1H 2024
Source: FE Analytics
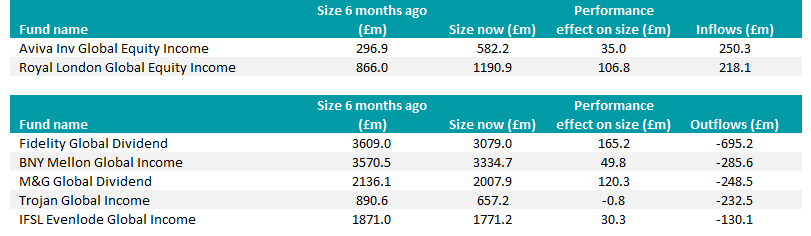
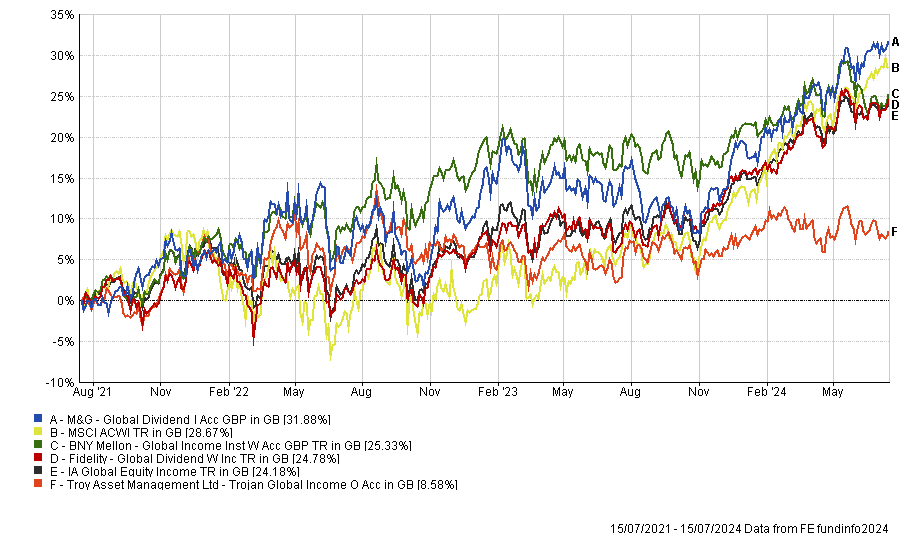
On the other side of the fence, four funds shed more than £250m: Fidelity Global Dividend (outflows of £695m), BNY Mellon Global Income (£286m), M&G Global Dividend (£248.5m) and Trojan Global Income (£232.5m).
Performance of funds vs sector and MSCI World over 3yrs
Source: FE Analytics
M&G Global Dividend was the only one of these funds to outperform the MSCI ACWI over three years, as the chart above shows, although three of the four strategies beat their sector average.
The Finsbury Growth & Income Trust’s consumer brands underwhelmed, whilst some of its tech stocks failed to meet lofty expectations.
Investors have grown accustomed to technology, data and software companies shooting the lights out. The inherent risk of this artificial intelligence (AI) euphoria, however, is that some tech stocks just can’t keep up with investors’ insatiable demand for exponential growth.
As a case in point, Sage gained 60.9% last year but has sputtered recently, losing 13% in the second quarter of 2024. The enterprise software company’s share price is down 8.8% year-to-date, as of 15 July.
Sage’s share price performance vs FTSE All Share over 2yrs
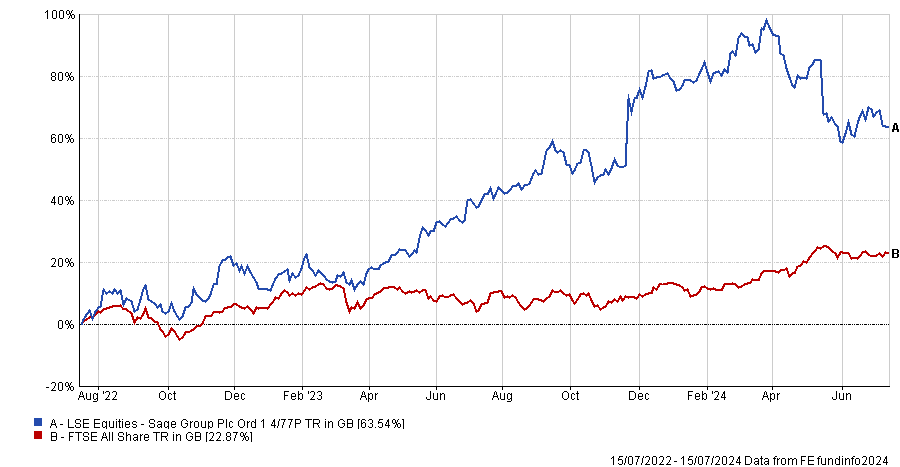
Source: FE Analytics
Nick Train, manager of the Finsbury Growth & Income Trust, has experienced both sides of the coin recently. His holdings in Experian and RELX each rose 8% in the second quarter of this year, hitting all-time highs. But at the same time, London Stock Exchange Group (LSEG) was flat while Sage slid.
“For all these technology-type investments to work, their revenues must grow ahead of investor expectations,” Train observed.
“Given its flat share price, LSEG has something to prove to investors,” he continued. “Imminent updates about the efficacy and popularity of its new suite of products and services, developed with its joint venture partner Microsoft, need to be encouraging.”
At its May interim results, Sage issued guidance that revenue growth would be about 9% for the rest of this year. Even though this forecast fell short of “more optimistic hopes”, it is a much faster growth rate than Sage delivered over the past five to 10 years, Train pointed out.
“If the revenue growth rate stays around 10%, as management is guiding, we’d expect the shares to make new highs soon enough. There is no doubt Sage has a big growth opportunity, especially in the US.”
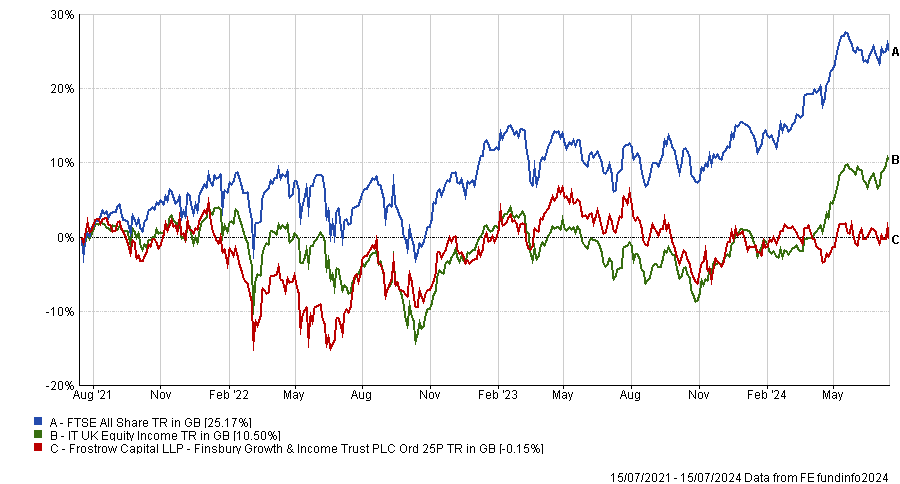
Trust’s total returns vs sector and benchmark over 3yrs
Source: FE Analytics
The Finsbury Growth & Income Trust’s second-quarter performance was dragged down by its consumer brand names, with Burberry and Diageo both undergoing double-digit share price declines. “The greater the exposure to luxury or premium brands, the worse the performance of the shares,” the manager said.
Lindsell Train is engaging the Burberry’s new chief executive, Joshua Schulman and his team about how to fulfil the brand’s potential.
Elsewhere, the trust has been a beneficiary of Hargreaves Lansdown’s more than 50% rise after a bid from a private equity consortium.
Train expects other companies within his portfolio, whose share prices do not reflect their strategic value, to attract bids. He thinks Carlsberg’s pursuit of Britvic (which FGIT does not own) bodes well for soft drinks companies AG Barr and Fever-Tree, which the trust holds.
They bring the total number of funds on the platform to over 100.
Investment platform TILLIT has added five new funds to its investment platform, following the removal of five funds from the universe last month.
Two emerging market funds have been added to the platform: the ARGA Emerging Market Equity and Redwheel Next Generation Emerging Market Equity fund. These funds currently hold assets of £481m and £601m respectively and are Financial Conduct Authority (FCA) certified but are not part of the wider Investment Association (IA) universe. Both have been among the top 10 best-performing funds over five years, compared with more than 200 competitors.
One global fund has been added, the Kopernik Global all-cap equity fund, which holds assets of £941m and is part of the wider IA universe.
Away from equities, in the short-term money market sector, TILLT has added the Royal London Short Term Money Market fund, managed by Craig Inches and Tony Cole. This is the largest of the new funds, with £7.1bn in assets under management (AUM).
Royal London’s fund has proven popular in recent years with rising interest rates making cash money market funds more popular. Indeed, it was one of the most-bought funds across customers with Fidelity Personal Wealth last year.
Finally, in the Sterling High Yield sector, the Man GLG High Yield Opportunities fund has been added, run by fund manager Michael Scott, which holds assets of £633m.
These new funds reflect TILLIT’s unique approach, in which it only recommends the most exceptional and best-performing funds. Indeed, all five funds ranked in the top quartile of their respective sectors over the past five years.
Sheridan Admans, head of fund selection at TILLIT, says these additions reflect the firm's ongoing commitment to identifying only the most “exceptional funds to enhance the TILLIT universe”.
These funds will continue to diversify client portfolios and access to broad investment options and improves clients' access to new opportunities such as deep-value investing.
“These latest additions offer our clients broader investment options, enabling them to stay in control of their portfolio, enhancing their ability to tailor their portfolios to their specific needs and market conditions”, Admans said.
The market is starting to look through the current impasse, recognising that the potential for attractive total returns from high-quality credit is back.
Looking at the healthy state of the US corporate credit market today – the jewel in the crown of the global credit universe – one could be forgiven for forgetting about the heavy price paid by all fixed income assets to get to this point.
The recent inflationary spike and the Federal Reserve’s subsequent aggressive pace of policy tightening saw the ICE BofA US Corporate index suffer consecutive negative return years in 2021 and 2022 for the first time since records began in 1973.
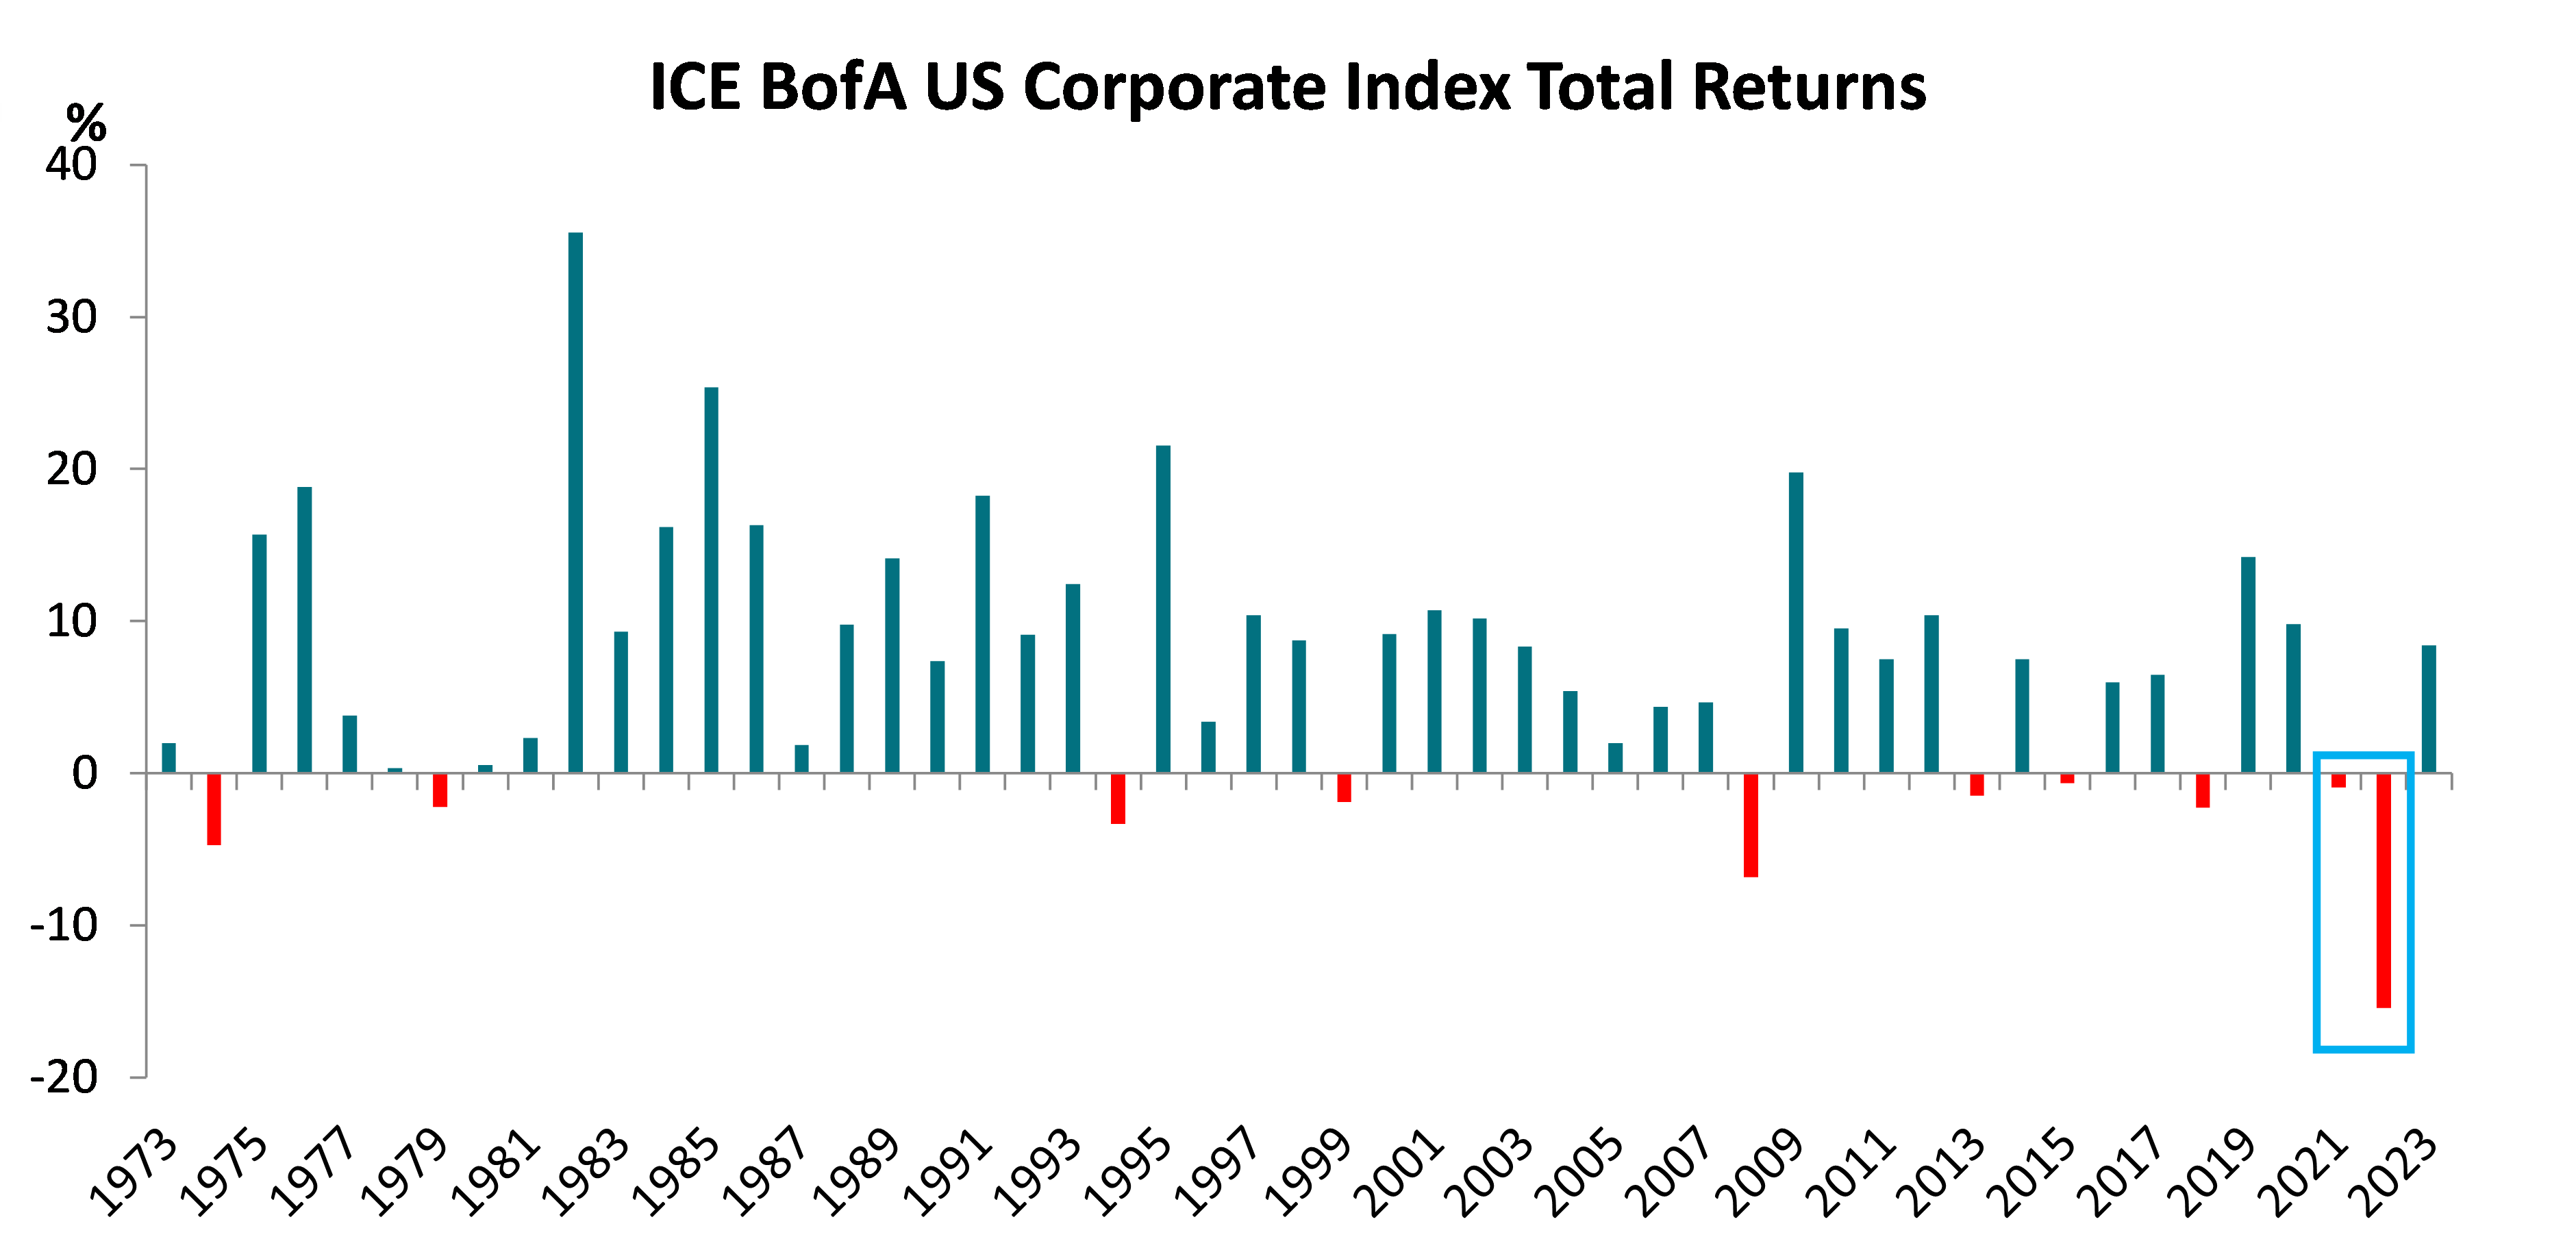
Source: ICE BofA as at 31 Dec 2023
However, not only are negative years relatively rare in credit, but the market tends to bounce back following a downturn.
In a little more than two years, the market’s average par-weighted coupon has risen by 58 basis points (bp), and it should continue to rise significantly as more companies come to refinance old debt. According to JP Morgan, the average coupon of new investment grade issuers in the fourth quarter of 2023 was 6.2%, well above the 10-year average of 3.6%.
Yields move to 15-year high
The flip side of the negative returns in 2021 and 2022 is that investors can now access the US investment grade credit market at attractive all-in yields of 5.8%, levels not seen since 2009. Most of the increase, however, has been due to volatility in the risk-free rate, and for investors, usually attracted to credit for the spread that it offers above government bonds, current valuations have presented a conundrum.
Underpinning this quandary are the laws of economics, which dictate that rate hiking cycles of the magnitude recently witnessed should lead to a slowdown in activity, an easing in the labour market and potentially even a full-blown recession.
But there has been nothing typical about the resilience and continued exuberance of corporate America in response to the current squeeze in conditions, reflected by credit spreads which have continued to grind tighter.
Adjusting to a new norm
Although there have been some pockets of weakness within the US regional banking sector and commercial real estate, US investment-grade company earnings have broadly held up well.
Margins within most sectors have also stabilised and even improved for higher-quality issuers. Sticky inflation led to increased costs without revenues keeping pace but as inflation moderates, pricing action and efficiency measures undertaken by investment grade companies in the past two years should drive margin improvement.
In the primary market, many companies took advantage of very low rates in 2020 and 2021 to refinance debt and lock in low interest expense costs on long maturity bonds. As a result, comparing the end of 2018 with 2021, the market’s average maturity increased from 10.4 years to 11.8 years – its highest point since 1999.
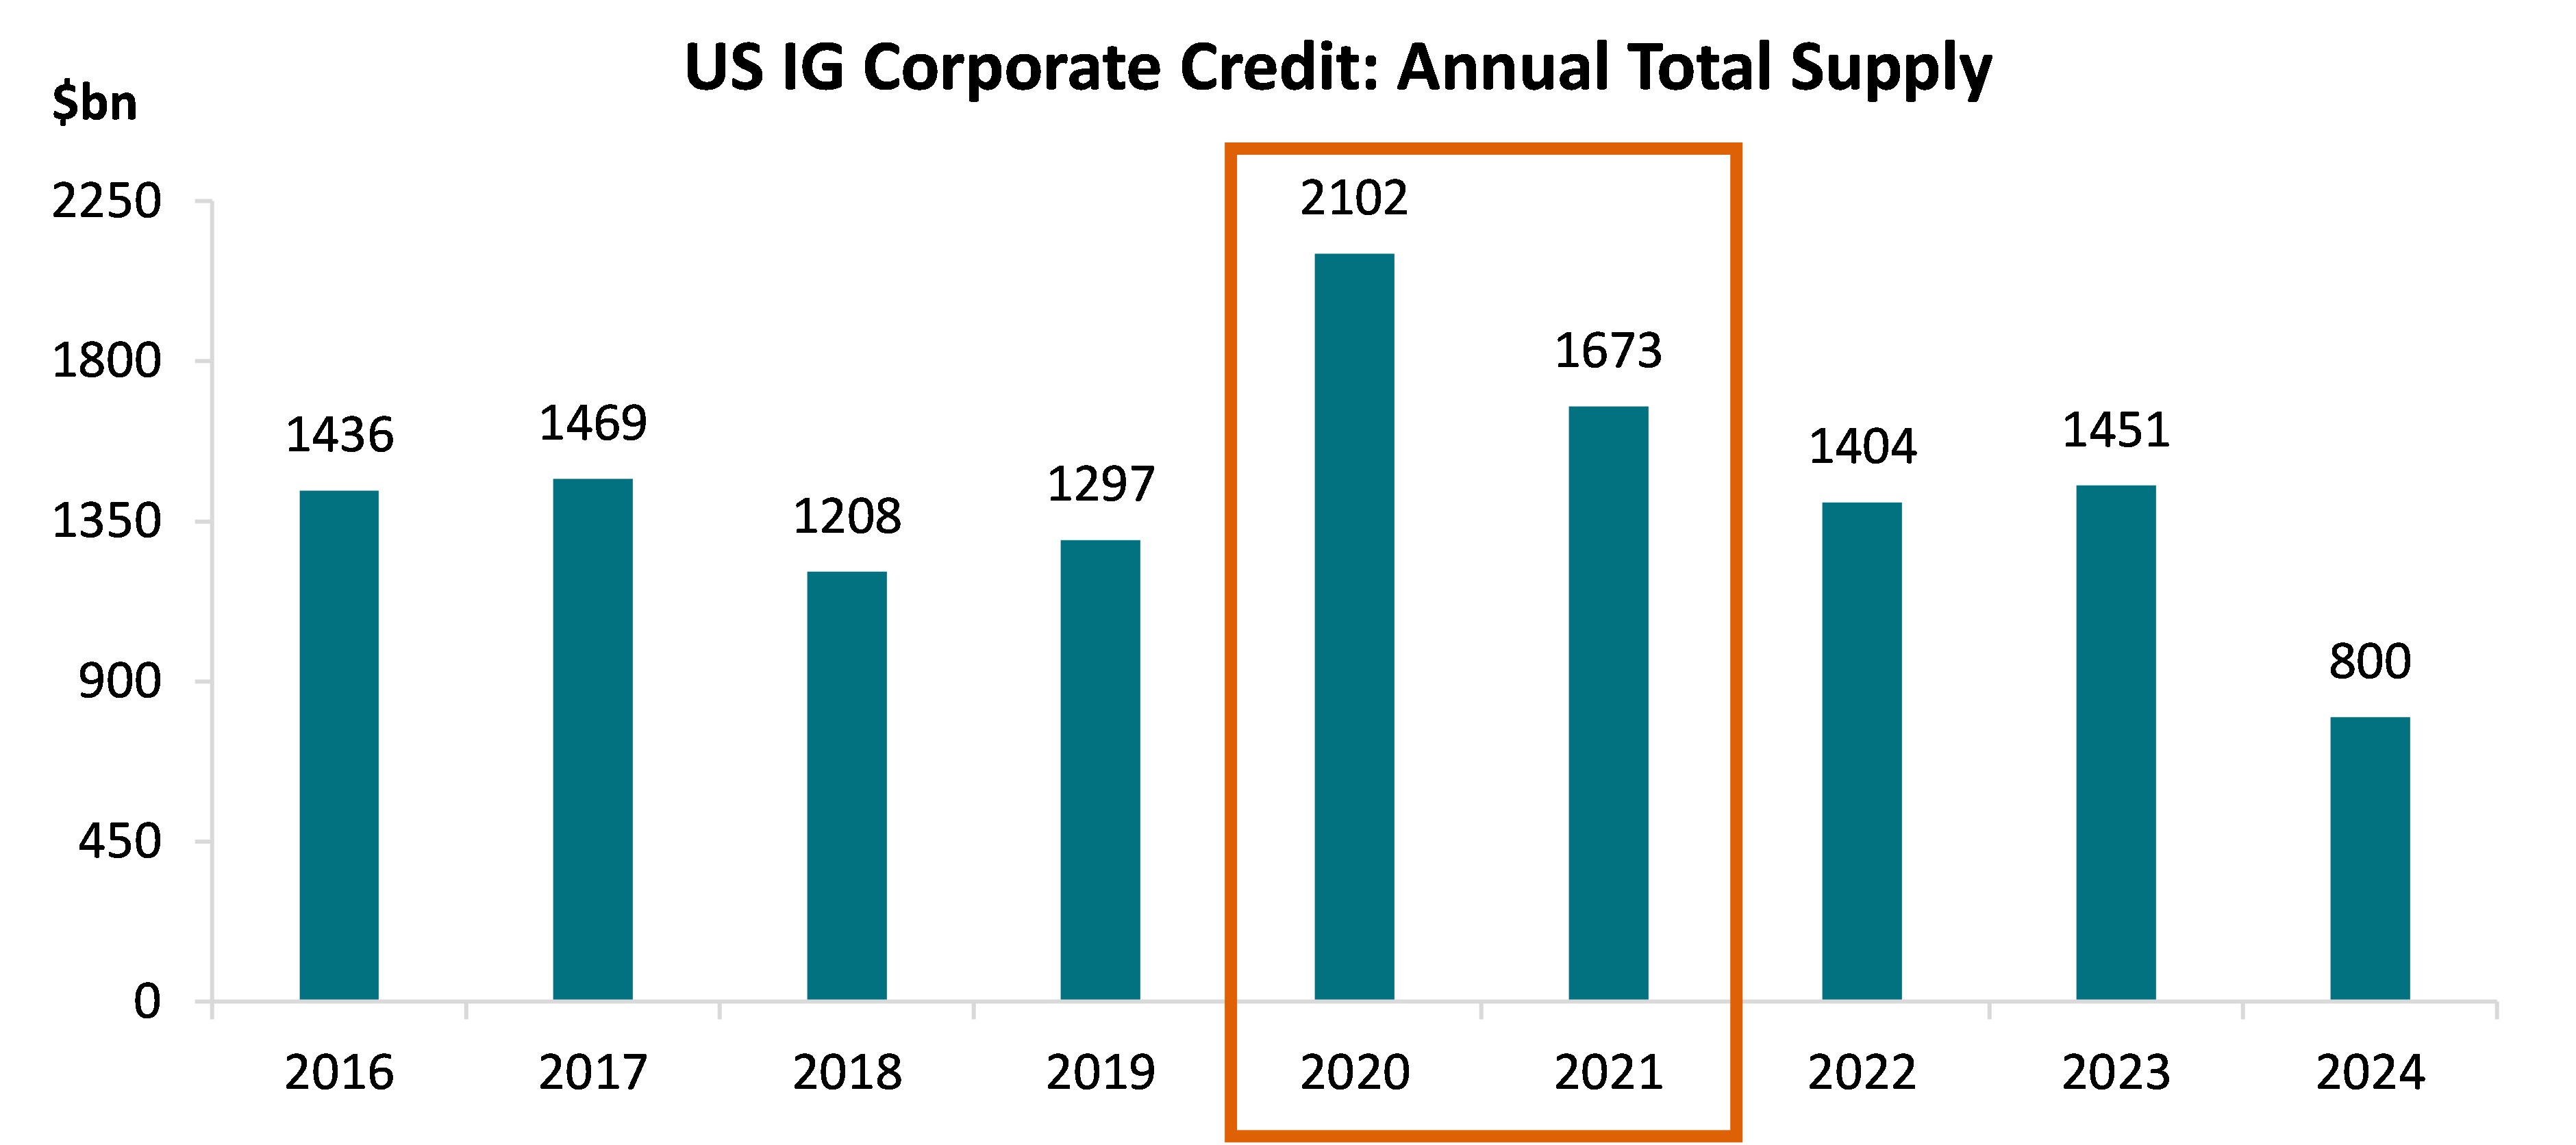
Source: Barclays Live Report, 30 Apr 2024
For an asset class like US credit, which has a longer duration than its European counterpart and less callability than high yield (meaning more bonds are retired at their original maturity date), the proactivity of companies in adjusting their capital structures while rates were low has afforded them time to adjust to this period of higher rates. US companies’ large balance sheet cash reserves have helped them manage their debt profiles comfortably.
Now that quantitative easing is no longer keeping a virtual ceiling on how high yields can go, management teams have the real incentive to keep leverage low so that the overall interest burden today is not so much higher than when rates were low.
Technical tailwinds
After such a strong run, primary market forecasts are, on average, down for 2024 as companies grapple with higher borrowing costs. That said, there continues to be robust demand for high-quality credit, meaning that the market is not struggling to absorb current volumes. This in turn is providing technical support, particularly from the strong ratings momentum across the full credit continuum.
Last year saw a record upgrade volume in the US investment grade market of $791bn (11% of market size). This included $101bn of rising stars from the high yield universe, of which Ford, the largest rising star ever, accounted for 40%. Downgrades totalled $225bn (3%), of which just $25bn fell to high yield. This equated to an upgrade/downgrade ratio of 3.5x, well above the past 15-year average of 1.1x.
Dawn after dark
While the fundamental and technical picture looks healthy, the biggest tailwind of all would come from the macro story and Fed cuts, which remain very much on the table for 2024. Fed cuts would initiate a decline in short-term deposit rates and create better entry points for spread buyers. A potential steepening in the yield curve after persistent inversion would also present more attractive opportunities further along the curve.
Risks remain. But the market is starting to look through the current impasse, recognising that although the price has been high, the potential for attractive total returns from high-quality credit is now back.
Jack Stephenson is a US fixed income investment specialist at AXA Investment Managers. The views expressed above should not be taken as investment advice.
The two markets have had contrasting fortunes but arguments can be made for why investors should pick either one of the two emerging market giants.
Investors in emerging markets have watched over the past few years as the region’s two largest markets have had wildly contrasting fortunes.
On the one hand, India has flown higher on the back of stability and sold economic fundamentals, while China has languished with concerns over government intervention and economic sluggishness.
This has been borne out in the two stock markets, with the MSCI India up 59.7% over three years while the MSCI China index has dropped 34.4%.
Below experts make the case for why investors should back the surging India market or turn their attention to out-of-favour Chinese stocks.
Performance of indices over 3yrs
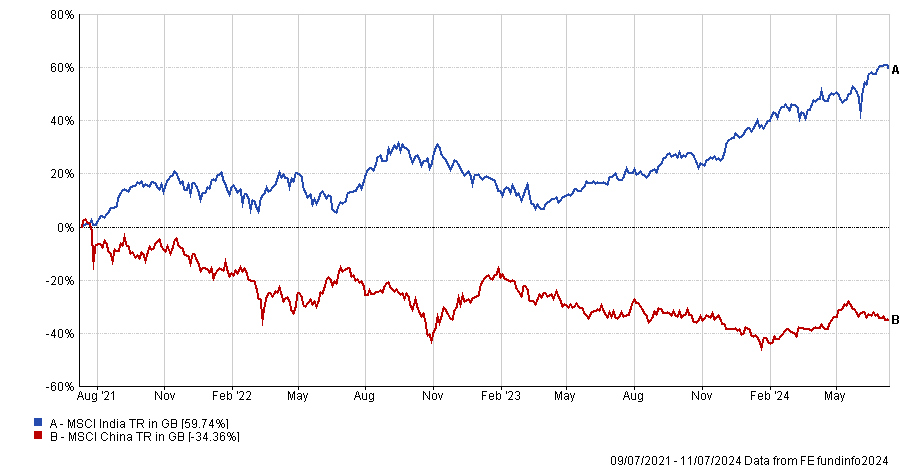
Source: FE Analytics
The case for India
Sean Taylor, chief investment officer and portfolio manager at Matthews Asia, said while both Indian and Chinese equities can play a key role in portfolios, he prefers India.
“First, India's political stability and growth prospects are more favourable than China's. India's equity market recovered from a sharp decline when prime minister Modi's party secured a coalition government, which is expected to continue the progress on infrastructure, urbanisation and consumption,” he said.
The result may entice foreign investors to increase exposure to Indian equities as the election result shows that democracy is working, and checks and balances are in place. It is also expected that economic growth will accelerate under Modi’s third term, said Taylor.
“Second, China's macro indicators and catalysts are mixed and uncertain. China's equity market performed well in the last quarter, but its retail, consumer and property sectors are still weak. The government's policy changes and reforms may provide some support, but their scope and timing are unclear.”
Lastly, China's exposure to geopolitical risks is higher than India's with the former market potentially coming under pressure from the upcoming US presidential election.
“In contrast, India is less affected by the US election and more driven by domestic factors,” said Taylor. “India also has lower inflation than its peak and healthy corporate balance sheets which may allow for more monetary easing to help growth once the US starts its rate cycle.”
Conversely, China’s monetary policy remains tight relative to economic activity, he added.
Turning to the market directly, he noted earnings growth in India continues to outpace that of other emerging markets. “According to Bloomberg data, India's corporate earnings are projected to grow more than 15% annually for the next two years, with upward revisions reinforcing this optimistic outlook,” he said.
“In contrast, China's corporate earnings are expected to grow by around 10% during the same period, but these projections are accompanied by downward revisions.”
Although India is trading at a premium, with a price-to-earnings (P/E) ratio of 23x its projected 2024 earnings compared to China's 9x, this “is likely to persist” if India's earnings growth continues to surprise to the upside.
“In contrast, China's investment outlook could improve if the government adopts a pro-growth agenda that boosts corporate earnings, especially given the current low earnings levels and lack of domestic investor confidence,” he said.
The case for China
Linda Lin, portfolio manager at Baillie Gifford, agreed with Taylor that investors need to strike a balance between the two countries, but was more positive on China.
She pointed to the recent rally of the Hong Kong market, where capital has flown from the emerging market managers rebalancing based on the high valuations of companies in India. She also said the quality of growth companies between the two countries was stark.
“If we look at the quality and potential for growth from both India and China, I think 41% of growth companies are still coming from China,” she said.
“Why does that matter? Because you are paying less than 10x earnings for the best growth companies in the emerging markets.”
She accepted there had been less intervention from the government to help stimulate the economy, but noted it is probably waiting until after the US election, when there will be a better understanding of the future trade landscape with America.
“Experts in China have been asking why China does not have an aggressive policy to boost the economy but the answer is it needs to see what the result will be in November [of the US election] and what the new policy will be against China,” said Lin.
Regardless, she noted there is outside money coming into the country, just not from the developed world. Although there has been a lack of Western capital coming into China over the past few years there are people buying from the Middle East, South America and other parts of Asia.
As a result, she does not believe the US election outcome will have as large an impact as it might have once had economically, with China “trading much more with ASEAN countries than the US now”.
Another positive is the Middle East, which is getting behind China’s green energy transition – an understandable alliance as the oil-rich region is likely to impacted mightily by China’s progress away from fossil fuels.
“They are very cognisant to work with China. This is not because of politics, it is because China’s long-term energy transition matters the most to that region. They have to come in. That is why we are seeing the supply of capital changing in the coming years,” she said.
Experts reveal which real estate investment trusts are poised to rebound.
Real estate investment trusts (REITs) have suffered through a daunting couple of years as inflation and interest rates have risen, but those headwinds are dissipating. With many trusts trading at wide discounts, experts believe this is a good time to revisit the sector.
Typically, higher inflation and rising interest rates make real estate a less attractive proposition because borrowing costs and mortgage rates increase, purchasing power falls and other asset classes such as bonds and cash become more appealing.However, with UK inflation falling to 2.0%, rate cuts seem to be on the horizon, potentially supporting a rebound in real estate.
Richard Williams, property analyst at Quoteddata, said: “Even if that first cut is only a quarter point, it will send a message to lenders and borrowers that the trajectory is down and the forward yield curve should follow suit.
“Confidence that the bottom of the real estate market has been hit would facilitate more investment activity and a return to positive valuation growth.”
Performance of sectors over 2yrs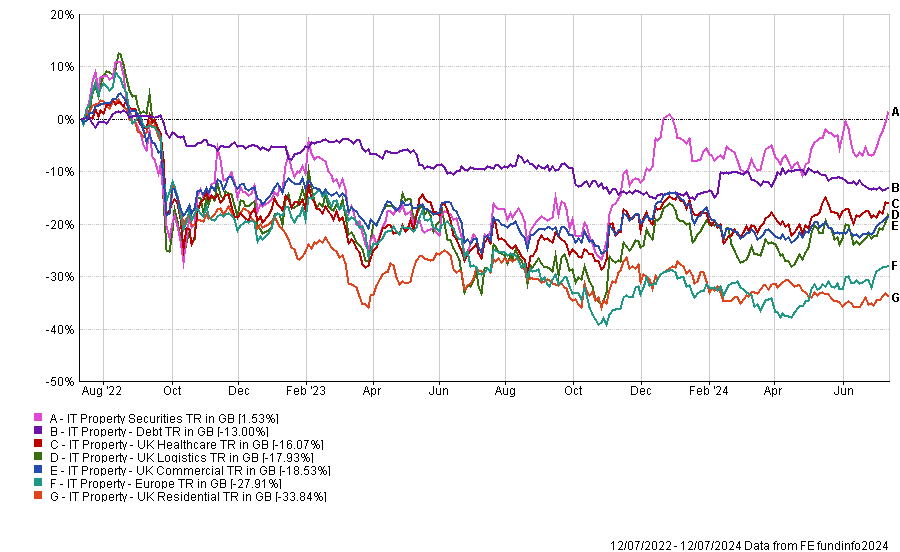
Source: FE Analytics
Another compelling point for REITs is the discounts at which they are currently trading, following their recent rout. Private equity firms have seized this opportunity to make acquisitions. For example, Blackstone bought Industrials REIT last year, while Brookfield is in the early stages of making an offer for Tritax EuroBox.
Mick Gilligan, head of managed portfolio services and partner at Killik & Co, said: “The high level of property M&A in the past 12 months indicates there is good value in the sector. Property players have taken advantage of low valuations, picking up assets at significant discounts.”
Below, experts suggest which investment trusts to back to benefit from a real estate revival.
Schroder Real Estate Investment Trust
Anthony Leatham, investment companies research analyst at Peel Hunt, suggested Schroder Real Estate Investment Trust for generalist exposure to the real estate sector.
Led by Nick Montgomery, this REIT is currently trading at a 22% discount and offers a 7.1% yield.
The portfolio, valued at £459 million, consists of 39 properties, with significant investments in the industrial and office sectors.
Performance of investment trust over 10yrs vs sector 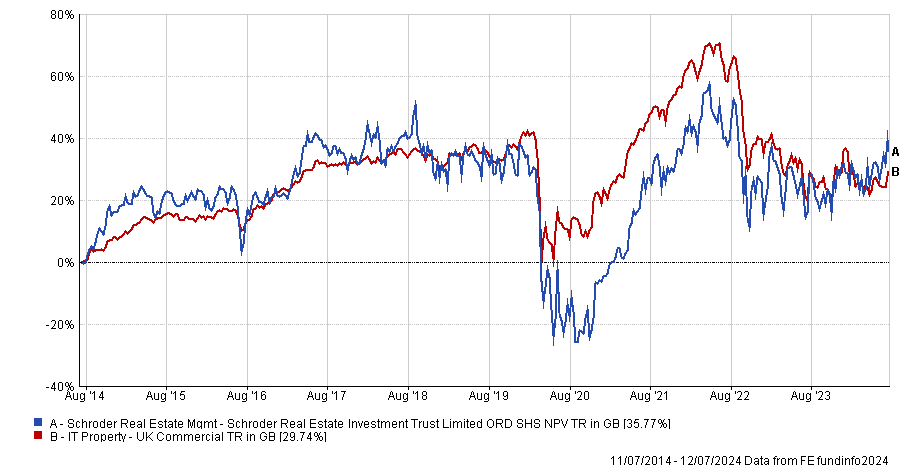
Source: FE Analytics
Leatham said: “Schroder Real Estate Investment Trust is pioneering a brown-to-green investment strategy across UK commercial property, which aims to meet the increasing occupier demand for more sustainable buildings and capturing the rental and valuation ‘green’ premium from efficient buildings with strong environmental credentials.”
Picton Property Income
Picton Property Income is trading at a 30% discount and its management team has a track record of adding value, according to Williams.
Its £745m portfolio is almost 60% weighted to the industrial sector, which displays promising rental growth prospects, he said. The trust has been reducing its office exposure, which stood at 30% at the end of March, but has fallen further after recent sales.
“This has not been achieved through cut-price sales into a falling market, instead the company has maximised values by unlocking their alternative uses potential – in the main, gaining planning consent for change of use to student accommodation and residential,” Williams said.
As debt levels are at a loan-to-value of 28%, long-dated and with a fixed cost of 3.7%, the trust has increased its dividend target for this year by almost 6% to 3.7p.
Performance of investment trust over 10yrs vs sector 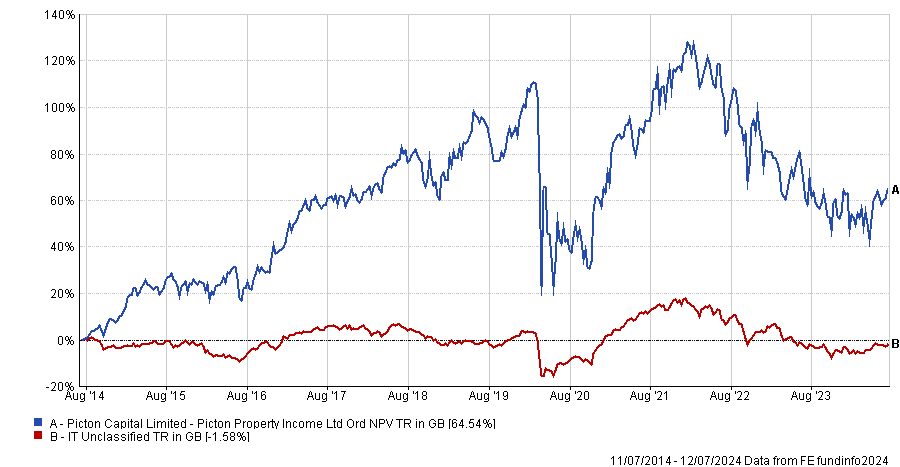
Source: FE Analytics
Impact Healthcare REIT
Emma Bird, head of investment trusts research at Winterflood, tipped Impact Healthcare REIT.
Specialising in UK care homes, this investment trust is currently trading at a 27% discount. Bird believes it offers "considerable value”, with a prospective 8.2% dividend yield fully covered by earnings.
She said: “This fund has seen its underlying asset valuations hold up considerably better than many other property investment trusts, supported by the contractual, inflation-linked uplifts in its rents, which we expect to continue to support earnings and dividend growth going forward.”
Performance of investment trust since launch vs sector 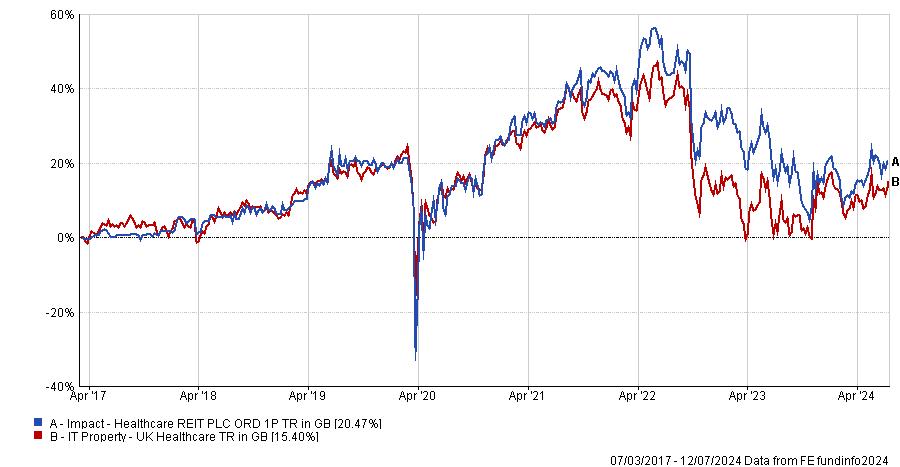
Source: FE Analytics
The trust has increased its dividend each year since its launch in 2017, a policy that Bird believes will differentiate Impact Healthcare REIT in a higher interest rate environment.
TR Property
Both Leatham and Gilligan pointed to TR Property, managed by Marcus Phayre-Mudge.
Leatham described this investment trust as a "one-stop shop" for property equity exposure, as it holds REITs, shares and securities of property companies and related businesses across Europe. Additionally, it invests directly in UK properties.
Leatham said: “This pan-European strategy has invested through several property cycles and we highlight the active approach to sector and stock selection. With discounts across pan-European real estate equities still widespread and TR Property trading on c.6% discount to NAV, it has the potential to outperform on the way up.”
TR Property has been the beneficiary of several M&A transactions. The largest contributor to NAV performance in fiscal year 2024 was the acquisition of Industrials REIT by Blackstone.
Performance of investment trust over 10yrs vs sector and benchmark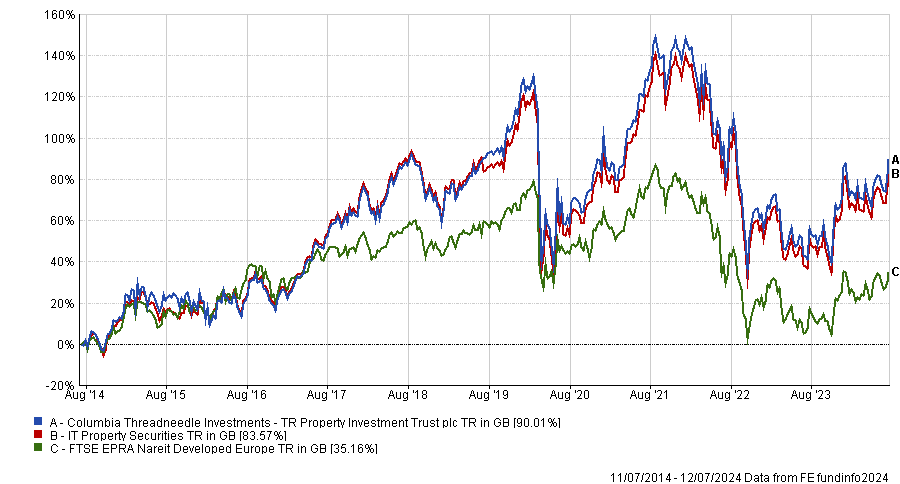
Source: FE Analytics
Gilligan believes that TR Property will continue to benefit from M&A, as several of its smaller holdings are potential acquisition targets.
He prefers internally managed REITs such as TR Property over "classic" investment companies with external management structures. He believes that the alignment of interests between managers and shareholders is better in the former, often incentivised through various metrics, including total shareholder return.
He said: “Property investment trust managers tend to be rewarded on NAV alone. Fee structures also tend to penalise the shareholder during downturns as they continue to pay fees on the old stale NAV, which is usually outdated and higher than the share price, while the share price tends to look forward and discount market conditions. For these structural reasons, I don’t think the investment trust property sector (i.e. those holding physical property assets) has a particularly bright future.”
As a result, Gilligan expects consolidation to continue and warned that the days for small sub-scale trusts with high fee burdens are numbered.
A combined approach will provide the best support for children’s future, wealth manager Brewin Dolphin suggests.
New parents have plenty to worry about when it comes to their children, but one they should not forget is to financially contribute to their children’s future.
There are two main ways that parents can do this. The first is through a junior ISA (JISA), while another consideration could be a junior self-invested personal pension (junior SIPP).
For parents to decide which option is best, it is important to understand how each operates, as well as their wider benefits and drawbacks.
JISAs allow parents to contribute up to £9,000 per tax year either in cash or stocks and shares accounts. Children are able to take control of the assets from 16 and can start making withdrawals from 18. These withdrawals are tax-free, but Daniel Hough, financial planner at RBC Brewin Dolphin, noted the early age of access can lead to kids spending the money on things parents disapprove of.
“In a previous role, I received lots of calls from parents about what their children were using their money for once they were able to access their JISAs and junior savings accounts,” he said.
Yet this option may be better for grandparents. Hough noted: “It can be incredibly rewarding to see grandchildren enjoy the fruits of your hard work over the years.”
By contrast, Junior SIPPs limit maximum annual contributions to £2,880 which is then topped up by the government by another £720. Children can currently access the money at the age of 55, making them a longer-term method of financially contributing to their children’s future.
They work the same way as traditional pensions, with people able to take out a tax-free lump sum of 25%, with the remainder liable for income tax.
While this means SIPPs have a greater impact on children’s potential retirement, parents are less likely to see their children enjoy the results of their savings as a result.
As such, the better choice “comes down to how accessible you want the money to be”, Hough said, suggesting the answer may lie in a combination of both the JISA and junior SIPP.
By using up their annual SIPP allowance, and then contributing the rest of their children’s savings into a JISA, parents will allow their children to access some money for their personal use at age 18 and still have a pot of savings left for their retirement.
Trustnet looks at the UK funds attracting and shedding the most money in the first half of the year.
A baker's dozen of funds took the brunt of the investors’ chagrin toward the UK market, according to data from FE Analytics.
Since the beginning of the year, investors have withdrawn £3.8bn from UK equity funds but some have been hit more than others. Indeed, investors took more than £100m away from 13 portfolios across the IA UK All Companies, UK Equity Income and UK Smaller Companies sectors.
Royal London UK Core Equity Tilt was the most sold in the first half of the year, with investors moving £1.2bn away from the now £5.5bn fund, despite it adding some £500m in performance over the period.
A spokesperson for Royal London noted that the move was as a result of "asset class adjustments", with the money moved out of UK Core Equity Tilt being recycled into different funds.
The next two slots belonged to funds where managers have left. The first is JOHCM UK Dynamic, which had been run by Alex Savvides. The manager is on his way over to Jupiter in the autumn of this year, taking the place of Ben Whitmore as head of Jupiter UK Special Situations.
Both funds experienced outflows however, with investors pulling more than £800m from the pair, although the JOHCM fund (£843m) was hit slightly worse than the Jupiter fund (£812m).
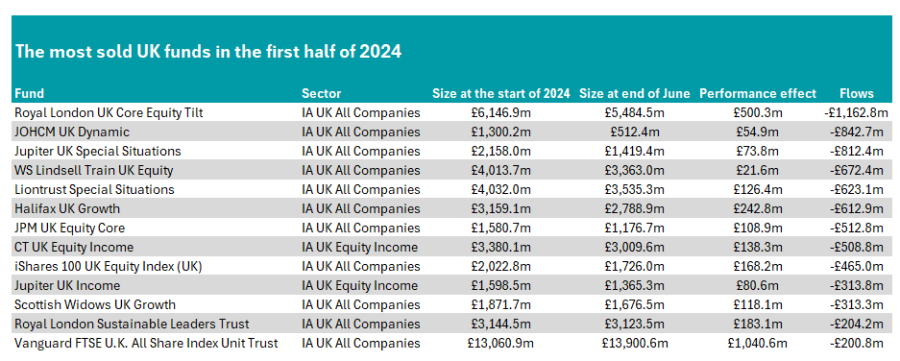
Source: FE Analytics
Next were a pair of industry stalwarts: WS Lindsell Train UK Equity and Liontrust Special Situations. The former is managed by FE fundinfo Alpha Manager Nick Train, who has done a phenomenal job over the long term for investors but has been found wanting in recent years.
The fund has been a top-quartile performer over 10 years but has slumped to the fourth quartile over both one and five years as his quality-growth style of investing has fallen out of favour. Investors took £672m away from the fund in the first half.
Liontrust Special Situations has been much better. Like Train’s fund, it has produced top-quartile returns over 10 years, but over five years it has slipped into the third quartile, although it remains ahead of the overall sector average.
Run by Alpha Managers Anthony Cross and Julian Fosh, as well as Matthew Tonge and Victoria Stevens, the fund also looks for quality stocks, using their ‘Economic Advantage’ process.
Although performance has been strong, the fund is one of the largest in the sector and may have been a victim of the indiscriminate selling of UK assets by investors in the first half of the year. Outflows totalled £623m, with Halifax UK Growth the only other UK fund above £600m.
UK equity income funds held up well, however, with only one name on the list - CT UK Equity Income. Following the retirement of veteran stock picker Richard Colwell in 2022, manager Jeremy Smith has done a good job, with the fund in the second quartile of the sector.
However, over one year it has dropped to the third quartile and investors may still be making their way out of the fund, having given him time to see if the top-quartile performance under Colwell could continue.
No funds from the IA UK Smaller Companies sector made the list, with the most-sold portfolio in the first half of the year – abrdn UK Smaller Companies – suffering net outflows of £144m.
Turning to the more positive end, three funds took in more than £200m in the first half of 2024, with iShares UK Equity Index (UK) raking in £347m.
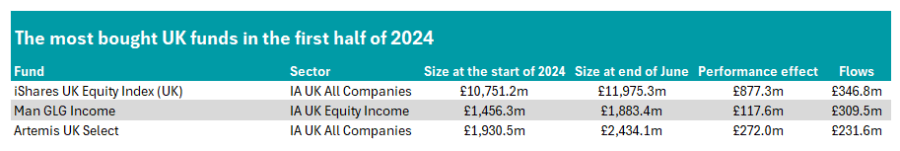
Source: FE Analytics
Artemis UK Select was the other IA UK All Companies constituent on the list. Managed by Ambrose Faulks and Alpha Manager Ed Legget, the fund has been the best performer in the sector over five years and was third of the 184-strong peer group over the past decade.
Splitting the two was the only member of the IA UK Equity Income sector: Man GLG Income. Alpha Manager Henry Dixon has a deep value philosophy, which has helped the fund to outshine its rivals, topping the peer group over the past decade and making top-quartile gains over one, three and five years as well.
This is no mean feat, as for much of the past decade growth has been in favour, while his deep value strategy has struggled, according to analysts at FE Investments, who also noted that recovery funds “require some patience”.
Again, there were IA UK Smaller Companies funds on the list, with Fidelity UK Smaller Companies the most popular small-cap fund with investors. It took in £91m over the period.
The latest HL Savings and Resilience Barometer also found most households lack adequate retirement savings.
More than 60% of households are not on track to have a moderate income in retirement, research by Hargreaves Lansdown has found, leading to calls for more to be done to help people build up their pension pots.
In its latest Savings and Resilience Barometer, the platform revealed that the average single person will need an income of £25,000 a year for a ‘moderate’ retirement. At the same time, a couple will require £36,480 between them.
When calculating these income needs, Hargreaves Lansdown took the 2023 estimate for a moderate retirement from the Pensions and Lifetime Savings Association (PLSA) and increased them by 7.3% – the headline inflation rate over the past year.
The updated estimate from the PLSA has an even higher income requirement for a moderate retirement: £31,300 per year for a single person and £43,000 for a couple. This is because the association added more aspirational areas such as the desire to spend more time with family post-pandemic into its methodology.
Helen Morrissey, head of retirement analysis at Hargreaves Lansdown, said: “These things will be important to many, but not all people, and many live well in retirement on far less.
“Even adopting a smaller increase exposes the huge challenges people face in planning for retirement. Only 38% of households are on track for a moderate income in retirement – there is clearly much work still to be done to improve pension adequacy.”
The investment platform found 12.2 million households do not have the pension savings required to retire with a moderate living standard. But within this group, almost 7 million have excess cash or investments that could be used to boost their pensions or SIPPs.
“It’s a simple shift that could see 1.8m households passing the threshold for a moderate retirement income and securing their financial future, while the outlook for the remaining households would be significantly improved,” Morrissey added.
Hargreaves Lansdown also thinks government reforms are crucial to further address the retirement savings gap. The anticipated auto-enrolment extension bill is a key initiative, which, upon implementation, will allow individuals to enrol from age 18 and make contributions from their first pound earned, potentially boosting their pension savings significantly over time.
Additional reforms could encourage employers to increase their contributions to employees’ pensions, the platform said. For instance, making employers match the increased contributions of employees who opt to contribute more than the minimum required.
The situation for the self-employed also demands attention, Hargreaves Lansdown finished. This group often avoids traditional pensions due to perceived inflexibility, making alternatives like a Lifetime ISA for this group more appealing due to its 25% government bonus on contributions up to £4,000 annually, with tax-free income upon withdrawal.
However, the 25% penalty for early access reduces the overall benefit, prompting calls for this penalty to be lowered to 20%. Such a change would prevent individuals from being unduly penalised for accessing their funds early.
Furthermore, extending the upper age limit for Lifetime ISA contributions from 40 to 55 could significantly aid those who become self-employed later in life, providing them an additional tool to prepare for retirement.
Whisper it quietly but after years of negative sentiment, Chinese equities finally appear to be holding their ground. What could sustain the recovery from here?
As contrarian investors, we believe it often pays to bet against the crowd. Bargains can sometimes be found where there is controversy and when performance has been poor. China has been the world’s unloved market since 2020, with 2023 marking the fourth consecutive year of losses for the Hang Seng Index.
Our positioning in China
Contrarianism is built on the premise that we might go where others do not. Valuations are compelling, and many individual stocks trade on single-digit price-to-earnings multiples and unusually high dividend yields.
Our conviction has grown as short-term uncertainties – while real – have faded in importance relative to the rarity of the long-term opportunity.
We typically look further afield to find our best ideas in parts of the market where others are not looking. But, given the unrelenting sell-off in Chinese markets and January’s additional 10% capitulation, even the well-known names within our benchmark had been ‘for sale’.
Chinese e-commerce leaders Alibaba and JD.com trade on price-to-earnings (P/E) multiples of 8x and 9x, respectively. Baidu, China’s Google, trades on a P/E multiple of under 5x core earnings, after adjustments for cash and investments.
Late last year, we initiated a position in Tencent (a stock we regrettably haven’t owned for most of our history), a high-quality, dominant social entertainment platform that underperformed last year, in line with the China benchmark, despite delivering sequential revenue and earnings growth and its P/E multiple touching 12x P/E at the lower end of its own range.
To use our car analogy for price relative to value, we assessed we were getting a high-quality Ferrari at a bargain price.
China rebounds
Despite a sea of negative sentiment, equities in the world’s second-largest economy have held their ground in recent months. So, what has changed in China’s macro picture to drive up these stock prices?
Perhaps it is the beginning of the unwinding of the negative expectations and relentlessly bearish sentiment that dominated the market earlier this year. The initial rebound may have been triggered by economic data and policy measures that support the ‘less bad’ economic situation.
For example, we have seen a resilient economy which grew faster than expected in the first quarter of 2024 – expanding at an annual pace of 5.3% and beating growth expectations, thanks to strong performances in the industrial and services sectors.
There have also been government-mandated purchases of large-cap stocks by state-owned funds to boost the benchmarks, as well as a pledge of continued support for the economy and new housing policy measures to alleviate the property sector’s drag on the economy and revive the property market.
We are also witnessing a ramp-up in special bond issuance and newly announced ultra-long-dated government bonds. All actions that give us reason to be optimistic.
But momentum is slowing and markets have now entered a vacuum period as investors wait for the government’s upcoming Plenum meeting in July.
The party is expected to roll out measures aimed at boosting consumption and providing further relief to the beleaguered property sector.
A 'head fake' or is this rally sustainable?
Forecasting anything in the short term is a fool’s game. The fundamental bottom of China’s bear market may only come with clear signs of life in the property market. China has been throwing everything at solving its property problem.
Intervention by government and regulators is also beginning to provide a backstop for markets. Most notably, the monetary easing and selective fiscal provision put in place from the end of 2023 have started to take effect and there are signs of sequential improvements of macro data. Growth indicators have exceeded expectations in recent months, bolstered by manufacturing activity and a recovery in exports.
The rally in Chinese stocks has gained momentum, but these equities are still trading at depressed multiples, with near-record large discounts relative to their historical averages, and to their emerging and developed market counterparts.
Attractive valuations may have more appeal if earnings accelerate as consumer and business confidence recovers and growth conditions improve.
Shareholder returns provide a floor
A key factor driving China’s comeback story has been the recent increase in shareholder returns through dividends and buybacks, initially at state-owned enterprises (SOEs) but increasingly at privately-owned companies too.
Not only do these provide strong valuation support, but they also make a compelling case for equity investment in a rate-cut environment.
It’s worth bearing in mind that, while other countries are facing inflation, China is witnessing deflation. This makes equities attractive for domestic investors when compared against low interest rates offered by bank accounts and could provide additional future support for the market.
Listed companies have strong balance sheets and cashflow, even more so for our holdings, and the dividend and buyback is sustainable. So, even if this isn’t the bottom, we are happy owning our companies given the valuations and shareholder returns.
After three years in a bear market, few believe in China, and it remains a consensus underweight. Valuations remain attractive, however, and sustained market moves higher may convince more people to buy and eventually real money will come.
James Cook is head of investment specialists and investment director, emerging markets at Federated Hermes. The views expressed above should not be taken as investment advice.
Trustnet begins its half-year flows series with the main UK fixed income sectors.
Investors took more money out UK bond funds than they added during the first half of the year, according to data from FE Analytics.
In all, there were 16 funds focused on fixed income in the IA Sterling Corporate Bond, Strategic Bond or High Yield sectors where investors withdrew more than £100m over the first six months of the year. Conversely, there were just 10 that were bolstered by more than £100m.
The unfortunate fund with the highest withdrawals was Aviva Inv Corporate Bond, where investors took out more than £1bn, the majority of which came in the second quarter of the year.
It has been among the worst funds in the IA Sterling Corporate Bond sector over three, five and 10 years, where it sits in the bottom quartile among its peers, although it climbed to the third quartile over one year. The fund failed the firm’s value assessment earlier this year, with performance cited as the main factor.
The second-most sold fund in the bond space came from the IA Sterling Strategic Bond, where investors have pulled £895m from Allianz Strategic Bond so far in 2024. Again performance has been poor, with the fund in the bottom quartile of the sector over one, three, five and 10 years.
However, much of the outflows may be explained by the announcement in May that manager Mike Riddell is leaving Allianz this month to join rival Fidelity.
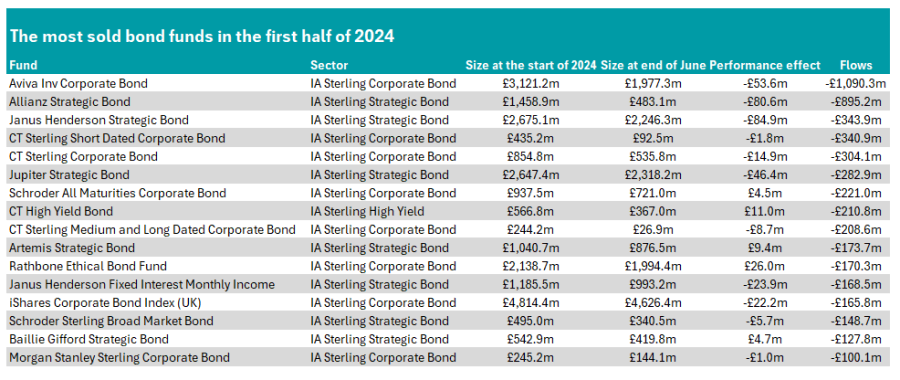
Source: FE Analytics
It is a stark drop down to the next fund, where Janus Henderson Strategic Bond sits. Investors pulled £344m from the fund in the first half of the year. There were a trio of funds with outflows of more than £300m, with the other two – CT Sterling Short Dated Corporate Bond and CT Sterling Corporate Bond – both residing in the IA Sterling Corporate Bond sector.
The only constituent of the IA Sterling High Yield sector on the list was the CT High Yield Bond, with investors taking out £211m over the past six months. Columbia Threadneedle dominated the list with four funds out of 16.
In cheerier news for bond fund managers, there were 10 that achieved inflows of more than £100m, with the most bought being a passive fund.
Abrdn Short Dated Sterling Corporate Bond Tracker took in the most money (£284m) over the first half of 2024, taking its assets under management from £916m to £1.2bn.
This is despite poor performance over the past year, in which the fund sits in the bottom quartile of the IA Sterling Corporate Bond sector. However, it is in the top quartile of its peer group over three years.
Overall inflows were lower than the outflows, however, with no other funds on the list taking in more than £200m.
The next best was FE fundinfo Alpha Manager Jonathan Golan’s Man GLG Sterling Corporate Bond fund, which raked in £183m in new money. The fund has been the best performer in the IA Sterling Corporate Bond sector over the past year.
Royal London Investment Grade Short Dated Credit rounded out the top three, which all came from the IA Sterling Corporate Bond sector. Another top-quartile performer over three years, it also boasts some of the highest returns over five years, despite making a modest 7.4% during this time.
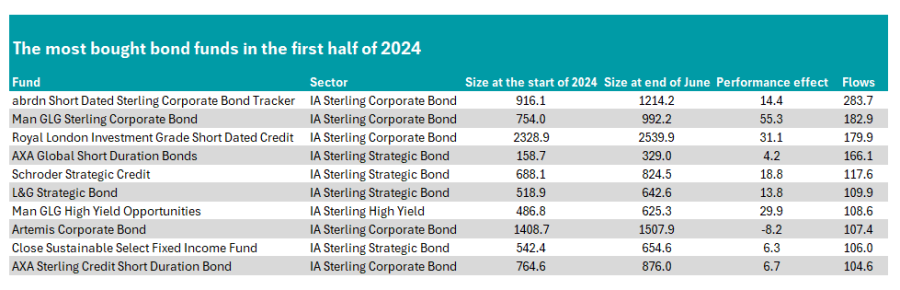
Source: FE Analytics
Man GLG had two entrants on the list, including the only member of the IA Sterling High Yield sector: Man GLG High Yield Opportunities. Managed by Alpha Manager Michael Scott, it has been the best performer in the sector over five years and has been in the top quartile among its peers over one and three years as well.
The other firm with two on the list was AXA, with both the AXA Global Short Duration Bonds and AXA Sterling Credit Short Duration Bond funds taking in more than £100m over the first half of 2024.
Trustnet researches the four active funds in the IA UK All Companies sector with less than £100m in assets under management that charge less than 1%.
Funds with fewer assets under management (AUM) have an edge when investing in small- and mid-caps because they do not face the same liquidity constraints as larger funds.
As a result, they can delve even deeper into the market-cap chain to generate more alpha, taking bigger positions in minnows that would be unachievable with too much money to manage.
However, smaller funds often charge higher fees as they do not have the scale to spread costs across a large pool of investors.
As such, below, Trustnet highlights the four active funds in the IA UK Smaller Companies sector with less than £100m in AUM and charging less than 1%.
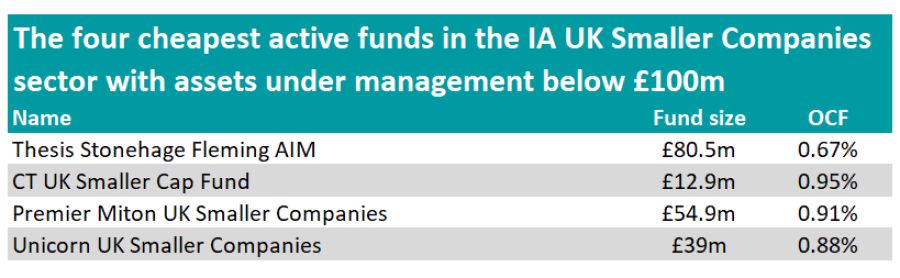
Source: FE Analytics
The £80.5m Thesis Stonehage Fleming AIM, managed by Paul Mumford and Nick Burchett, is the cheapest ‘sub-scale’ fund in the sector, with an ongoing charge figure (OCF) of 0.67%.
The fund invests in shares listed on the UK Alternative Investment Market (AIM), although its mandate allows it to hold names that have been transferred to the main market as long as they only form a small portion of the overall portfolio.
It is the second-best performing fund over the past 10 years in the IA UK Smaller Companies sector. However, this outperformance has come with higher volatility, making it one of the 10 most volatile funds over the same period.
Performance of funds over 10yrs vs sector
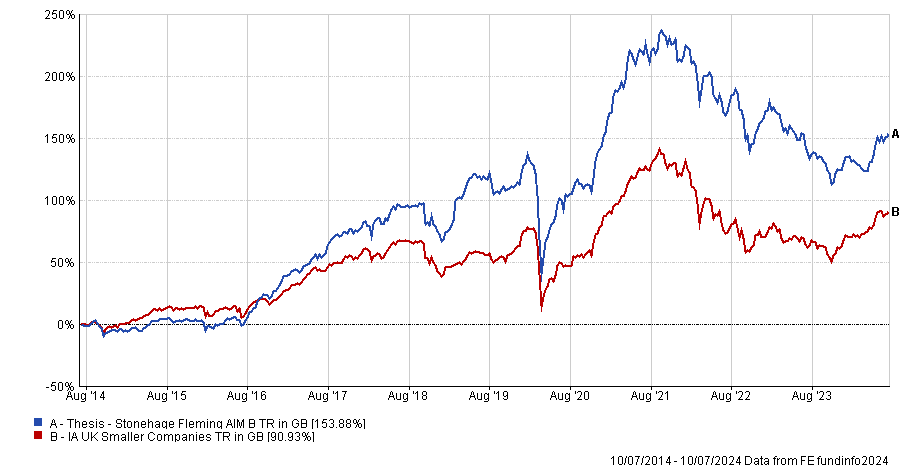
Source: FE Analytics
Furthermore, Thesis Stonehage Fleming AIM is one of the three most consistent UK small-cap funds, as it has outperformed the Numis Smaller Companies (Excluding Investment Trusts) index more regularly than most of its peers.
The £12.9m CT UK Smaller Cap Fund is the smallest fund on the list, but also the most expensive, with an Ongoing Charge Figure (OCF) of 0.95%.
Managers Catherine Stanley and Patrick Newens focus on companies displaying above-average growth rates or growth potential relative to the Numis Smaller Companies (excluding Investment Trusts) index. Indicators such as earnings and sales growth are used to assess the growth potential of a stock.
CT UK Smaller Cap Fund sits in the second quartile of the IA UK Smaller Companies sector over 10 years but has been one of the least volatile funds during that period.
Performance of funds over 10yrs vs sector and benchmark
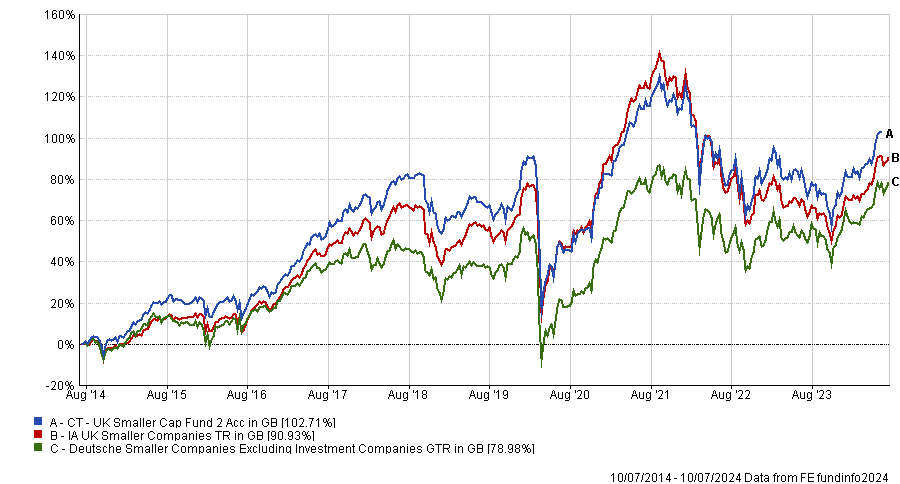
Source: FE Analytics
Trustnet recently identified Stanley as one of the few ‘veteran’ managers in the IA UK Smaller Companies sector still producing top returns.
The £54.9m Premier Miton UK Smaller Companies also made the list. It charges investors 0.91% and is managed by Gervais Williams and Martin Turner, who aim to identify companies with information gaps and significant potential for mispricing and returns.
The fund focuses on small- and micro-caps, with 68.4% of the holdings indexed on the FTSE AIM, 8.2% on the FTSE Small Cap, and 6.4% on the FTSE 250, while 7.2% are unindexed.
In terms of performance, the fund sits in the bottom quartile of the IA UK Smaller Companies sector over 10 years, as most of the returns achieved during that period were eroded from the second half of 2021 onwards.
Performance of funds over 10yrs vs sector and benchmark
Source: FE Analytics
At the beginning of the year, Williams shared his view that UK equities within sectors such as insurance, financial, manufacturing, defence and commodity have become “exciting again”, if inflation persists.
Finally, the £39m Unicorn UK Smaller Companies, managed by Simon Moon and Fraser Mackersie, charges 0.88%.
Although the managers do not base their portfolio construction on macroeconomic views, the fund shows a preference for the engineering and financial services sectors, which make up 19.9% and 17.5% of the portfolio, respectively. In contrast, the fund has no exposure to the oil and gas, mining, and biotechnology sectors.
It sits in the second quartile of the IA UK Smaller Companies sector over 10 years, but has made top-quartile returns over more recent periods. It has also been more volatile than its sector peers, ranking 24th out of 40 in terms of volatility.
Performance of funds over 10yrs vs sector
Source: FE Analytics
The managers recently bought shares in the UK technology firm Raspberry Pi, which listed last month. They believe that various industries will increasingly adopt the company’s single-board computer.
Having no or low exposure to Nvidia was a significant headwind over the past year but three funds still delivered top-quartile returns without loading up on the chip designer’s shares.
US equity managers have been rewarded lately for sticking closely to their benchmark’s largest stocks, whether their investment process mandates a small tracking error or high conviction, focussed bets.
Across the board, most US equity funds’ top 10 holdings read like a roll call of tech giants, with some combination of Nvidia, Microsoft, Meta, Amazon and Alphabet in there, and sometimes all five.
Nvidia has been the star performer and all but three funds in the IA North America sector with top-quartile returns over the past 12 months count it amongst their largest 10 positions.
For the three outliers – Brown Advisory US Flexible Equity, Capital Group Investment Company of America and Principal GIF US Blue Chip Equity – having low or no exposure to Nvidia was a headwind to relative performance, for which they had to compensate with superior stock-picking elsewhere.
This they managed, with all three funds outperforming the S&P 500 over the past 12 months, against which Brown Advisory and Capital Group are benchmarked. Principal US Blue Chip Equity is benchmarked against the Russell 1000 Growth, however, which it lagged.
Performance of funds vs benchmarks and sector over 1yr in dollars
Source: FE Analytics
The funds made up ground by owning other ‘Magnificent Seven’ names amongst their top 10 positions. All three funds hold Microsoft, Amazon and Alphabet. Brown Advisory and Capital Group own Meta Platforms while Capital Group also has Apple.
Other technology companies loomed large. Maneesh Bajaj at Brown Advisory has a stake in Taiwan Semiconductor Manufacturing Co., Capital Group holds Broadcom and Principal owns Intuit, a financial software provider.
The funds have exposure to beneficiaries of artificial intelligence and technological innovation themes in other sectors as well, through Mastercard, Visa and Netflix. All three funds own Mastercard while Principal holds the other two stocks.
Two of the funds own defence and aerospace manufacturing companies, which have soared on the back of rising geopolitical tension and defence spending. Capital Group holds General Electric and RTX Corp. (formerly Raytheon Technologies), while Principal has TransDigm Group.
Financial services also feature. Thomas Rozycki and K. William Nolin at Principal Global Investors own the insurer Progressive Corp. and the Canadian investment group, Brookfield Corporation. Bajaj holds Warren Buffett’s Berkshire Hathaway and private equity firm KKR.
The only healthcare stock amongst the three funds’ top 10 holdings was medical insurer UnitedHealth, which Brown Advisory’s $781m fund owns.
Meanwhile, Capital Group’s $449m fund has exposure to travel and leisure with Royal Caribbean Cruises.
Despite not piling into Nvidia, these three funds’ performance was still closely correlated to their respective benchmarks, with at least a 0.95 correlation.
For investors with passive exposure to the US stock market who want to use active stock pickers for diversification: GQG Partners US Equity had the lowest correlation to the S&P 500 amongst all the funds with top-quartile one-year returns, despite Nvidia being its largest holding. Its correlation to the benchmark was 0.74 during the year to 9 July 2024.
GQG Partners U.S. Equity is managed by three FE fundinfo Alpha Managers, Rajiv Jain, Brian Kersmanc and Sudarshan Murthy. The $1.6bn fund’s largest positions include Eli Lilly and Novo Nordisk, which dominate the diabetes and weight loss drugs market, alongside a clutch of tech stocks: Nvidia, Meta Platforms, Microsoft, Amazon, Broadcom, Uber Technologies and the less well-known app developer AppLovin Corp. It also owns Visa.
Performance of funds vs S&P 500 and sector over 1yr
Source: FE Analytics
Close by, T. Rowe Price US Large Cap Growth Equity had a 0.75 correlation, while three top-quartile funds had a 0.77 correlation to the S&P 500: FTF Franklin US Opportunities, Janus Henderson US Growth, Nomura American Century US Focused Innovation.
The information contained within this website is provided by Allfunds Digital, S.L.U. acting through its business division Digital Look Ltd unless otherwise stated. The information is not intended to be advice or a recommendation to buy, sell or hold any of the shares, companies or investment vehicles mentioned, nor is it information meant to be a research recommendation. This is a solution powered by Allfunds Digital, S.L.U. acting through its business division Digital Look Ltd incorporating their prices, data news, charts, fundamentals and investor tools on this site. Terms and conditions apply. Prices and trades are provided by Allfunds Digital, S.L.U. acting through its business division Digital Look Ltd and are delayed by at least 15 minutes.
© 2024 Refinitiv, an LSEG business. All rights reserved.
 Please wait...
Barclays Investment Solutions Limited provides wealth and investment products and services (including the Smart Investor investment services) and is authorised and regulated by the Financial Conduct Authority and is a member of the London Stock Exchange and NEX. Registered in England. Registered No. 2752982. Registered Office: 1 Churchill Place, London E14 5HP.
Barclays Bank UK PLC provides banking services to its customers and is authorised by the Prudential Regulation Authority and regulated by the Financial Conduct Authority and the Prudential Regulation Authority (Financial Services Register No. 759676). Registered in England. Registered No. 9740322. Registered Office: 1 Churchill Place, London E14 5HP.