Delivering income and capital growth in the same vehicle is a ‘tug of war’, according to Allspring’s Wai Lee.
A global equity income fund does not have to be wholly value-driven, anti-US or wary of technology stocks to successfully deliver income, according to Wai Lee, co-manager of Allspring Worldwide Global Equity Enhanced Income.
“Clients have previously made us aware of their frustration with their past experiences of global equity income funds, which have been [designed in this way],” Lee said.
This traditional approach is largely a product of the inherent difficulty of delivering income and capital growth simultaneously – a “tug of war”, in his words – but one he said the Allspring Worldwide Global Equity Enhanced Income fund was designed to resolve.
The £1.5bn strategy aims to deliver income without giving up capital growth and beating the MSCI ACWI benchmark in a risk-balanced manner – with no bias against any regions, sectors or styles.
Indeed, the fund’s top holdings show this flexibility, with big tech names such as Nvidia and Microsoft alongside more defensive financials like Citigroup and Sompo Holdings.
As shown in the table below, a £10,000 investment in 2020 would be worth £18,790.90 by the end of 2025, with £2,967.30 in dividends and £5,823.60 in capital appreciation.

Source: FE Analytics
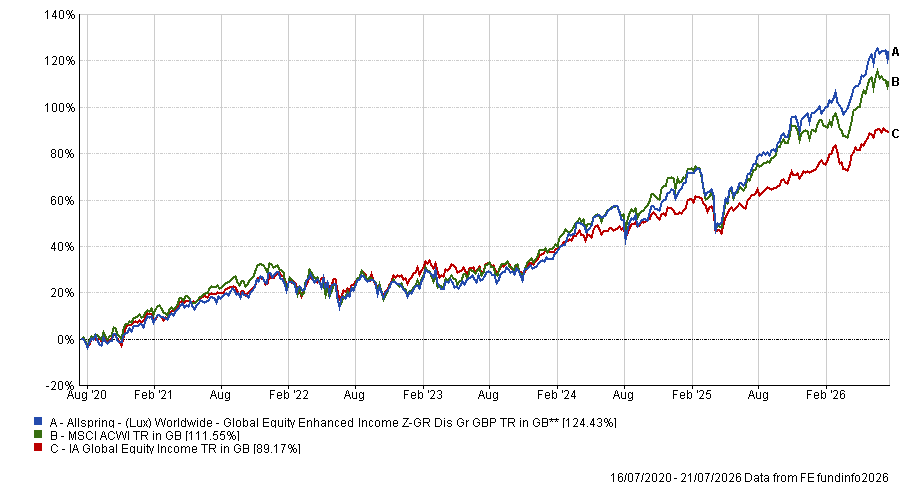
Since launch, the fund – which Lee co-manages fund alongside Vince Fioramonti, Petros Bocray, Megan Miller and Justin Carr – has overall returned 120.8%, beating both the MSCI ACWI index and the IA Global Equity Income average.
Performance of the fund vs sector and benchmark since launch
Source FE Analytics
Below, Lee explains how the fund is constructed differently from its peers, his role within the management team and recent wins and losses.
How do you look at income versus capital growth?
When we launched the strategy in 2020 we thought carefully about what the right level of income was – and decided 6% is achievable without pushing ourselves to overload on super high dividend yield stocks, which would risk eliminating a lot of the alpha opportunities.
Having launched during the height of Covid, it was a challenging environment, so a higher contribution to that 6% came from options premium. But as monetary policy normalised, we can now draw most of our income from securities – roughly two-thirds from securities dividends and the rest from index options.
We start with a benchmark-aware approach and try to stay within plus or minus 5% in both regions and sectors. We can hold up to 10% of the portfolio in non-dividend-paying stocks. That is why when you look at our top 10 holdings, most of the Magnificent Seven are there, which is quite unusual for an income fund.
On the capital growth side, our track record is a reflection that we can deliver alpha in parallel to income. We don’t have a one-size-fits-all approach. Beyond looking at sectors and regions, we also look at whether companies are high growth and high stability, or low growth and high stability. There are many ways to dissect the universe, and we try to have a comprehensive, multiple angles approach to harvest the alpha.
How would you describe your role and process in the management team?
I have been head of research at the firm since 2018 and joined the management team in the third quarter of 2024. It came about as a natural progression, given that I was already driving the research agenda. The one thing I don’t do is trade the securities.
On the research side, we start with a universe of a few thousand stocks and narrow it down to between 100 to 200 highly ranked and attractive names. Our current portfolio has around 75 names and those are determined by my fellow co-managers.
What have been your best and worst calls over the past 12 to 18 months?
From the AI adopter perspective, we saw opportunities in banks, particularly in Europe, in pharmaceuticals and some selected software companies we thought could be underrated by the market.
Citigroup is a good example. It is a classic case of a bank turning itself around – exiting non-core retail operations, cutting costs and restoring earnings growth. In 2026, its revenue has grown by almost 15% year-on-year and earnings by more than 50%.
We saw it as a stock with improving fundamentals from a low valuation base, driving a sharp re-rating by the market.
The stock went up about 70% in the past year and we are still holding it as one of our top 10 positions.
Our worst call was in the consumer discretionary sector – specifically Booking Holdings, the online travel company.
It was favourably ranked across many of the metrics we follow, including valuation, quality, profitability and earnings outlook, and we held an overweight position.
But margins and earnings visibility came under pressure from elevated investment in AI and a softer travel backdrop and the stock fell more than 20% in the past year.
We are still holding a small overweight – no more than 1% – because we disagree with the view that AI is a threat to the company. We believe agentic AI should help a company like this navigate a complex travel ecosystem.
What do you get up to outside of fund management?
I like eating, exercising and competing in Mahjong tournaments.
The rise of passives and the AI boom mean active managers are struggling to overweight the biggest gainers.
The rise of passive funds has led to a self-reinforcing cycle. When investors pour money into tracker funds, they buy up the same few stocks at the top end of the market, which in turn grow in size and make up large proportions of the index, requiring funds to buy even more of their shares to keep up.
This flood of money into the largest companies in a market has been a common enough phenomenon in the US, where the tech-heavy ‘FAANG’ stocks made way for the also tech-heavy but slightly different ‘Magnificent Seven’.
However, right now the system is approaching breaking point, in my view, and making it almost impossible for active managers to beat the market.
Approximately 54% of total long-term US mutual fund and exchange-traded fund (ETF) assets are in passive strategies, according to industry data from the Investment Company Institute, but this is far from a US-only problem.
I would point to emerging markets as the most egregious example of a few companies causing problems for active managers.
Here, the AI boom has sent money pouring into semiconductor stocks such as TSMC in Taiwan and Samsung and SK Hynix in Korea.
These companies have ballooned in size. TSMC now represents 15.1% of the MSCI Emerging Markets index, while Samsung is at 8.2% and SK Hynix at 7.7%.
This is damaging for active fund managers, who must comply with UCITs rules by which they can have no more than 10% in one holding.
Contrast this with passive funds, which can have up to 20% in one stock (and up to 35% in ‘exceptional circumstances’).
So active managers who are fans of TSMC must underweight the stock, even if they think it will do well.
Meanwhile, although they can technically overweight Samsung and SK Hynix, most will be unable to for other reasons. One potentially limiting factor is that pushing up against the 10% barrier means if the stock performs well, managers must constantly sell it down once it approaches this level, incurring transaction costs that will eat into their returns.
Additionally, many risk models suggest that such high concentration in one holding is too much, which makes sense but nowadays seems set up for a world that no longer exists, where the passive juggernaut remains in check and the market is not led so dominantly by a handful of names.
There are similar problems everywhere, including the domestic market. At 8.7% of the FTSE All Share, few active managers will be able to overweight HSBC, while AstraZeneca is also tough to bet big on at 7.5% of the index.
All this implies that active managers are currently investing with one hand tied behind their backs. Whether it be through regulatory obligations or their own (potentially outdated) in-house risk frameworks, it is very difficult to take big stances on the most successful companies in the market.
However, investors should remember the opposite is also true. When the passive cogs start turning in the downward direction, the most-owned stocks will be the hardest hit and active managers should weather the storm better.
This is therefore not an advert for passive investing. Nor is it a get-out-of-jail-free card for active managers who have done a poor job. After all, for almost the entirety of the 2010s, value investing was out of favour, yet the best managers who invest using the style could still eke out credible performance.
But recent headlines have been hard on active managers. Rightly so, in some cases, but it is important to note that there is nuance. So when you see statistics like how just 42% of active funds beat their passive equivalents in the first half of 2026, it is worth asking why this is the case.
Don’t give your active funds a free pass but do cut them some slack if the performance is good, without beating the benchmark. That second part is not easy to do right now.
Jonathan Jones is editor of Trustnet. The views expressed above should not be taken as investment advice.
Laura Foll will take over as lead manager of Law Debenture and Lowland when Henderson steps down in June 2027.
James Henderson, FE fundinfo Alpha manager of Law Debenture, the Lowland investment company and the Janus Henderson UK Equity Income & Growth fund, is to retire from Janus Henderson in June 2027 after 44 years in financial services, as announced this morning alongside Law Debenture’s half-year results.
Laura Foll, his co-manager on all three mandates, has been confirmed as taking over all of them.
Henderson first worked on the Law Debenture portfolio in 1994 and took sole lead management responsibility in 2003.
Since then, as trust chairman Robert Hingley noted, Henderson has overseen a net-asset value total return of 1,288% compared to FTSE All-Share total return of 546% over the same period. The chart below shows the share price total return of the trusts over 20 years, during which time both have significantly outperformed their peers and the index.
Performance of fund against index and sector over 20yrs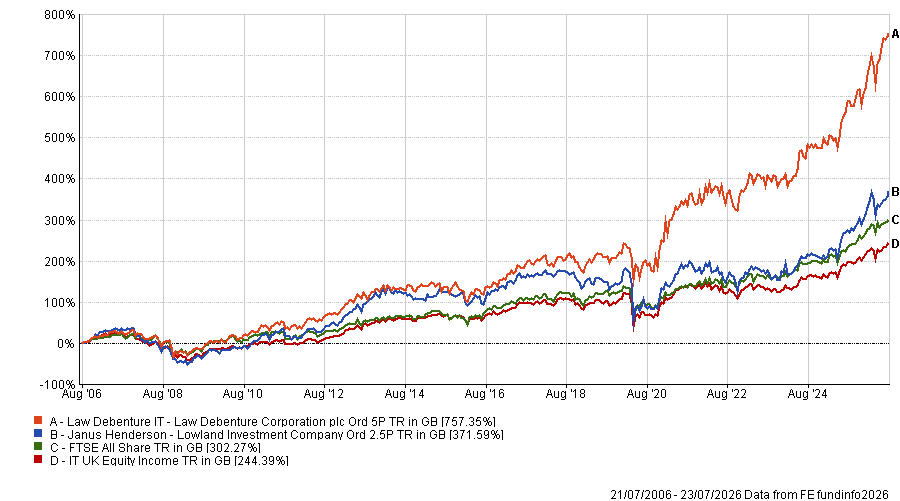
Source: FE Analytics
It was confirmed there will be no change to either trust's investment objective or strategy once Foll takes sole charge, with Henderson continuing to work with the team until his departure next year.
In the Law Debenture half-year results, Henderson said: "Laura and I have worked closely together for 15 years, including seven years jointly managing the Law Debenture portfolio. I have no doubt that she will continue to be a huge asset to the company and wish her all the best for the years ahead."
At Lowland, chair Helena Vinnicombe said Foll “has played a vital role in delivering for our shareholders over the past 10 years”, adding that the board had “every confidence” in her ability to continue delivering for shareholders.
Outside commentary was reassured by the continuity of the arrangement. Matthew Read, senior analyst at QuotedData, said Henderson's departure “certainly feels like the end of an era”, pointing to a patient, contrarian style that had served investors well across market cycles.
He added that while the retirement of a longstanding manager might ordinarily unsettle investors, shareholders in both trusts could take comfort that Henderson leaves the portfolios “in the very capable hands of Laura Foll, who has worked alongside him for a number of years now”.
Law Debenture also used the half-year results to report a net asset value total return of 11.4% and a share price total return of 16.2% for the six months to 30 June, ahead of the FTSE All-Share's 7.2%, alongside a 6% rise in the first interim dividend to 8.875p.
Trustnet ranks the 10 IA Global funds that were most popular with investors in 2025 by their H1 2026 returns.
Kudos to the investors who chose to stick with the herd and bought one of the most-bought global funds of 2025, because eight out of 10 funds with last year’s highest inflows managed to beat their sector average in 2026 so far.
Those who picked a tracker had even better chances of success, as all of the most-bought trackers beat the IA Global sector average of 10.1%. Investing actively required more skill: of the three active strategies in the list, only one was above average: Schroder QEP Global Core.
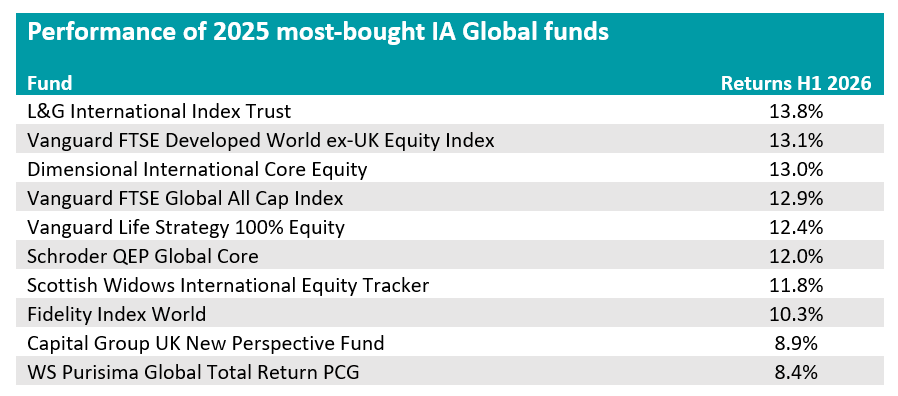
In this ongoing series, Trustnet is testing investors’ short-term instincts by reviewing how the most-bought funds of last year have performed in the first six months of 2026. Today, we turn to the IA Global sector, with the most-bought funds of last year listed in the table below.
Source: FinXL
Trackers dominate
L&G International Index Trust led the group with a 13.8% return, ahead of a cluster of Vanguard and other passive strategies in the 12-13% range.
The £8.1bn L&G fund charges 0.13% and appears on Hargreaves Lansdown's Wealth Shortlist, with HL analysts highlighting it for being “one of the lowest-cost global tracker funds available”.
It also gives UK investors exposure to global markets without adding to their home bias, as HL noted, and this is a feature of almost all the funds in this table, as we point out later.
In second place, Vanguard FTSE Developed World ex-UK Equity Index is the largest fund on the entire list at £31.9bn, more than double the size of the next biggest. Priced at 0.14% and RSMR rated, it returned 13.1% – a performance very nearly matched by the next two funds – Dimensional International Core Equity and Vanguard FTSE Global All Cap Index.
The Vanguard all cap fund includes UK companies alongside its global exposure, as does the popular Vanguard LifeStrategy 100% Equity, which returned 12.4%.
At £12.7bn, Vanguard LifeStrategy 100% Equity is the second-largest fund in the group and charges 0.20%.
It carries a Titan Square Mile ‘recommended’ rating alongside an RSMR rating and a FE fundinfo Crown rating of four. Its bias to UK companies is still there but was softened earlier this year, with exposure to the home market reduced from 25% to 20%.
Scottish Widows International Equity Tracker almost matched Vanguard with an 11.8% return but costs considerably more at 0.57%, the priciest pure tracker on the list.
Fidelity Index World returned 10.3%, just ahead of the 10.1% sector average. At £16bn, it charges 0.12% and appears on three separate best-buy lists: Hargreaves Lansdown, AJ Bell and Barclays.
Analysts from all three platforms agreed that the vehicle offers investors a diversified, low-cost and efficient way to track developed-market stocks, backed up by the reputation and experienced management of one of the largest investment companies in the world.
Active funds lag behind
Turning to actively managed strategies, Schroder QEP Global Core was the only one to beat the sector average, returning 12%. The fund uses a quantitative process that screens over 15,000 stocks down to several hundred, ranking them on quality and value factors, and is restricted to positions within 50 basis points of the index at stock level.
RSMR described it as “a low-cost way to gain access to an actively managed strategy with low tracking error to the MSCI World Index”. It charges 0.30% and carries a four crown rating.
Failing to beat the average peer, Capital Group New Perspective returned 8.9% and is the smallest fund on the list at £455m. It charges 0.68% and takes a bottom-up, stock-picking approach spread across close to 300 holdings, with more than a third of names held for eight years or more.
RSMR analysts called it “an ideal core holding in equities”, pointing to its long record across market cycles.
WS Purisima Global Total Return finished last at 8.4%. It is the most expensive fund on the list by some distance at 1.51%, more than 10 times L&G's charge.
Trustnet looks at how the UK funds investors with the highest inflows last year have performed since.
Investors seem to have had good instincts when they bought IA UK All Companies or IA UK Equity Income funds last year, with five out of the seven most bought strategies in the sectors outperforming their average peer in the first half of 2026.
In this series, Trustnet is looking at the first-half performance of the funds that received the most new money from investors in 2025, to find out if they have been right in their choices so far.
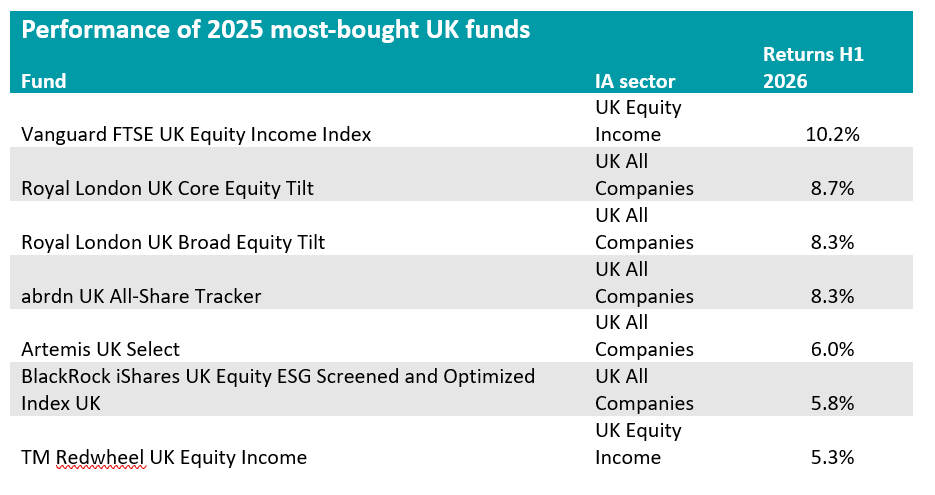
Below, we focus on the UK equity sectors. Just seven funds from the IA UK All Companies and IA UK Equity Income sectors were previously highlighted by Trustnet for their 2025 inflows.
Source: FE Analytics
Topping the list is Vanguard FTSE UK Equity Income Index with a 10.2% return after an ongoing charge of 0.14%.
Run passively, it outperformed a good number of higher-charging active names in the list. Returns were mostly driven by its heavy exposure to highly profitable UK banks, as well as a market that is increasingly prioritising immediate cash flow and dividend yields over speculative future growth.
At the opposite side of the table, TM Redwheel UK Equity Income sat at the bottom of the equity income names with a 5.3% return since January – more than 1 percentage point below the average peer, which made 6.1%.
The potential for short-term underperformance has been flagged by RSMR analysts.
“While it may not always top performance tables in the short term, the fund has a proven track record of delivering impressive long-term returns,” they said.
“For investors seeking a robust, income-generating strategy with a strong foundation in disciplined stock selection and risk-aware portfolio management, the Redwheel UK Equity Income fund is a compelling choice”.
They also praised the “experienced and well-resourced team of investment managers and analysts”, whose interests are “firmly aligned with those of their clients”.
The managers apply a “rigorous framework that enforces discipline: trimming outperformers to lock in gains, while resisting the temptation to chase underperformers”, ensuing the fund remains focused on quality and valuation, with a strong emphasis on a margin of safety.
At 0.77%, TM Redwheel UK Equity Income is the second most expensive fund on the list.
In the IA UK All Companies sector, Royal London UK Core Equity Tilt is the largest fund in the entire top 10 at £7.4bn, roughly three times the size of the next biggest, and returned 8.7%.
Its sister strategy, Royal London UK Broad Equity Tilt, returned 8.3% and carries a Titan Square Mile ‘recommended’ rating. Both charge 0.08% and are run by Michael Sprot and FE fundinfo Alpha Manager Nils Jungbacke.
Titan Square Mile analysts noted the fund has at least 10% lower carbon intensity than the index it tracks. They said this is positive, but pointed out that other ESG passive funds are available to retail investors. Some of these have higher tracking errors but stronger ESG credentials, for example through more exclusions, while others positively tilt towards stocks with strong ESG credentials.
The abrdn UK All-Share tracker matched the Broad Equity Tilt fund's 8.3% return. It is the second cheapest fund on the entire list at 0.06%.
Both Artemis UK Select returned 6% and iShares UK Equity ESG Screened and Optimised Index (UK) made 5.8%, the lowest of the five IA UK All Companies names but still above the sector average of 5.2%.
The Artemis strategy is co-led by Amrose Faulks and Alpha Manager Ed Legget. FundCalibre said Artemis UK Select “stands out as one of the premier UK equity funds due to the impressive track record of its managers”.
They added: “The fund’s high-conviction approach and flexibility in stock selection make it an attractive choice for investors who are comfortable with higher levels of risk in pursuit of substantial long-term gains. However, investors should be prepared for potential drawdowns during periods of market stress.”
Its 0.80% OCF means it is the most expensive fund of the seven.
The iShares ETF charges 0.05%, the cheapest fund in the group. However, its ESG screening did not produce any performance advantage over the unscreened Vanguard and abrdn trackers, which both finished ahead of it.
Philip Wolstencroft explains how a self-imposed ‘Ulysses pact’ keeps his Artemis SmartGARP European Equity fund clear of market sirens.
As Christopher Nolan’s new telling of The Odyssey hits movie screens across Britain, I can’t help thinking of what its hero can teach us about investing at a time of overheating markets.
When some shares are rising seemingly remorselessly it can be very tempting to wade in and buy for fear of missing out.
In the classic Greek legend, Ulysses (the latinised version of Odysseus) is determined to hear the song of the sirens but knows that it will lead him to act irrationally, leading to his doom.
He makes what has become known as a ‘Ulysses pact’ with his crew. They strap him to the ship’s mast and then block their ears with wax. Ulysses is able to hear the sirens’ alluring though deadly singing but they sail to safety – for a short while, anyway!
So how do you resist the siren temptation of markets and psychological biases? I learned a long time ago that the only way was to sign my own Ulysses pact, creating a process that is 80% systematic and 20% subjective override.
The SmartGARP screens on criteria like growth, valuations and changes in profit forecasts. It essentially mimics what most fund managers say they do but that I often find myself questioning. If you give someone two stocks – a fairly fast-growing one and a slow-growing one – they say they'd choose the fast-growing company. If you offer them a cheaper company or a more expensive company, they'd rather buy the cheaper one. And if you say, would you rather have one with good news flow coming out or bad news flow? They'd go for the good news flow.
So why do our funds differ so much from the consensus? Seven out of 10 funds in Europe are still pro quality and underweight value, despite value outperforming for some time now. If you look at news flow over the past five years, many cheap companies have had generally good news flow coming out of them, and many quality companies the reverse.
So, for example, four years ago, everybody thought that LVMH was top of the pile when it comes to quality, and yet over the past three or four years, there's been a steady drip, drip, drip of bad news.
Similarly, the pharma company Novo Nordisk. If you take the period from 2020 to 2024, Novo Nordisk was a hugely popular stock. Every fund manager loved it. We bought it early and enjoyed the benefits. As the earnings went up the stock price went through the roof. The story made a lot of sense: Novo Nordisk had a duopoly on weight loss drugs in an era where obesity levels are rising globally.
In August 2024 the first cracks began appearing in the story. The company cut its earnings forecasts by two per cent as sales of Ozempic missed expectations thanks to competition from US pharmaceutical company Eli Lilly and supply constraints. People said it was a temporary phenomenon, but the numbers told a different story.
The shares were twice the market multiple even with a downgrade. The computer said sell. We did. The share price collapsed and profits continue to fall.
Following the sirens can mean you are blinded to opportunities as well as risks. After the global financial crisis banks were cheap and the earnings kept falling. Fund managers around the world became increasingly negative. When the earnings started to recover after the Covid pandemic, most couldn’t believe that this was a temporary phenomenon and banks remained unloved.
Many still consider them low-quality businesses. They might be, but the earnings are still rising and slowly but surely the share price has been following. Managements seem to be doing sensible things – buying in shares and avoiding crazy acquisitions.
Within this sector are some that SmartGARP scores more heavily than others. Our top 10 holdings feature France’s BNP Paribas and Soc Gen, Spain’s Banco Santander and Banco Bilbao Vizcaya Argentaria, Italy’s BPER Banca and Hungary’s OTP banking group – 21% of the fund.
We have rotated through banks as prices have caught up with the improving story.
That’s a similar story in pharma. We sold the Swiss company, Novartis recently – it’s risen over 30% in the past year – and bought France’s Sanofi. Over the past decade Novartis’ earnings growth has been about 2.5% greater than Sanofi’s, but in the past year Sanofi’s earnings have been better and whereas 15 months ago they were on a similar P/E ratio, today Sanofi’s is about half that of Novartis.
In the past three months oil stocks have had big profit upgrades, but we all know why that is. This is where our ‘20% subjective override’ comes in – applying wider reading to recognise when the numbers you tie yourself to basing decisions on might be temporarily skewed.
In other sectors, travel, airlines, food/beverage and telecom are seeing downgrades – rocks we’d rather sail around.
The call of the sirens is strong. Our impulses and emotions get in the way of smart thinking. If you can focus just on the data – constantly buying stocks that are a bit cheaper than the market, growing a bit faster than the market, and generally under owned by investors, experience has shown me that the odds stack in your favour.
Philip Wolstencroft is manager of the Artemis SmartGARP European Equity Fund and creator of the Artemis SmartGARP process. The views expressed above should not be taken as investment advice.
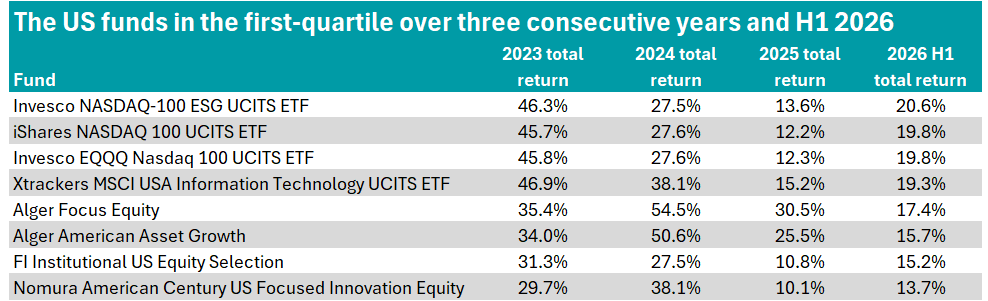
These strategies logged three consecutive years of top-quartile returns.
The past few years have been among the most rewarding in recent memory for US equity investors as the AI build-out sparked by the launch of ChatGPT in late 2022 marked the start of a technology rally of historic proportions – though one punctuated by sharp sell-offs that have kept investors questioning whether it represents a genuine revolution or a bubble waiting to burst.
Trustnet has identified IA North America funds that delivered first-quartile returns consecutively from 2023 to 2025 and have done so again in the first half of 2026, to show funds that are performing well consistently, rather than those bolstered by a single strong year. As shown in the table below, eight funds met these criteria.
Source: FE Analytics
A number of passive funds feature in the table, with Invesco NASDAQ-100 ESG UCITS ETF logging the strongest returns in the first half of 2026. The exchange-traded fund (ETF) tracks the technology-heavy Nasdaq index but also evaluates companies on the basis of their activities, controversies and environmental, social and governance (ESG) risk ratings.
Alongside it sit the iShares Nasdaq 100 UCITS ETF, Invesco EQQQ Nasdaq 100 UCITS ETF and Xtrackers MSCI USA Information Technology UCITS ETF, which have all delivered similar returns given their equal focus on technology stocks.
However, when looking at the actively managed funds, the strongest performer in the first half of 2026 was Alger Focus Equity, which gained 17.4%.
Although a small fund, with $53.8m in assets, the fund carries an FE fundinfo Crown Rating of five and is co-managed by FE fundinfo Alpha Managers Ankur Crawford and Patrick Kelly.
The 50-stock portfolio consists of companies of any market capitalisation identified through fundamental research as demonstrating promising growth potential and long-term capital appreciation. These prospective investee companies are stress-tested for a range of potential outcomes.
The managers argue that companies undergoing ‘positive dynamic change’ offer the best investment opportunities – those experiencing high unit volume growth alongside positive lifecycle change.
Alger Focus Equity has an active share of 56.2% and a market capitalisation weighted average of $1.8bn. It has big positions in major AI players, such as Nvidia (8.8%), Amazon (8.6%) and Microsoft (7.5%), while top active holdings include TSMC, Western Digital Corporation and AppLovin.
Looking at the fund’s full track record since it was launched late 2019, Alger Focus Equity has logged first-quartile returns in four out of six years. In 2021 and 2022, however, it dropped to the fourth quartile in the sector, gaining 20.7% in 2021 and losing 28.5% in 2022.
The fund has previously been highlighted as a ‘hidden gem’ in the US as it logged top-quartile returns over three years.
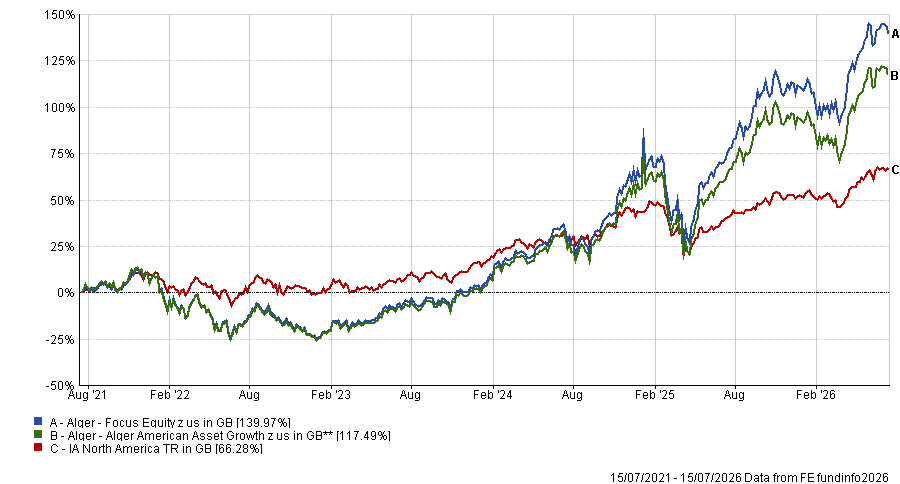
Alger has another fund in the table - Alger American Asset Growth. At $842m, the larger fund also carries a five-crown rating and is co-managed by the same team and utilises the same investment philosophy.
The more established strategy has logged first quartile returns in the sector over one, three, five and 10 years, gaining 529% over the decade ending June 2026. Further demonstrating its consistency, Alger American Asset Growth logged higher returns than the S&P 500 index over seven of the past 10 years.
The fund also rebounded sharply after the US tariff-related sell-off in April 2025, rising more than 50% over the following five months.
However, the fund does sit at the higher end of the cost spectrum, with an ongoing charges figure (OCF) of 1% as at 31 December 2025.
Performance of the funds vs sector over 5yrs
Source: FE Analytics
Another actively managed portfolio that has achieved first-quartile returns since its launch in 2023 is the £112.5m Nomura American Century US Focused Innovation Equity fund.
Managed by Henry He and supported by Keith Lee, the fund invests in a concentrated portfolio of companies with significant long-term growth potential. The top 10 holdings of the 46-stock portfolio include five of the Magnificent Seven stocks, including Elon Musk’s Tesla.
Despite the tech concentration of the top 10, Nomura American Century US Focused Innovation Equity remains underweight the information technology sector versus the benchmark at 46.9% versus 60%, while it is overweight communication services, consumer discretionary and healthcare.
The fund has recovered from initial months of struggle after US president Donald Trump was inaugurated for his second term in the White House, when it lost 17.3%.
The final actively managed fund in the table is FI Institutional US Equity Selection, a $1.6bn strategy co-managed by Aaran Anderson, Jeffery Silk, Ken Fisher, Michael Hanson and William Glaser.
The investment objective is to outperform the S&P 500 index, while, in periods of extreme volatility, it may invest on a short-term basis in cash, cash equivalents, money market instruments, or government or corporate bonds.
FI Institutional US Equity Selection also promotes environmental and social characteristics. This includes the managers seeking to have at least 5% of the portfolio composed of sustainable investments, applying exclusionary screens to prevent investment in companies that do not meet its minimum ESG criteria.
A run of large cash premiums for UK-listed companies is fuelling an argument that the London market remains structurally underpriced and that a shrinking pool of listed businesses is making the problem worse.
The large cash premiums being offered for UK-listed companies, such as Tuesday's bid for support services group Mitie, suggest UK equities remain underpriced despite major indices trading close to record highs, according to investment commentators.
What’s more, there are worries that each deal shrinks the UK market further, making the valuation gap harder to close.
Mitie shareholders will receive up to 221.6 pence a share in cash, valuing the company at approximately £3.1bn if the final dividend is declared and paid in full. The deal is expected to complete in the first quarter of 2027, subject to shareholder and regulatory approval.
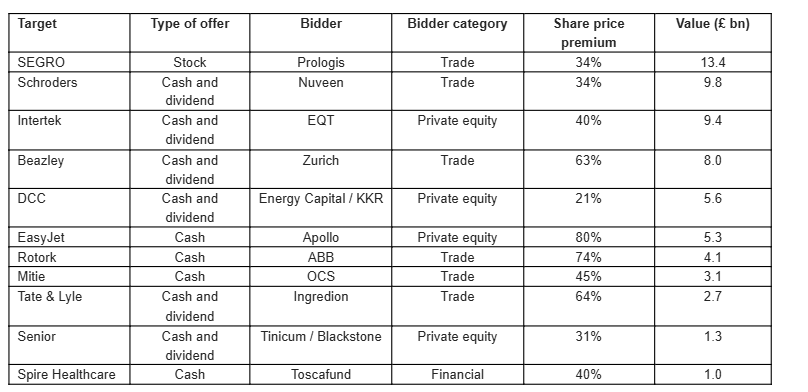
Russ Mould, investment director at AJ Bell, noted that the Mitie deal is the eighth-highest UK takeover bid of 2026 and the 11th transaction this year valued at more than £1bn.
He put the 45% premium to Mitie's undisturbed share price above the year-to-date average of 43% across 36 live or completed UK deals and said the combined value of this year's live and completed bids could reach £69.3bn, equivalent to 2.4% of the combined market capitalisation of the FTSE All Share and AIM All Share.
Proposed UK takeovers in 2026 so far
Source: AJ Bell, company accounts
Aberdeen Investments, using Deutsche Numis data, said the number of potential and confirmed UK takeover approaches this year sits at 27, with a combined value of more than $70bn. Nine approaches have been announced in the past month alone.
Each deal reduces the number of companies available to investors. The number of companies in the FTSE All Share has fallen 11% over five years, with almost 300 fewer constituents across the FTSE All Share and FTSE AIM All Share combined compared with five years ago, Aberdeen said.
Clive Beagles, senior fund manager of the JOHCM UK Equity Income fund, said the effect compounds over time. UK-listed companies once accounted for 10-15% of global stock market value; that share has fallen to roughly 3%, leaving the entire UK equity market smaller than the two largest US-listed companies.
"While acquisitions deliver short-term premiums, they reinforce a longer-term cycle of decline," Beagles said. "At the current rate of M&A (the number of companies leaving the market relative to the number of companies joining the market), the UK market will be materially smaller in 10 years' time."
The businesses being acquired are not simply the cheapest or weakest, commentators noted. Rebecca Maclean, investment director for developed market equities at Aberdeen Investments, said: "Public markets may have fallen out of love with dependable compounders, but strategic acquirers continue to recognise the value of businesses with durable competitive advantages, that generate strong cashflows, visible earnings and returns comfortably above their cost of capital.
"Importantly, this is not just a search for cheap assets. Companies such as Rotork and Intertek illustrate the type of quality businesses that continue to appeal to acquirers."
Garry White, chief investment commentator at Raymond James, said Mitie's approach follows a run of takeover activity affecting energy firm DCC, oil and gas services company Rotork and property giant SEGRO within the space of roughly six weeks.
DCC had received an improved bid from a consortium led by KKR and Energy Capital Partners, following a series of proposals dating back to late April 2026, while Rotork had received a recommended takeover approach from ABB. SEGRO remains the subject of an ongoing approach from Prologis, which made a "best and final" offer of £14bn on Wednesday.
Mould said the size of the premiums being offered suggests acquirers still expect a return that compensates for the risk involved, even with the FTSE 100, FTSE 250 and FTSE All Share all trading close to record highs.
"Valuation is, after all, the ultimate arbiter of investment return, whether you own one share in a company or all of them," he said.
Maclean said the broader macroeconomic backdrop may be turning more supportive for UK equities, pointing to an upward revision to second-quarter UK GDP and the Bank of England holding off further rate rises.
She also raised the question of whether the government should scrap stamp duty on share dealing, arguing this could help draw domestic capital back into UK-listed companies and slow the pace at which the market is shrinking.
"While the UK has some great stories to tell, sooner or later we are going to run out of them," she added.
JOHCM’s Beagles expects to see incremental policy measures from the new government to lift domestic equity ownership, such as linking pension tax relief to minimum allocations to UK assets.
White finished: "Investors will be asking whether this wave of takeover activity reflects a belief among overseas buyers and private equity firms that UK-listed companies are undervalued.
"Attention will also likely turn to whether the autumn Budget under new prime minister Andy Burnham might include measures designed to enhance the attractiveness of London's equity market and stem the flow of companies leaving the exchange."
Gen Z are the most likely to use the new technology to guide their investment decisions.
More than half of UK investors have used AI for investment guidance with around six in 10 saying they would be comfortable allowing AI to choose where to invest their money, research conducted by Opinium, in partnership with the Investment Association, has shown.
Gen Z are the most likely to use the new technology to guide their investment decisions, with almost eight in 10 using AI to find out more about investing.
In particular, they are using it to ask questions, understand financial language and explore investment decisions in a way that feels accessible and convenient.
The survey of 2,000 people found Millennials were just behind, with three-quarters of respondents in the age category having previously used AI to find out more about markets.
These figures plummet dramatically among older people, however, with less than half (47%) of Gen X and 17% of Baby Boomers on board with using the technology for investment purposes.
Three in five Gen Zers said they are likely to use AI to choose where to invest their money, with more than half of Millennials also happy to do so.
Miranda Seath, director of market insight and fund sectors at the Investment Association, said: “AI has already reshaped the way consumers are learning about investing and this change is likely only to accelerate over the rest of the decade.
“The extent to which younger investors trust AI is striking and the survey data suggest that familiarity with using AI builds confidence in its outputs. However, ensuring information is accurate, verifiable and up to date remains a key concern for investors.”
Indeed, half of investors said they would not trust AI for information, although this is largely weighted to older people, with less than one in three Gen Zers highlighting this concern.
Additionally, those who have already used AI before are more likely to trust it. From this cohort, nearly three quarters said they trusted AI, suggesting familiarity builds confidence.
James Nicandrou, associate director at Opinium, added: “While younger investors are clearly more comfortable using AI than older generations, trust still depends on transparency. Investors want to know that information is accurate and easy to verify.”
Seath noted that this “underlines the importance of continuing to provide information that is clear, accurate and up to date” regardless of whether customers are using AI tools or whether they are engaging directly through face-to-face interactions.
Nicandrou added that clear safeguards and signposting will be crucial to helping people use these tools confidently and responsibly, particularly when it comes to financial decision-making.
Investors don’t always need to pay high fees for top performance.
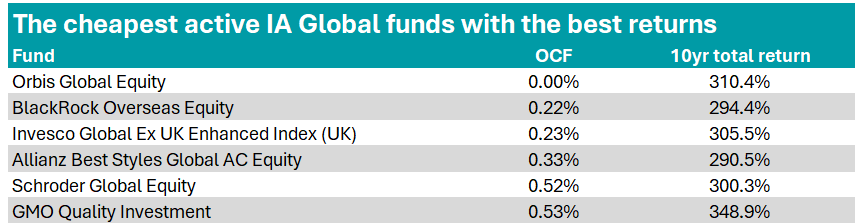
Six global funds are offering investors a middle ground between lower costs and the potential for excess long-term returns from skilled active managers, according to Trustnet research.
In this ongoing series, we screen Investment Association (IA) sectors for funds that sit in the cheapest decile of actively managed strategies –measured by ongoing charge figure (OCF) – while also ranking in the top decile of their overall sector for 10-year returns.
Overall, the cheapest decile of funds in the IA Global sector over the assessed period logged a stronger average return than those invested in the most expensive decile – 241.1% versus 172%.
Among IA Global funds, only six qualified, as shown in the table below.
Source: FE Analytics
The Orbis Global Equity fund stands out immediately, seemingly charging 0% in exchange for the second-best 10-year return in the table at 310.4%.
However, the fund is not technically free. Instead, it operates a performance-linked fee model: if it fails to beat its benchmark, the MSCI World index, it does not charge a fee, and 40% of any underperformance is paid back. When it does outperform, 40% of the excess return is taken as a performance fee.
The fund has logged a steady increase in assets, with an acceleration from around £250m in February 2025, to knocking on the door of £1bn today.
The £962.7m strategy is mostly invested in the US at 45% but this is a significant underweight versus the benchmark’s 72%. It is also overweight the UK at 13% versus 3% of the benchmark.
These regional positions arguably feed into the fund’s sector exposures, with technology at a low 17% versus 30% of the benchmark and industrials at 23% (versus 12% for the index). Even so, several of its top 10 holdings are clear AI-related plays, including Samsung Electronics and TSMC.
Last year, the fund attracted attention for logging a strong performance without owning any Magnificent Seven stocks.
Orbis Global Equity added £228m of net new money in 2025.
Performance of the fund vs sector over 10yrs
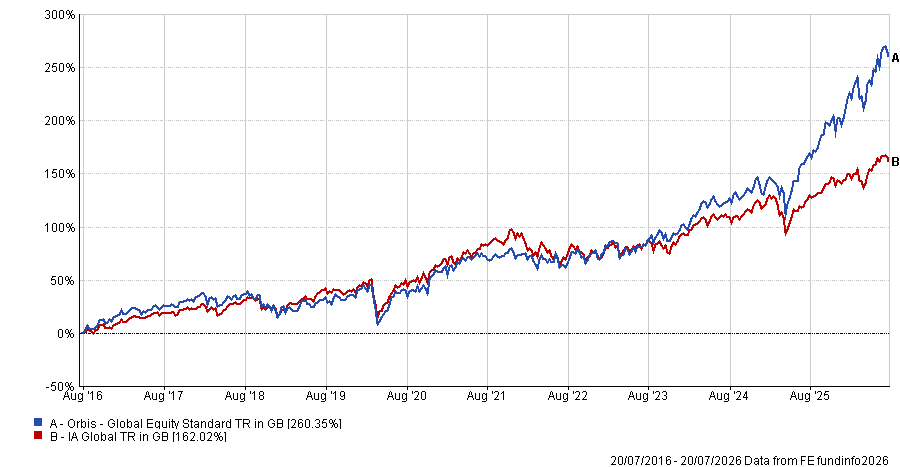
Source: FE Analytics
Putting the Orbis strategy’s unique fee structure to one side, then the cheapest active fund in the table is BlackRock Overseas Equity, with an OCF of 0.22% and a 10-year return of 294.4%.
The £491m strategy has been managed by Steve Walker since 2013 and targets both growth and income by investing at least 70% of its total assets in iShares funds.
This indirect approach gives the fund broad diversification while maintaining a low cost profile.
Meanwhile, the strongest performer in the table is the $8.7bn GMO Quality Investment fund. It delivered a 10-year return of 348.9% but it is the most expensive fund in the table, with an OCF of 0.53%.
The strategy holds a five-Crown FE fundinfo Rating and is co-managed by Tom Hancock, Anthony Hene and Ty Cobb, who target capital accumulation through a concentrated portfolio of up to 50 high-quality global companies selected for their attractive valuations and strong fundamentals.
Indeed, of the funds in the sector, it has one of the highest correlations to quality stocks over the past three years.
Looking at the calendar-year returns over the decade, GMO Quality Investment has posted a return in the third decile or better in six of the 10 years. It has also maintained a maximum crown rating since its track record began in 2022 and has been highlighted for the consistency of its longer-term performance.
Titan Square Mile analysts said: “Recognised for its fundamental and quantitative research, the team combines extensive experience across investment styles – indeed, the managers have the ability to adjust the style of the portfolio by tilting weights to the three underlying buckets (quality growth, core quality and quality value) with the aim of outperforming in different market environments, which we believe gives the fund an edge over peers.”
As a result, the portfolio typically excels in risk-off environments, where the market values company fundamentals over sentiment or optimism, the analysts said.
In the long-term, they argued the fund’s ability to avoid full participation in market downturns should enhance returns.
Performance of the fund vs sector over 10yrs
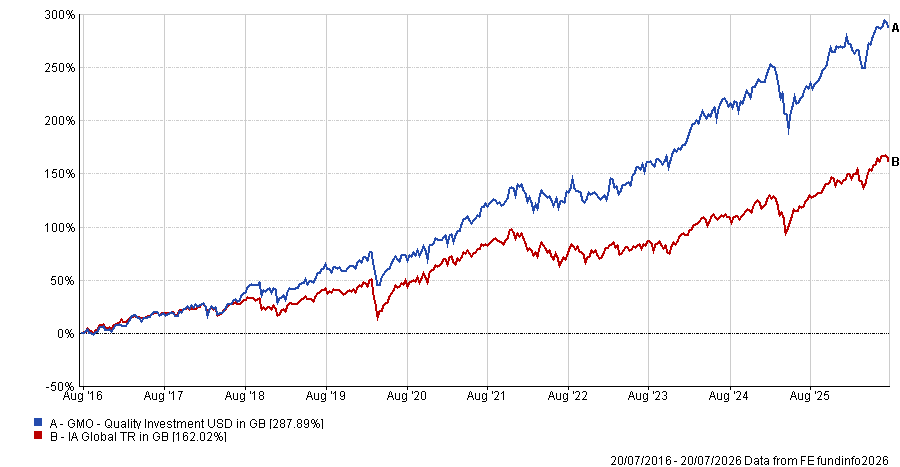
Source: FE Analytics
Schroder Global Equity is another large actively managed fund with an Alpha Manager at the helm (Alex Tedder) that has posted a strong 10-year return for a lower cost than many of its peers.
The strategy targets capital accumulation through a diversified portfolio of global companies and has a growth tilt. Its highest sector weighting is to technology at 33.6%, with top holdings including Magnificent Seven stocks Alphabet, Nvidia and Apple.
Titan Square Mile analysts said: “The strategy’s focus on identifying a ‘growth gap’ is both intuitive and repeatable and has proven effective across a range of market environments, while the teams’ disciplined approach to stock selection and portfolio construction, grounded in long-term fundamentals, has consistently delivered strong risk-adjusted returns, with a clear emphasis on earnings as the primary driver of outperformance.”
They noted that Schroder Global Equity may lag during momentum-driven markets, when valuations become detached from fundamentals, but they viewed this as a sign of its disciplined process rather than a weakness.
Other actively managed funds posting strong long-term returns for a lower OCF are Invesco Global Ex UK Enhanced Index (UK) and Allianz Best Styles Global AC Equity.
Investors pulled more than £2bn from UK-focused equity funds in the first half of 2026. Here are the most-affected funds.
Just three UK equity funds attracted inflows of more than £200m in the first half of the year, according to data from FE Analytics, while 12 suffered significant outflows.
In this series, Trustnet looks at the most and least popular funds in different asset classes. Having previously looked at bonds and Asia specialists, here we turn to UK funds.
Overall, investors pulled more than £2bn from UK-focused equity funds in the first half of 2026, according to data from Calastone. The last time these portfolios attracted net inflows over a full calendar year was 2015.
This continued selling is evidenced by the number of funds (11) with outflows of more than £200m, as the table below shows.
abrdn UK All Share Tracker was the most-sold UK fund of the first half, with assets under management (AUM) dropping from £2.6bn to £2.1bn.
This is despite the UK market performing relatively strongly in the first six months of the year. Performance added £194m in the first half, with the abrdn fund in the top-quartile of the IA UK All Companies peer group during this time. This was not enough for some investors with a net £699m withdrawn from the fund year-to-date.
It was one of four passive funds on the list below, alongside Vanguard FTSE U.K. All Share Index Unit Trust, Halifax UK Equity Tracker and Scottish Widows UK Equity Tracker. The remainder were active strategies.
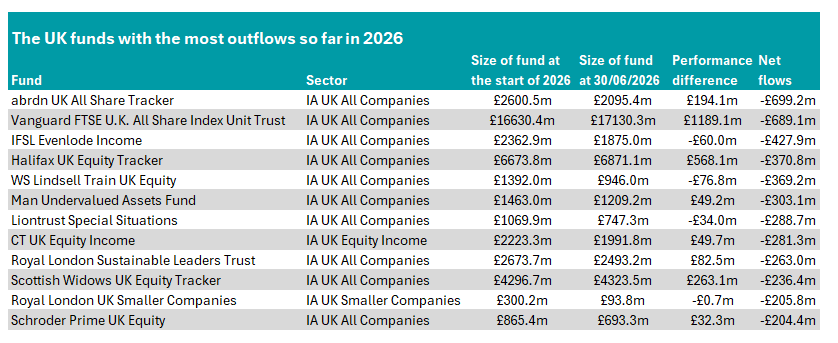
Source: FE Analytics
The most-sold active fund was IFSL Evenlode Income, which was one of three in the list above to make a loss in the first half of the year.
Managed by Hugh Yarrow and Chris Moore, the fund invests in quality-growth companies with high returns on capital and strong free cashflows, an area that has largely underperformed compared with value and growth stocks.
Analysts at AJ Bell said the managers have a clear investment philosophy high-quality businesses
"We believe investors benefit from the disciplined nature of the investment process, which the fund manager consistently adheres too. Additionally, the long-term nature of the approach is another compelling feature," they said.
The recent poor performance (the fund is now in the bottom quartile of the IA UK All Companies sector over one and three years) has led to outflows, however, with a net £428m pulled from the fund in the first half of 2026.
Two other funds in the table above have also made a loss so far this year. Liontrust Special Situations, run by FE fundinfo Alpha Manager Anthony Cross, Matthew Tongue and Victoria Stevens, has haemorrhaged money in the past few years.
In August 2023 the fund had assets under management of £4.5bn. Today the figure stands at £747m after another £289m in net outflows left the fund between January and July.
It is another quality-growth portfolio, using the team's 'Economic Advantage' process to look for companies with a clear edge where management is aligned with shareholders.
Titan Square Mile analysts have given the fund an 'AA' rating, noting that the fund's quality bias means it can structurally absent from certain sectors, so "performance should be expected to deviate from the index at times".
"The strategy has endured a relatively tough period of performance more recently, but we retain our conviction in what we see a high quality proposition, that should perform well longer term."
WS Lindsell Train UK Equity has been the worst performer so far this year of the group above, with a 15.6% loss in 2026. Investors removed a net £369m from the fund in the first half of the year, taking its AUM to under £1bn.
Alpha Manager Nick Train's portfolio retains the backing of analysts at Barclays Direct Investing, who pointed to the team's philosophy of buying high quality companies at the right price and holding them for a long time.
Elsewhere, CT UK Equity Income was the only fund on the list above from the IA UK Equity Income sector, while Royal London UK Smaller Companies was the sole entrant from the IA UK Smaller Companies peer group.
Turning to those garnering investors' money, there were only three with net inflows of more than £200m.
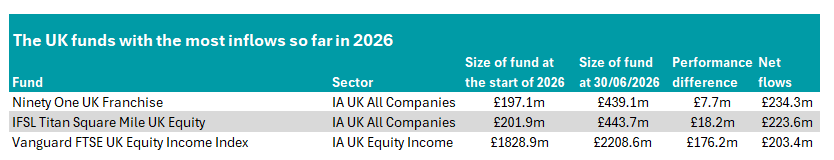
Source: FE Analytics
Ninety One UK Franchise was the top of pile, with £234m in net new money added in the first half of 2026, taking its AUM to £439m. In a similar range, a net £224m was added to IFSL Titan Square Mile UK Equity, taking its AUM to £444m. Both funds reside in the IA UK All Companies sector.
The largest on the above list is Vanguard FTSE UK Equity Income Index, which is housed in the IA UK Equity Income peer group.
Analysts at RSMR said this passive strategy offers investors exposure to dividend paying companies in the UK, with low costs and low intended tracking error.
"Investors can use this passive index as a core holding to gain exposure to dividend paying companies in the UK. This fund can be used in income or growth portfolios," they said.
From zero-commission trading to five-minute bets, parts of today’s financial system are increasingly designed to drive activity, not outcomes.
Financial markets remain one of the most powerful mechanisms for building long-term wealth. They are extraordinary for the ability to aggregate information, price risk and enable businesses to allocate capital to enable growth and innovation.
But something has changed and, increasingly, parts of the system appear designed less to improve investor outcomes than to increase activity. At times, they feel less like a place for disciplined investment and more like one specifically engineered to keep participants playing a game.
Markets are not casinos, they allow real businesses to raise real capital to do real things, but around that core function layers of activity have developed that look and feel much more like a casino than a stock exchange.
For advisers, the challenge is clear: how do you help clients build long-term wealth in a system that often nudges them to do the opposite?
Whose clock are we on?
Construction of the Sagrada Família cathedral began in 1882 and is finally being completed this year. This may seem like an unusual tangent, but when asked why it was taking so long, Antoni Gaudí is said to have replied: ‘My client is not in a hurry’.
This is a useful framing for investing, because this is not just about returns, it is about time and more specifically, whose clock we are following. Gaudí was clear in that response that he was not working to the city’s clock, the media’s clock, or anyone else’s. He was working to his client’s, in this case God’s, clock.
Most investors today are pulled between several clocks at once: markets, media, peers and their own anxieties. This means that elements of a long-term approach – quiet, patient and compounding – often struggle to compete.
From democratisation to gamification
However, that tension that investors feel is not accidental, it is increasingly structural. A decade ago, much of the industry set out to ‘democratise’ investing, with commission-free trading opening up markets to more people.
That sounded like progress, and in many ways it was, but what happens if you’re not paying for the product? As former Google engineer Andrew Lewis first quipped: ‘If you’re not paying for the product, you are the product’.
When trading is ‘free’, the business model does not vanish, it simply moves. In this case, instead of charging commission brokers sell the order flow to high-frequency traders.
That means platforms increasingly earn more when clients trade more. The result is a subtle but important change: the system increasingly rewards activity rather than outcomes.
What began as democratisation has, in parts, become gamification in the form of zero-commission trading, same-day options and bets measured in minutes rather than months.
These developments all share a common feature: they compress time horizons and encourage engagement. In 1960, the average holding period for a US stock was measured in years, by 2024 it had fallen to just months; that is a complete change in investor behaviour.
Designed for your instincts
This shift matters because these elements of gamification that are edging ever closer to mainstream financial markets interact with something deeply ingrained in all of us: basic human wiring.
The impulses that tend to undermine investment outcomes (fear, greed, recency bias and the desire to belong) are not character flaws, they’re adaptations that helped our ancestors to survive. In markets, however, they can be deeply unhelpful.
Other industries have long understood how to harness these instincts, with casinos as the obvious example: casinos are not designed despite human psychology, they are built to exploit it by using intermittent rewards and constant stimuli to keep participants engaged and active.
It’s difficult to ignore the parallels emerging in parts of today’s financial system, which increasingly rewards activity, because activity is visible, measurable and so often feels productive.
In investing, however, activity is rarely the driver of long-term outcomes that are instead built, more often than not, through patience, discipline and the ability to hold a course when the world feels unsettled.
Or, if we return to Gaudí, it depends on building cathedrals rather than playing in casinos.
Activity versus outcomes
This is where advisers are indispensable to their clients. Not as forecasters, because markets have a habit of humbling even the most confident predictions, but as stewards and behavioural buffers.
Advisers are the people who can help clients identify which clock matters and then remain aligned to it, which in practice can often mean doing less, not more.
It means helping clients recognise when decisions are being driven by emotion rather than evidence and questioning whether the incentives embedded in a product or platform are aligned with the client’s objectives.
It also means creating enough distance between the investor and the moment to allow better judgement to prevail. In a system that encourages engagement, good advice often involves restraint. While that may not sound dramatic, it does, however, have the advantage of being useful.
Cathedrals or casinos?
After more than 140 years of construction, the Sagrada Família has reached another major milestone this year, the final tower was completed and the Pope paid a visit. Its timeline reflects a very different set of incentives: ones aligned with endurance rather than immediacy.
Investing presents a similar choice: at its best, it remains a powerful mechanism for compounding wealth over time, but parts of the system are drifting towards something faster, more engaging, and arguably less aligned with client outcomes.
For advisers, the question is not whether those forces exist, but how to help clients navigate them, because, ultimately, the question worth asking is a simple one: are the incentives aligned with the client’s clock, or someone else’s?
Gaudí never saw the finished cathedral, but he trusted the design, and in investing the same principle applies. The goal is not to predict every twist and turn, but instead to build portfolios, plans and relationships that can withstand them. If you do it right, on the right principles, at the right pace, for the right clock, then you will have built something genuinely lasting for the clients who trusted you.
In the end that is the most important thing we can say: not that we predicted the future, but that we helped our clients live through it with clarity and confidence, whatever came. That is stewardship and it runs on the client’s clock.
Dan Brocklebank is head of Orbis Investments UK. The views expressed above should not be taken as investment advice.
Global stockpickers endured their second-worst six months since AJ Bell began tracking manager performance in 2021, though funds focused on Asia and emerging markets bucked the trend.
Just 42% of active funds beat their passive equivalents in the first half of 2026, unchanged from the same period in 2025, according to AJ Bell's latest Manager versus Machine report.
Asia Pacific ex Japan and global emerging markets funds performed best as 65% of active funds here outperformed passives over the six-month period, the strongest result since AJ Bell launched the report in 2021. Global emerging markets funds followed close behind, with 63% beating passives, a three-year high.
Dan Coatsworth, head of markets at AJ Bell, said: "Emerging markets and Asia Pacific ex Japan regions were among the best-performing parts of the investment universe. Their success was helped by a market rotation from the US mega-cap tech stocks spending big money on AI (i.e. most of the Magnificent Seven) to beneficiaries of this spend.
"Chip companies ruled the roost, including memory chip specialists who benefited from a demand spike in a supply-tight market. Many of the big chip stocks are Asian companies listed in Taiwan and South Korea."
Chipmakers were among the biggest gainers of 2026's opening half, with South Korea's SK Hynix rising 300% in the first half of 2026 and now accounting for around 8% of both the MSCI Emerging Markets and MSCI AC Asia Pacific ex Japan indices.
Global funds fared worst with only 22% of active funds beating passives, the second-worst period since the report began. UK active funds outperformed just 19% of the time.
"The data is a huge embarrassment for the active fund management industry. While a handful of global equity funds significantly beat passives and showed their managers were worth every penny, other players let the team down," Coatsworth said.
"The passive industry will be rubbing its hands with glee, waiting for more investors to give up on using active funds and replace them with tracker funds and ETFs in their portfolio."
Longer-term figures showed a similar pattern. Across the past 10 years, only 21% of active managers outperformed a passive fund, the lowest figure AJ Bell has recorded for this measure.
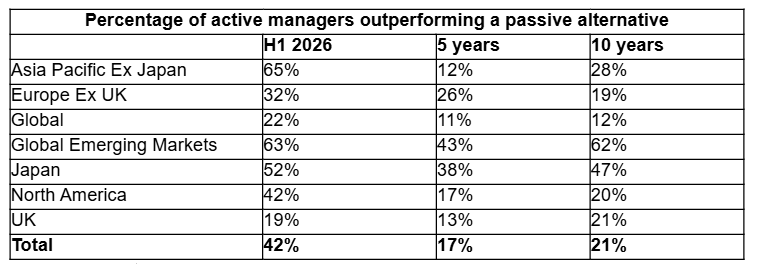
Source: AJ Bell, Morningstar. Total return in sterling to 30 Jun 2026
"Despite a few bright spots, active fund managers remain in the doldrums when looking across the market," Coatsworth added.
He attributed the weak global result partly to market concentration, noting that the 10 largest holdings in the MSCI World index account for 25.7% despite being made up of 1,283 constituents. "Any manager with less exposure to these blockbuster names than the global benchmark might have struggled to outperform," he explained.
Sector rotation weighed on UK, European and North American active funds, as areas that performed strongly in 2025, such as precious metals and mining, defence, and pharmaceuticals, lost momentum. The precious metals and mining sector, part of the FTSE 350, returned 251% in 2025 but fell 11% in the first half of 2026.
However, Coatsworth also said the strong result for emerging markets funds was "not just a flash in the pan", pointing to long-term data that showed a similar pattern of outperformance.
Lower inflation means people can get more money relative to the rising cost of living.
Savings rates offer the highest real rates in more than a year, according to data from Moneyfactscompare, after today’s inflation figures showed the pace of price increases dropped to 2.6% in June.
In contrast, the Moneyfacts Average New Savings Rate is at 3.59%, around 1 percentage points ahead of inflation – the largest gap since March 2025.
The average savings account has moved from paying 0.34 percentage points below inflation last September to 0.99 percentage points above inflation today, a swing of more than 1.3 percentage points.
Adam French, head of consumer finance at Moneyfactscompare, said: “While the cost of living continues to weigh on household budgets, the latest inflation figures provide some small relief, especially for savers.
“For many savers, what matters most isn't whether savings rates rise or fall in isolation but whether they stay ahead of inflation and, as things stand, they are doing just that, allowing many households to preserve or grow their purchasing power."
There are currently 1,960 savings accounts that beat inflation, including 284 easy-access accounts and 412 fixed-rate ISAs. This is up from 1,825 savings accounts that beat inflation last month.
This gives many savers “plenty of opportunity to shop around for the best deals and grow the real value of their money,” said French.
The difference between an average account and one of the market-leading deals can amount to more than £140 on a £10,000 balance over a year, he noted, with the top easy-access savings account from Revolut paying 5%.
However, earlier today, experts warned that inflation may not stay subdued for long, a sentiment that French agreed with, noting that price rises could creep higher over the coming months.
“Any subsequent increase in inflation will squeeze household budgets further and reduce the real value of savings unless providers continue to offer competitive returns,” he said.
“This fresh uncertainty may make the top-paying easy access savings accounts a more attractive option. These accounts offer the flexibility to access funds should they be needed in the face of rising living costs and those willing to shop around can take advantage of any further increases in savings rates if providers respond to changing inflation and interest rate expectations.
“In uncertain and increasingly volatile economic times, maintaining both competitive returns and financial flexibility is likely to be a priority for plenty of households,” he concluded.
Chandan Khanna joins the firm from Eighteen48 Partners.
William Blair Investments has launched a new Global Leaders Select Strategy following the appointment of Chandan Khanna.
The new strategy will combine the firm’s global equities capabilities with Khanna’s investment approach. This combination will result in a portfolio of 25-30 high-quality global companies with durable growth.
It will be benchmark-agnostic and aims to deliver strong long-term returns for investors through conviction, concentration and compounding.
Khanna will run the fund alongside Hugo Scott-Gall, partner and head of William Blair’s global equity team.
The new fund will sit among William Blair’s Leaders platform, a series of actively managed equity portfolios that includes the Emerging Market Leaders, International Leaders and Global Leaders strategies.
Scott-Gall said: "[Khanna’s] appointment and the launch of Global Leaders Select reinforces our commitment to delivering active, research-driven strategies that uncover opportunities across global markets."
Acadian will replace Ninety One in the fund after a period of weak performance.
St. James’s Place (SJP) has dropped Ninety One from its £894m SJP Worldwide Income fund in favour of Acadian Asset Management as it pivots the approach to systematic investing.
Changes to the fund, which is to be renamed SJP Global Equity Income, aim to produce better long-term returns, improve diversification and add value, the firm said.
Acadian will use an active systematic investment approach, combining data-driven models with human oversight. As part of this change in process, the fund will move from a concentrated 30-stock portfolio to one with around 500 underlying holdings.
The ongoing charges figure (OCF) has also been reduced by 30 basis points.
SJP Global Equity Income has languished in the fourth quartile of its LF Global Equities peer group over one, three five and 10 years, having produced bottom-quartile results in each of the past three calendar years. It is on course to do so again so far in 2026.
Justin Onuekwusi, chief investment officer at SJP, said: “These changes reflect our commitment to continuously evolve our investment approach to deliver long-term outcomes for clients.
“By combining a more diversified portfolio with a systematic, data-driven process, we believe the fund is positioned to provide a consistent level of income while managing risk effectively. The reduction in ongoing charges is also an important step in improving value for clients.”
Energy costs dropped sharply following the ceasefire between the US and Iran.
UK inflation dropped to 2.6% in June, down from 2.8% in May, according to data from the Office for National Statistics (ONS).
Much of this fall was a result of falling petrol and diesel prices as energy costs dropped sharply following the ceasefire between the US and Iran – although tensions have re-escalated since.
Grocery inflation has slowed to its weakest rate since December 2024, while services inflation, closely watched by central bankers as a gauge of underlying price pressures, eased from 3.7% to 3.6%.
However, most agreed that this drop could be short-lived, with inflation expected to rebound in the coming months due to renewed escalation in the Middle East and a rise in the energy cap taking place next month.
Felix Feather, economist at Aberdeen Investments, said: “June’s inflation data offers some welcome relief for policymakers. However, this relief is likely to be fleeting. Household energy bills have yet to fully reflect this summer’s energy price shock and the increase in the Ofgem price cap will push inflation higher again in the months ahead.”
Earlier this week, new prime minister Andy Burnham announced that VAT on household electricity bills will be scrapped from October, but this proposal will come too late to stave off inflation over the summer, he noted.
“And when it does arrive, the difference it will make to the inflation outlook will be almost negligible – around 0.1 percentage point off the headline rate,” said Feather.
He was not alone in warning that the latest reading will prove temporary. George Brown, senior economist at Schroders, noted that oil prices have already started to rally again, while JP Morgan Personal Investing’s Scott Gardner noted that the July energy price cap rise will also start to feed into the data.
The JPM investment specialist suggested that the Bank of England will be watching closely to see if there is a renewed energy-driven spike in inflation, while, for households, cost-of-living pressures are likely to remain a challenge in the second half of the year.
Feather expects inflation to rise back above 3% between now and the end of the year, adding that it is “likely to remain above the Bank's 2% target for some time yet”.
“As the temporary impact from higher energy costs fades over 2027 and 2028, inflation should resume drifting lower. Of course, if the energy cost shock does not unwind, inflation would follow a higher-for-longer path.”
Brown added that markets are currently pricing in more than two rate hikes over the next year, although he said that the crucial question is whether this remains an energy shock or becomes a domestic inflation problem.
“So far, a cooling labour market suggests there is little risk of the sort of second-round effects that would warrant tighter monetary policy,” he said.
“We think the Bank can stay on hold as it gauges whether the latest energy shock is just a temporary bump in the road or something more persistent.”
The next Bank of England interest rate decision is scheduled for Thursday 30 July.
Trustnet reveals the defensive model portfolios that have made the highest returns over the past decade.
Schroders, EPIC Investment Partners and Quilter's WealthSelect range have taken the top spots across the three defensive model portfolio sectors over the past decade, Trustnet research has found.
We've grouped the six FE fundinfo model portfolio service (MPS) sectors into two broad categories: defensive and growth. The defensive group covers the UK MPS 0%-15% Growth, UK MPS 15%-30% Growth and UK MPS 30%-45% Growth sectors, where growth assets, mainly equities, make up less than 45% of the portfolio.
The UK MPS 30%-45% Growth sector holds cautious to balanced portfolios, with a meaningful equity allocation, though bonds and other defensive holdings still make up the larger share. In the 15%-30% Growth sector, portfolios are cautious, with some equity exposure but still weighted heavily towards bonds and defensive assets, while the very defensive portfolios in the 0%-15% Growth sector sit mostly in bonds, cash and other lower-risk assets, with minimal equity exposure.
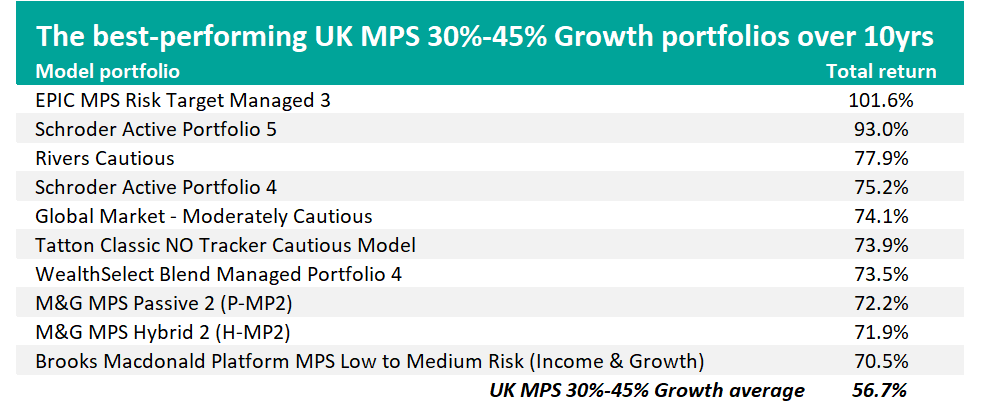
Source: FinXL. Total return in sterling between 1 Jul 2016 and 30 Jun 2026.
EPIC MPS Risk Target Managed 3 leads the sector with a 101.6% total return, nearly double the peer group average of 56.7%. Managed by Simon Newell, the portfolio aims for long-term capital growth from a globally diversified multi-asset mix, targeting above-average returns for its risk level.
As at its most recent factsheet, dated May 2026, the portfolio held 44% in fixed income, 33.2% in equities, 10.5% in 'uncorrelated' strategies, 6.7% in commodities and 5.6% in cash.
Its largest holdings included iShares £ Corporate Bond 0-5yr UCITS ETF, SPDR Bloomberg Global Aggregate Bond ETF and Vanguard FTSE 100 UCITS ETF, alongside Jupiter Gold & Silver and Aspect Diversified Trends for diversification away from mainstream markets.
In second place is Schroder Active Portfolio 5, up 93% over the decade. It sits in the middle of Schroders' nine-strong Active Portfolio range, targeting risk level 5 with an average volatility of 50%-65% of global stock markets over a rolling five-year period. It is managed by Philip Chandler and Ryan Paterson.
Rather than holding underlying funds directly, the portfolio invests through a layer of Schroders' own regional and strategy-specific model portfolios, including Schroder Active Asset Allocation Portfolio, Schroder Alternative Portfolio and Schroder's regional equity portfolios for North America, the UK, Europe, Japan and emerging markets.
Its overall asset mix is 51.2% in equities, 23% in alternative and other strategies, 20.5% in bonds and 5% in cash. Within the equity sleeves, Artemis US Select and JPM US Equity Income are among the largest named holdings.
Third is Rivers Cautious, with a 77.9% return. Run by Rivers Capital Management, the portfolio targets modest long-term returns above inflation at controlled volatility, built from what the manager calls 'Anchors', 'Enhancers' and 'Diversifiers': low-risk capital preservation holdings, return-seeking but more volatile assets and low-correlation diversifiers respectively.
As at 30 June 2026, the portfolio held 58% in Anchors, above its 43% strategic target, with 28% in Enhancers and 14% in Diversifiers (both below strategic targets), reflecting a defensive tactical stance. By asset type, government bonds made up the largest single slice at 36%, followed by developed market equities at 22% and low-volatility absolute return strategies at 14%.
Its largest holdings included iShares UK Gilts All Stocks Index, AXA Global Short Duration Bonds and Aegon Absolute Return Bond.
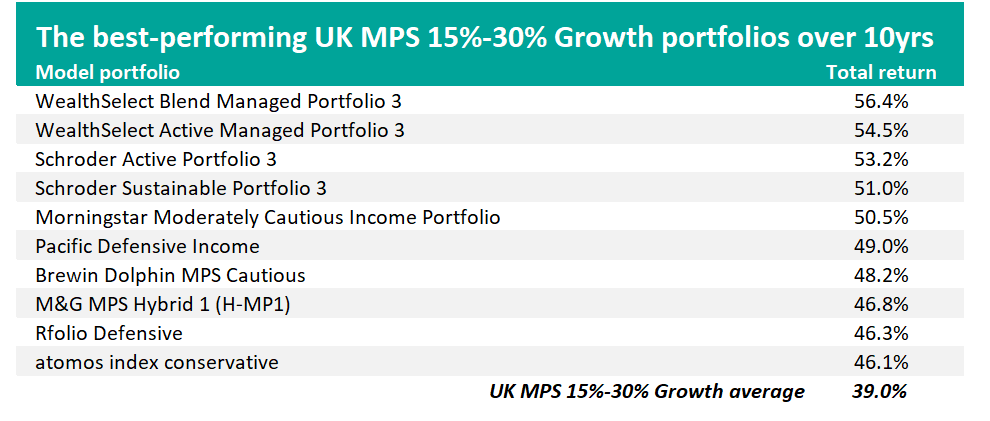
Source: FinXL. Total return in sterling between 1 Jul 2016 and 30 Jun 2026.
Leading the UK MPS 15%-30% Growth sector is Quilter's WealthSelect Blend Managed Portfolio 3, up 56.4% over the decade versus 39% from its average peer.
It's one of eight risk-graded portfolios in Quilter's WealthSelect range, run by Stuart Clark, Helen Bradshaw and Bethan Dixon. It targets volatility of 25%-35% of global equities, a notch below the risk band the 30%-45% sector portfolios sit in.
According to the most-recent factsheet, the portfolio held 44.9% in fixed interest, 27.9% in alternatives, 14.5% in developed market equities ex UK, 6.2% in cash, 4.8% in UK equities and 1.7% in emerging markets, as at 31 May 2026.
As the 'Blend' in its name suggests, it mixes active and passive funds: its single largest holding is iShares North American Equity Index, sitting alongside active bond funds such as Aviva Investors Global Sovereign Bond and Quilter Investors Corporate Bond.
Second is WealthSelect Active Managed Portfolio 3, up 54.5%. It shares the same managers, risk target and near-identical asset allocation as the Blend version above, differing mainly in fund selection.
Where the Blend range leans on index trackers for parts of its equity exposure, Quilter's eight-strong Active model portfolios use actively managed funds, among them Quilter Investors US Equity Income and Quilter Investors North American Equity.
Third is Schroder Active Portfolio 3, up 53.2%. Like Active Portfolio 5 covered in the 30%-45% sector, it's managed by Philip Chandler and Ryan Paterson and built from Schroders' own regional and strategy building blocks.
It sits two risk levels lower, targeting volatility of just 30%-45% of global equities and its asset mix reflects that: 44.6% in bonds, 27.4% in equities and 22.9% in alternatives and other strategies, with 5% in cash. The Royal London International Government Bond fund was its largest single holding, at 30.4%, well ahead of the Schroder Active Asset Allocation Portfolio at 20.4%.
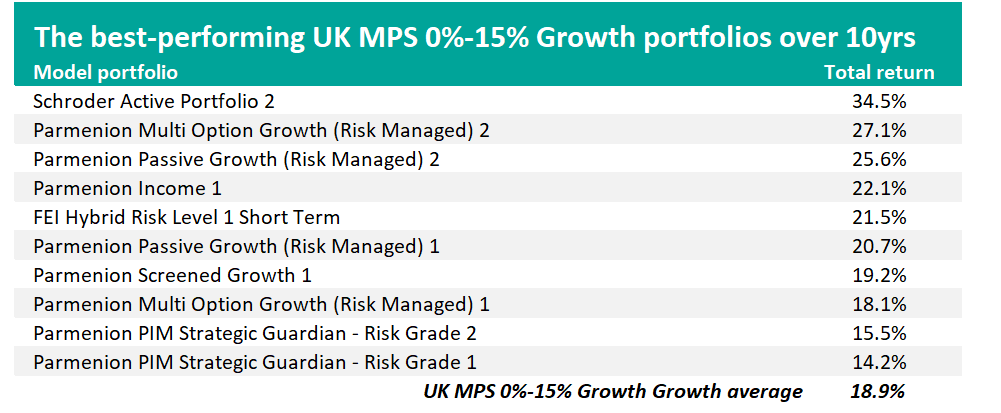
Source: FinXL. Total return in sterling between 1 Jul 2016 and 30 Jun 2026.
Schroder Active Portfolio 2 is at the top of the UK MPS 0%-15% Growth sector, with a 34.5% return against the 18.9% average. It's the lowest-risk portfolio in Schroders' nine-strong Active range, targeting volatility of just 15%-30% of global equities and, like its stablemates, is built from Schroders' underlying building-block portfolios.
The portfolio currently comprises 46.9% in bonds, 18.1% in equities, 17.6% in cash and 17% in alternatives and other strategies. Its largest single holding is Royal London International Government Bond, followed by Royal London Short Term Money Market.
Second and third are both from Parmenion: Multi Option Growth (Risk Managed) 2, up 27.1%, and Passive Growth (Risk Managed) 2, up 25.6%.
Both sit within Parmenion's risk-graded ranges, running from risk grade 1 to 10, with each grade holding a different mix across 14 core asset classes.
Multi Option allows advisers to choose active or passive funds asset class by asset class, while Passive Growth invests entirely through index-tracking funds selected by Parmenion's own due diligence process.
Parmenion runs eight of the 10 MPS in the table above, but this is largely a function of the sector's composition. There are 21 model portfolios in this peer group and Parmenion manages 17 of them.
Strategies from AXA, Ninety One and more attracted over £200m in inflows.
Sterling bond investors navigated a volatile first half of 2025, with gilt yields hitting record highs amid ongoing political uncertainty at home and geopolitical tensions abroad.
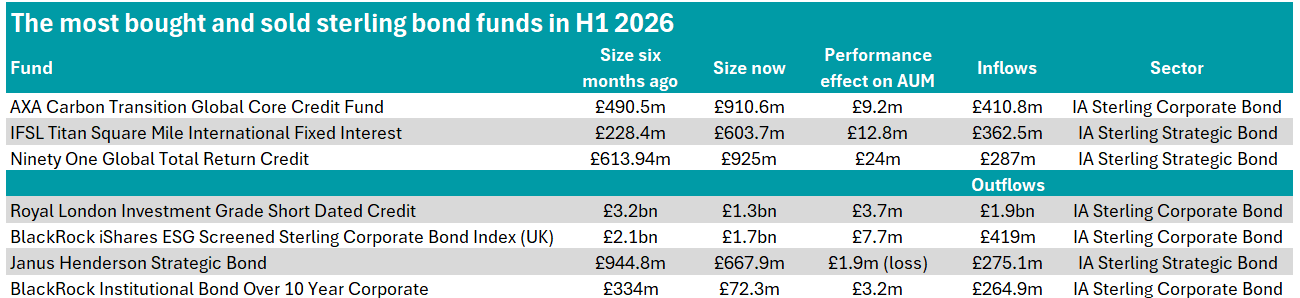
Despite the turbulence, investors continued to seek out opportunities in funds across the sterling bond sectors in the first half of the year, with such funds attracting £2.3bn between January and July.
As part of an ongoing series, Trustnet looked at which funds across the sterling bond Investment Association sectors attracted over £200m in net new money and which lost over £200m.
As shown in the table below, no funds in the IA Sterling High Yield sector met these thresholds.
Source: FE Analytics
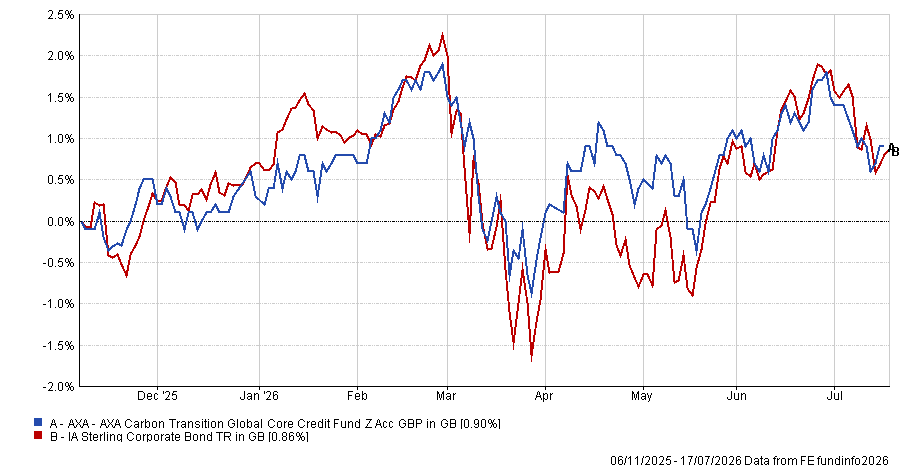
The largest inflows across all sterling bond sectors went to AXA, as the AXA Carbon Transition Global Core Credit Fund attracted almost £411m of net new money. Performance added a further £9.2m, lifting assets from £490.5m at the start of the year to £911m by the end of June 2026.
Managed by Charles Fianko, with Lionel Pernias as deputy, the strategy aims to generate income and capital returns in line with the ICE BofA Global Corporate Index, while contributing to the global transition to net zero.
This secondary climate-related goal means the fund invests in larger, commonly held issuers demonstrating credible commitments to achieving net zero by 2050 or reducing carbon intensity in line with that trajectory.
Otherwise, at least 80% of assets are invested in global investment-grade corporate bonds, denominated in sterling, euros, Australian dollars, Canadian dollars or US dollars and hedged back to sterling.
Performance of the fund vs sector over 5yrs
Source: FE Analytics
The next largest inflows came from IFSL Titan Square Mile International Fixed Interest, which attracted £363m of net new money and gained just shy of £13m from performance, bringing assets to £604m.
The strategy, which was launched at the end of 2024 and has an ongoing charges figure (OCF) of 0.55%, targets increases in value over at least five years through capital growth and income, investing across investment-grade and sub-investment grade bonds without fixed limits, meaning exposure to higher-risk credit can be significant at times. Up to 20% of the portfolio may be invested in equities, alongside warrants and money market instruments.
Over the full year to the end of June 2026, the fund returned 5.3%, placing it in the second quartile of the IA Sterling Strategic Bond sector.
Ninety One Global Total Return Credit also attracted substantial inflows, pulling in £287m. Co-managed by FE fundinfo Alpha Manager Justin Jewell and Darpan Harar, the fund also carries an FE fundinfo Crown Rating of five.
It aims to deliver total returns over a full credit cycle, targeting Overnight SONIA +4% before fees over rolling five-year periods. It invests across global credit markets without constraints on currency, credit rating, issuer type, coupon structure or duration.
Since launching in 2022, Ninety One Global Total Return Credit’s calendar year returns have fluctuated between the second and third quartile but it ranked in the first quartile for the first half of 2026.
The strategy has previously been suggested as a complementary holding alongside Fidelity Global Dividend, due to its ability to provide a yield without the price volatility and pay-out risks when equity markets are down.
On the outflows side, Royal London Investment Grade Short Dated Credit logged the most significant withdrawals by a wide margin, recording £1.9bn in outflows. Performance added back £3.7m, reducing overall assets from £3.2bn to £1.3bn over the six-month period.
Managed by Alpha Manager Paola Binns, with Matthew Franklin as deputy, the fund aims to outperform the ICE Bank of America Merrill Lynch 1–5 Year Sterling Non‑Gilt Total Return Index by 0.25% over rolling three‑year periods.
At least 80% of assets are invested in sterling‑denominated investment‑grade bonds, with 70% in short‑dated issues maturing within five years.
The strategy also applies an ethical screen excluding certain sectors and seeks to exploit inefficiencies in credit markets by investing outside the benchmark when attractive opportunities arise. Its shorter‑duration profile makes it less sensitive to interest‑rate movements. It was one of the most bought funds in 2025.
RSMR analysts said: “The fund will perform strongly in periods of stable but rising rates relative to longer duration options.
“It has a quality bias, being investment grade, so has more defensive outlook and will do well when rates are high and stable – it will also perform well in periods when inflation is elevated or uncertain because inflation hurts fixed cash flows and SD bonds can reprice sooner.”
They added that the strategy can serve as a core element of a diversified fixed‑interest portfolio or as a standalone defensive holding for investors with lower volatility budgets.
Performance of the fund vs sector over 5yrs
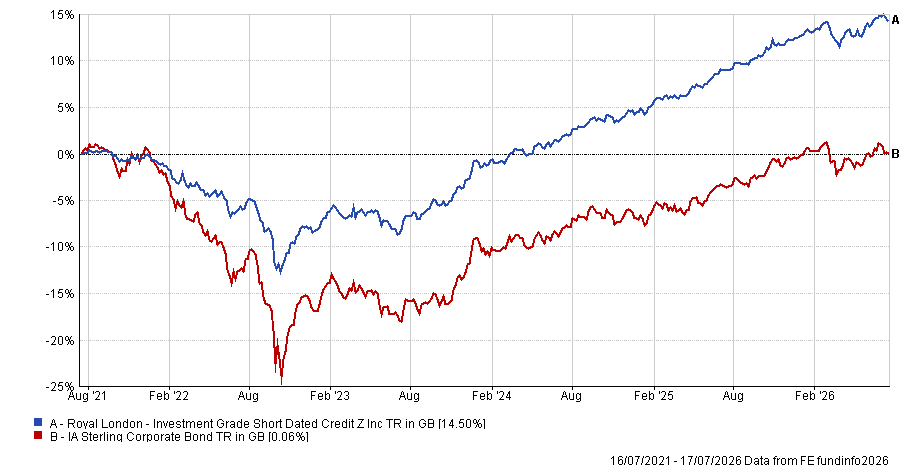
Source: FE Analytics
Meanwhile, Janus Henderson Strategic Bond was the only fund from the IA Sterling Strategic Bond strategy to record outflows above £200m, with investors withdrawing £275m over the first half of the year.
It was also the only fund in the table where performance detracted, as it lost almost £2m, while total assets fell from £945m to £668m over the assessed period.
Co‑managed by Jenna Barnard and Nicholas Ware, the fund aims to outperform the IA Sterling Strategic Bond sector average over any five‑year period, investing globally across government and corporate bonds of all qualities, while currency exposure from non-sterling assets is substantially hedged.
It currently holds 196 positions with an average duration of 5.5 years, with most holdings rated as ‘BAA’ (25.3%) or ‘AA’ (23.2%).
Janus Henderson Strategic Bond is built around long-term thematic investing, currently focusing on structural themes such as demographics, technology and globalisation.
RSMR analysts said the fund’s flexible strategy is designed to perform across a wide range of economic, monetary and fiscal environments and that its global mandate and ability to allocate across investment grade, high yield, loans and derivatives provides a broad opportunity set.
“The fund will still face challenges when interest rates rise, inflation is elevated or corporate profitability weakens,” the analysts added.
“At such times, the managers aim to mitigate downside risk through active duration management and selective credit exposure.”
The other funds in the table that logged outflows higher than £200m over the six months are both from the IA Sterling Corporate Bond sector and run by BlackRock: BlackRock iShares ESG Screened Sterling Corporate Bond Index (UK) and BlackRock Institutional Bond Over 10 Year Corporate.
The real estate sector is not static. It is constantly reshaping itself around the needs of the modern economy.
Listed real estate, in the form of stock exchange-quoted property companies and real estate investment trusts (REITs), has spent much of the past three years in the investment wilderness.
Weaker bond prices, rising interest rates, concerns about office and shopping space demand, and competition from higher-yielding cash, as well as for infrastructure and technology investment opportunities, have created challenging conditions.
Some stalwarts of the sector have become synonymous with structural decline, particularly following the post-pandemic reassessment of commercial property.
Yet beneath the headlines, a different picture is emerging. Across many segments of the real estate market, fundamentals have strengthened materially while valuations remain subdued.
This divergence raises an important question: could listed real estate be one of the most mispriced asset classes in today's market? The answer depends on whether investors are focusing on short-term narratives or long-term economics.
Looking beyond the office debate
One of the biggest misconceptions about listed real estate is that it remains heavily dependent on traditional office buildings. The composition of global REIT markets has evolved significantly over the past two decades.
Global REIT Index Composition – 2006 vs 2026
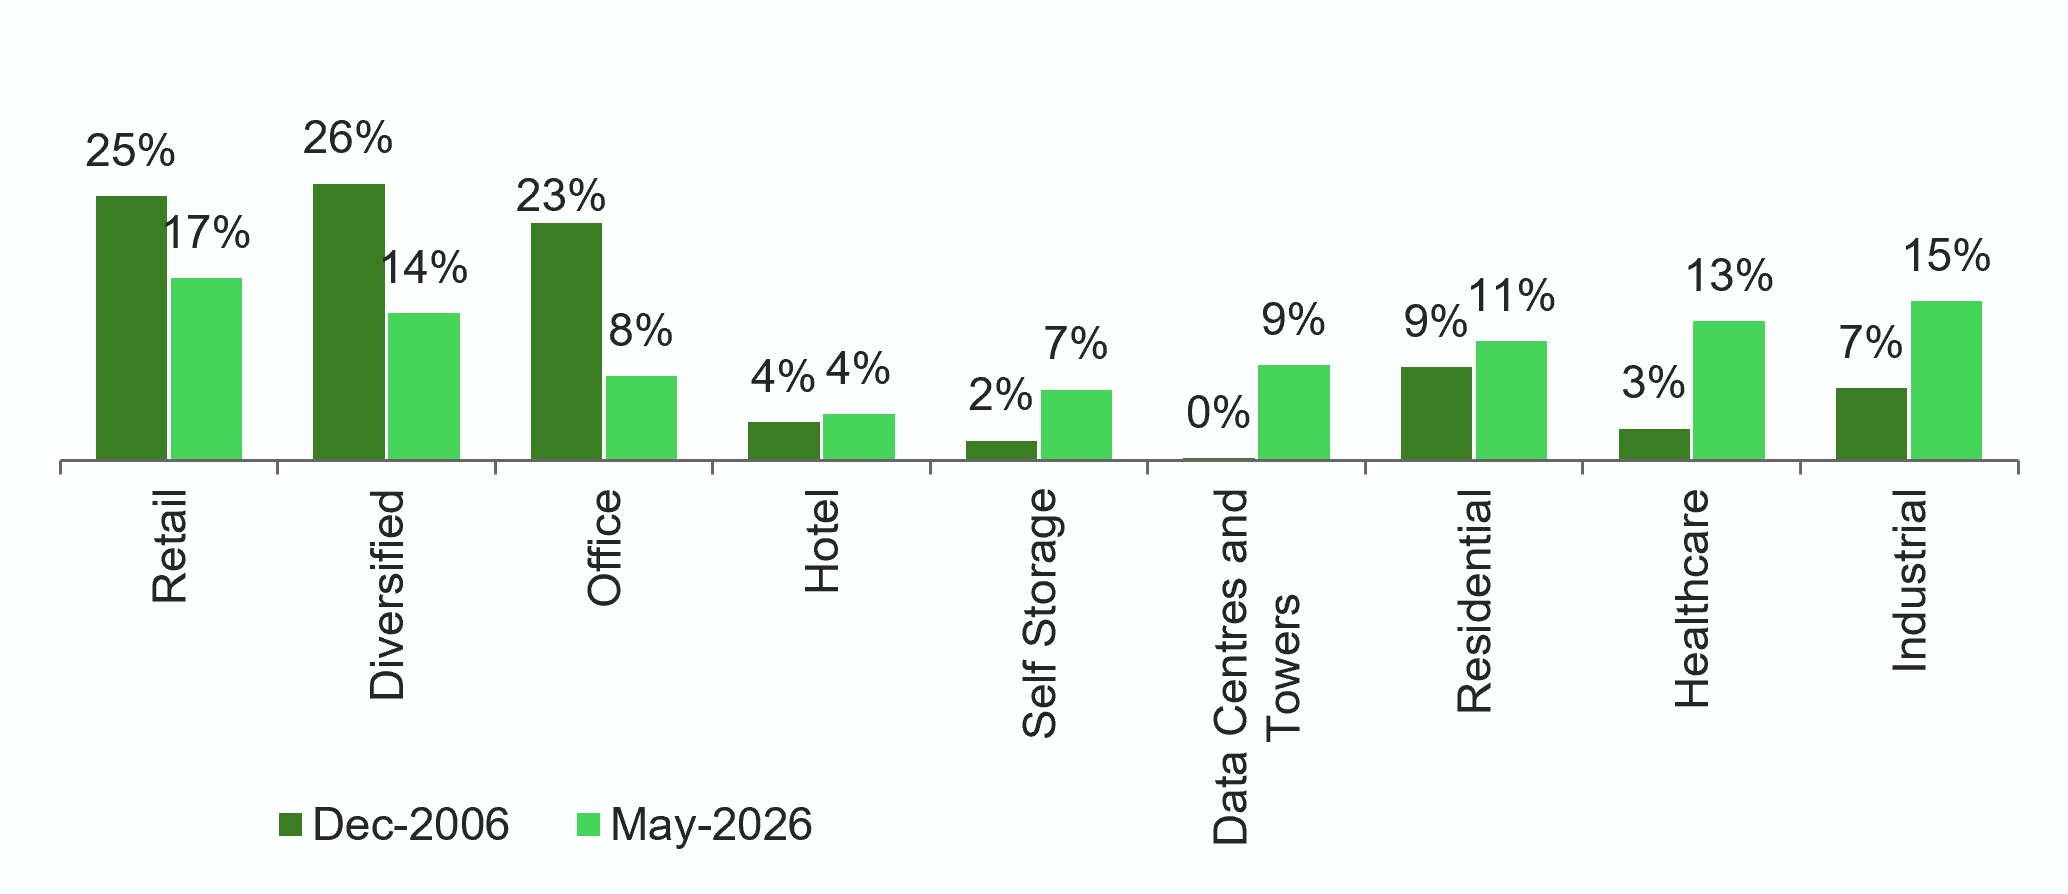
Source: Bloomberg
The sector has steadily shifted away from areas facing structural challenges and towards parts of the economy benefiting from long-term growth trends.
Today, data centres, logistics facilities, residential housing and healthcare property account for a growing share of the global listed real estate universe.
This evolution reflects a simple principle. Real estate ultimately houses economic activity in virtually every shape and form. As economies change, commercial property markets adapt alongside them.
The rise of e-commerce created demand for logistics facilities. Demographics matter and the ageing population in many developed countries has increased the need for healthcare and senior housing. The rapid growth of digitalisation and artificial intelligence is driving unprecedented demand for data centres.
The real estate sector is not static. It is constantly reshaping itself around the needs of the modern economy.
The supply story investors may be overlooking
While much attention has been paid to demand trends, supply dynamics may be even more important for future returns. Apart from data centres, where demand is at extreme levels and tenants are seemingly rent insensitive, across many developed markets and sectors, new commercial real estate construction has slowed dramatically.
Higher interest rates, elevated financing costs and rising construction expenses have not been offset by commensurate rental growth. Consequently, many development projects are economically unattractive. In other words, developers simply cannot achieve returns that justify starting new projects.
More importantly, this supply restraint is occurring at a time when occupancy rates remain relatively high and there is evidence of growing tenant demand, particularly for better-located, higher-quality properties.
The result is a mismatch between available space and ongoing tenant demand.
For existing property owners, this creates an increasingly favourable backdrop. When little new space is being delivered, landlords gain pricing power in new lease negotiations. With low vacancy rates likely to persist, rental growth can accelerate and cashflows become more resilient.
These dynamics are visible across a range of sectors, including logistics facilities to residential and seniors housing as well as prime retail assets.
The valuation disconnect
Perhaps the most compelling aspect of the current opportunity lies in valuation. Unlike many other asset classes, real estate offers investors a tangible reference point for assessing intrinsic value: replacement cost.
Replacement cost reflects what it would cost to acquire land and construct an equivalent asset today. While it is not a perfect measure, it provides a useful anchor for long-term valuation.
In many markets, listed real estate companies are currently trading at or below estimated replacement cost. In practical terms, investors can buy existing, income-producing assets through public markets for less than it would cost to build them from scratch.
Historically, this has been an unusual situation. When listed property trades at a premium to replacement cost, developers are incentivised to build new assets, eventually increasing supply and moderating returns. Conversely, when assets trade below replacement cost, development activity tends to stall because building becomes uneconomic.
That appears to be the environment today. The combination of subdued valuations and limited new supply creates a potentially powerful setup for future returns for REITs, particularly underpinning stronger rental cashflows and consequent dividend growth.
Stronger balance sheets than many assume
Another legacy misperception is that listed property companies are excessively leveraged and therefore vulnerable to higher interest rates.
While this concern may have been justified during previous cycles, many listed real estate companies entered the recent period of rising rates with significantly stronger balance sheets than in the past.
Over the past decade, many REITs have reduced leverage, extended debt maturities and diversified funding sources. Access to public debt markets has allowed many companies to maintain investment-grade credit profiles and avoid excessive dependence on bank lending.
As a result, the sector has generally proven more resilient than many investors anticipated.
In fact, some REITs have recently been repurchasing their own shares, reflecting management teams' belief that public market valuations fail to reflect underlying asset values.
Furthermore, we are beginning to see an increase in M&A activity within the sector, which again highlights that management sees better value in joining with or acquiring rival REITs than in buying real estate directly.
A changing opportunity set
None of this suggests that every real estate segment will prosper equally. Property remains a highly local and asset-specific business.
Location quality, tenant demand, infrastructure access and changing consumer behaviour all matter enormously. Some assets will continue to face structural challenges, particularly where oversupply or weak demand persists.
However, broad-brush assumptions about the entire sector may no longer reflect reality.
Today's listed real estate market includes some of the facilities underpinning digitalisation, some of the housing required to support demographic change, and some of the physical assets enabling modern commerce.
At the same time, many companies are trading at valuations that imply significant pessimism despite relatively healthy operating fundamentals.
Markets are often efficient over the long term, but they are not always efficient in the short term. When sentiment becomes detached from fundamentals, opportunities can emerge.
For investors willing to look beyond recent headlines, listed real estate may represent one of the more interesting opportunities of that disconnect today.
Andrew Parsons is co-portfolio manager of the Nedgroup Investments Global Property fund. The views expressed above should not be taken as investment advice.
Mid-cap and income specialists have rebounded sharply year-to-date.
IA North America funds focusing on small- and mid-caps or on unloved value stocks have rocketed back to the top of the leaderboard in 2026 having spent much of the past decade in the doldrums.
US large-cap growth stocks have been the place to invest over the past decade, with the S&P 500 up 304.8% over 10 years. But the tide has turned so far in 2026.
Mid- and small-caps, represented by the Russell 2500 index, have made 24.1% over six months, more than double the 11.5% made by the S&P 500 index.
This partly reflects the subdued returns from the mega-cap US tech names, with the Magnificent Seven underwhelming in recent months as the market has moved on from the hyperscalers to a broadening out of the AI theme.
This has boosted specialists in the mid-cap space, which have enjoyed the double whammy of a broadening market and a strong US economy, which remains resilient despite an unstable geopolitical backdrop.
As a result, funds focusing on the lower end of the market capitalisation spectrum dominate the table below, which looks at portfolios that have struggled over the past decade but are rebounding strongly in 2026 so far.
The iMGP US Small & Mid Company Growth fund is the top performer amongst the group, up 24.8%, but it is far from alone. In total, six mid- and small-cap specialists populate the 14-strong table below.
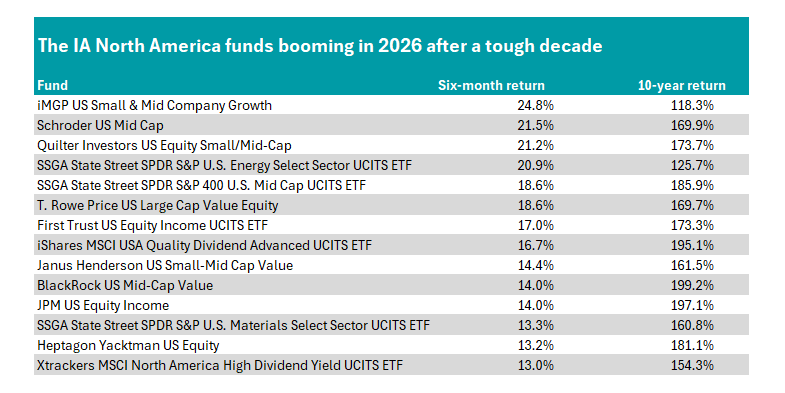
Source: FE Analytics
Schroder US Mid Cap is in second place, up 21.5%. It is one of two funds on the list rated by analysts, with RSMR backing the fund.
Its bottom-up approach focuses on companies with a market cap of between $750m and $10bn, giving managers Robert Kaynor and Joanna Wald a universe of 2,000 stocks, which they then split into three categories: steady eddies, mispriced growth and turnaround stories.
"The strategy prides itself on enabling investors to access a riskier asset class within North American equities at a lower level of risk," RSMR analysts said.
Analysts at the Fund Research Centre also rate the fund, noting it has a "well-established process" that provides investors with a "thoughtful approach to investing in mid- and small-cap companies from a well-resourced and experienced team".
Quilter Investors US Equity Small/Mid-Cap is third on the list with a 21.2% return so far in 2026. It is joined by SSGA State Street SPDR S&P 400 U.S. Mid Cap UCITS ETF, Janus Henderson US Small-Mid Cap Value and BlackRock US Mid-Cap Value as the other funds hunting in the small- and mid-cap arena.
The other clear turnaround story has been the rise of value. For example, T. Rowe Price US Large Cap Value Equity appears on the list having made 18.6% over the past six months.
Run by John Linehan and Gabriel Solomon, the fund invests in large businesses that are currently on discounted valuations relative to their historical average and/or the average of their industries.
Analysts at Vanguard said in their end of year review for 2025 that US value stocks could do well in 2026, as they had "yet to fully price in the potential long-term benefits of AI adoption".
"As AI diffuses across all sectors of the economy, value-orientated sectors such as industrials, financials and select consumer segments may be better positioned to realise efficiency gains and grow earnings, making them potentially more attractive in the medium term," they said.
This has proven the case, with the AI trade moving from hyperscalers to semiconductors and (latterly) to those involved in the build-out of data centres. On the flipside, traditional software companies have been hit hard as the market has priced them as AI losers.
Elsewhere, the outbreak of the Iran war led to an oil price spike after the Strait of Hormuz was closed, boosting energy stocks – a traditionally 'value' hunting ground.
This market rotation can also explain the prevalence of income strategies, which are often closely aligned to value funds as growth stocks do not tend to pay out dividends.
JPM US Equity Income makes the list and is a firm favourite among experts. It is included among Barclays Direct Investing's recommended list, with analysts noting it is a "reliable equity income product managed by an experienced portfolio management team".
Run by Clare Hart, Andrew Brandon and David Silberman, the fund looks for companies with durable business models, strong cashflows, consistent earnings and experienced management teams, all while targeting a dividend yield ahead of the S&P 500 over a full market cycle.
It also appears on the best-buy list of AJ Bell, where analysts said: "This disciplined, quality-based approach to investing in the US is a strong feature for investors seeking a differentiated approach compared to the standard S&P benchmark."
The fund was joined on the list above by passive income options First Trust US Equity Income UCITS ETF, iShares MSCI USA Quality Dividend Advanced UCITS ETF and Xtrackers MSCI North America High Dividend Yield UCITS ETF.
This is part of an ongoing series. Previously we have looked at the UK and Asia.
The ex defence secretary inherits a difficult fiscal picture.
John Healey has been appointed chancellor by prime minister Andy Burnham, a move that came as a surprise to markets, which had tipped Shabana Mahmood as the frontrunner for the role with Ed Miliband a distant second choice.
Healey, a former Treasury minister under Gordon Brown, becomes the UK's sixth chancellor in just over four years and was described by Oliver Faizallah, head of fixed income research at Raymond James as a "surprise pick".
“Going into the announcement, Mahmood appeared the near-certain choice, with Miliband viewed as a possibility but an outlier.”
Healey resigned as defence secretary earlier this year after the government failed to set out a roadmap for meeting NATO's target of defence spending reaching 3% of GDP by 2030. He now takes charge of a fiscal rule that requires debt to fall as a share of the economy by the end of the Parliament, leaving him to reconcile his own record of pushing for higher military spending with the constraints of the job he has just taken on.
Dan Coatsworth, head of markets at AJ Bell, said the market has read the appointment as a vote for continuity on defence.
“UK defence stocks motored higher on Healey's appointment, given his previous role in pushing Keir Starmer to agree to higher defence spending,” he said. “The market is taking the view that defence is close to Healey's heart, and he will drive through increased funding under his new role as chancellor.”
Shares in BAE Systems, Rolls-Royce, QinetiQ and Melrose all rise in early trade.
Susannah Streeter, chief investment strategist at Wealth Club, said the armed forces are likely to welcome the appointment for similar reasons. Having spent months making the case for higher military spending, Healey has a detailed understanding of the capability gaps facing the armed forces and may be more willing than his predecessor to set out a credible pathway to the 3% target, she said.
The bond market's initial reaction was more cautious. Gilt yields jumped yesterday afternoon after Burnham suggested there was some flexibility within the government's fiscal rules, before easing back once he clarified he would take no risks with the economy.
That leaves Healey with limited room to manoeuvre on tax, according to Coatsworth, particularly after Burnham used his first full day in office to confirm VAT on household electricity bills will be scrapped from October, a move funded by the cancellation of the digital ID programme.
Coatsworth called it “a quick win for the new team” – though, as he noted, the harder tax questions facing Healey are still to come.
“Healey knows bond markets won't allow him to make other tax cuts without saying how they'll be paid for,” he said. “Bond markets take no prisoners and they will be quick to protest if government policies are viewed as irresponsible.”
The fiscal picture he inherits already has a stealth tax problem attached to it.
Income tax receipts in June were almost 13% higher than the same month a year earlier, and 58% higher than in June 2021, according to Sarah Coles, head of personal finance at AJ Bell. The number of taxpayers has grown to 40.8 million, she said, and the average taxpayer now hands over £8,510 this tax year, up from £7,470 three years ago.
Burnham has floated revisiting the frozen personal allowance, but HMRC estimates every £100 increase costs around £1 billion, meaning a rise in line with inflation since the freeze could cost in the region of £35 billion.
“It's a difficult ask from Healey as he steps through the door to Number 11 and he might not want to gain an early reputation as a tax-hiking chancellor,” Coles said.
Shaun Moore, tax and financial planning expert at Quilter, noted how frequent turnover at the Treasury makes it harder to pursue a consistent long-term strategy and how repeated speculation of the kind seen before recent Budgets over pension tax-free cash can discourage long-term saving and investing, regardless of what is ultimately decided.
The reduction lowers the ongoing cost of one of Europe's most widely held ETFs by more than a quarter, extending a decade-long run of fee cuts across Vanguard's range.
Vanguard will cut the ongoing charges figure (OCF) on the Vanguard FTSE All World UCITS ETF from 0.19% to 0.14%.
The fee reduction of more than 25% will apply from 28 July 2026 and the firm estimates it will save investors about $37m a year.
The Vanguard FTSE All World UCITS ETF has attracted over $16bn in net inflows so far this year and, according to Vanguard, is Europe's largest FTSE All World ETF with assets under management of $76.8bn.
Jon Cleborne, head of Europe at Vanguard, said: "Investing through a globally diversified, low-cost and highly liquid single-ETF portfolio has just become even more attractive.
“As one of Europe's leading all-world equity ETFs, the Vanguard FTSE All-World UCITS ETF offers investors a simple way to access the growth potential of around 4,000 large- and mid-cap companies across global markets. This fee reduction reflects Vanguard's longstanding commitment to using the benefits of our scale to lower costs and improve outcomes for investors."
Vanguard said it offers the lowest-cost UCITS ETF range in Europe on an asset-weighted basis. Following the latest cut, the average asset-weighted expense ratio across its European equity and fixed income ETF range will stand at 0.11%.
The latest reduction means Vanguard has lowered fee across its European mutual fund and ETF range more than 80 times over the past decade. The firm estimated that total investor savings from cuts made over the past 24 months now exceed $80m.
Strategies from JPMorgan, Goldman Sachs and more have posted top quartile returns over consecutive years.
The past few years have not always been easy for UK and European equity funds, but for a small group of them, consistence has been the defining characteristic regardless of what markets threw at them.
In this Trustnet series, we have identified funds that delivered first-quartile returns consecutively from 2023-2025 and have done so again in the first half of this year.
This article looks at the IA UK All Companies, IA Europe Including UK and IA Europe Excluding UK sectors.
IA UK All Companies
Starting with the UK market, the three funds in the table below met the performance criteria.
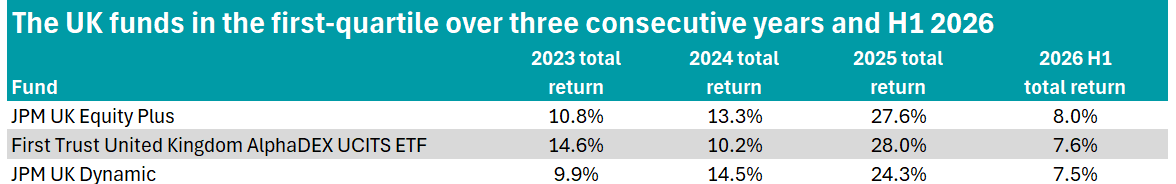
Source: FE Analytics
The strongest performer in the first half of 2026 was the JPM UK Equity Plus strategy, which gained 8% over the six months.
At £719.7m, it carries an FE fundinfo five-Crown Rating and is co-managed by FE fundinfo Alpha Manager Anthony Lynch alongside Callum Abbot. The strategy aims to provide long-term capital growth using both direct equity investments and derivatives and employing a bottom-up stock selection process alongside a blend of fundamental research and quantitative analysis.
Unlike its sister strategy – JPM UK Equity Core – JPM UK Equity Plus can short stocks deemed less attractive, allowing the managers to increase conviction in other stocks without increasing net market exposure.
Top holdings in the portfolio currently include HSBC (9.2%), AstraZeneca (7.8%) and Shell (7%).
JPM UK Equity Plus has been previously highlighted by Trustnet for managing to largely keep out of the bottom quartile. Earlier this year, it was also added to Bestinvest’s Best Funds list.
RSMR analysts said that the fund “could be used as a core proposition for a UK allocation, with investors gaining exposure to a strong performing team who can use more tools than a traditional fund”.
The only other actively managed fund to qualify from the IA UK All Companies sector also comes from JPMorgan.
JPM UK Dynamic is the smaller of the two at £384.1m but it matches its stablemate for pedigree, carrying a five-crown rating and an Alpha Manager, Blake Crawford, among its management team, alongside Jonathan Ingram and Victoria Helvert.
While many of its top holdings overlap with JPM UK Equity Plus, the top end of the portfolio also carries a more cyclical flavour, with Rolls-Royce and Rio Tinto in its top 10.
JPM UK Dynamic has served investors well over the long run, logging first-quartile returns over one, three and 10 years and gaining 133% over the decade.
The remaining fund in the table is the passively managed £11.7m First Trust United Kingdom AlphaDEX UCITS ETF, which tracks the NASDAQ AlphaDEX United Kingdom index, an equally weighted benchmark using fundamental growth and value factors to select stocks.
Performance of the funds vs sector over 5yrs
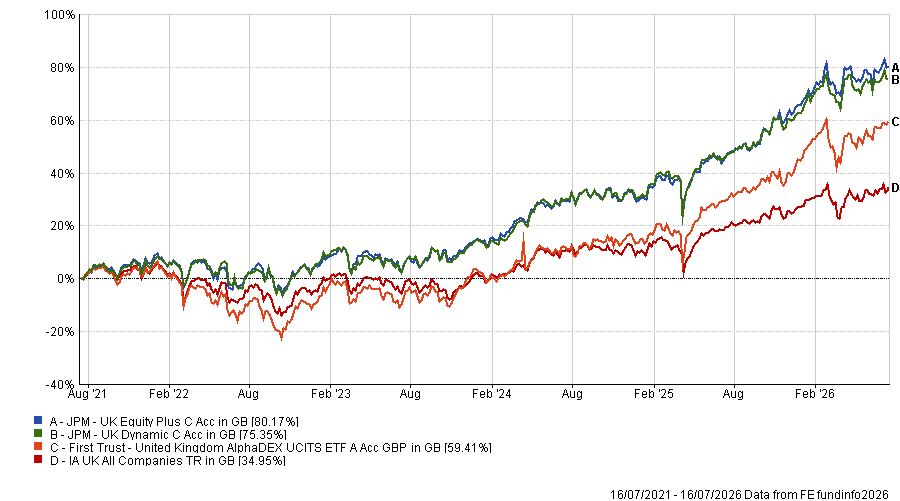
Source: FE Analytics
IA Europe Including UK
Looking across the wider continent, several funds in the IA Europe Including UK sector also met the outlined consistency criteria for this series.
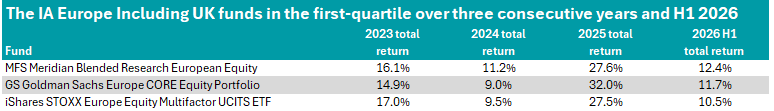
Source: FE Analytics
MFS Meridian Blended Research European Equity is the strongest performer in the table so far in 2026, gaining 12.4% in the first half of the year.
At €1.2bn, it carries a five-crown rating and is co-managed by a four-man management team: James Fallon, Jed Stocks, Jonathan Safe and Matthew Krummell. It currently has a 26.1% overweight to the UK, compared with 22% for the benchmark.
The strategy blends proprietary fundamental and quantitative research with a bottom-up process, identifying above-average quality companies trading at favourable valuations with catalysts the managers expect to be rewarded over the long-term.
With top holdings currently including ASML, AstraZeneca and BNP Paribas, the fund has logged top-quartile returns over one, three, five and 10 years, gaining 212.1% over the decade.
Another fund in the table is the €7.6bn GS Goldman Sachs Europe CORE Equity Portfolio strategy, which currently has a 19.7% weighting to the UK, followed by France (17.7%), Germany (16.9%) and Switzerland (15.2%).
Co-managed by Alpha Manager Takashi Suwabe, Osman Ali and Len Ioffe, it targets capital appreciation and is designed to mirror the style, sector risk and capitalisation characteristics of the benchmark (MSCI Europe) while outperforming through stock and country selection.
GS Goldman Sachs Europe CORE Equity Portfolio currently holds over 180 stocks, with 23% of the fund’s assets invested in its top 10 holdings. It has a historical tracking error of 2.69%.
The only qualifying passive fund in this sector is the iShares STOXX Europe Equity Multifactor UCITS ETF.
At €812.5m, the exchange-traded fund (ETF) aims to reflect the return of the STOXX Developed Europe Equity Factor Screened index, combing capital growth and income.
Performance of the funds vs sector over 5yrs
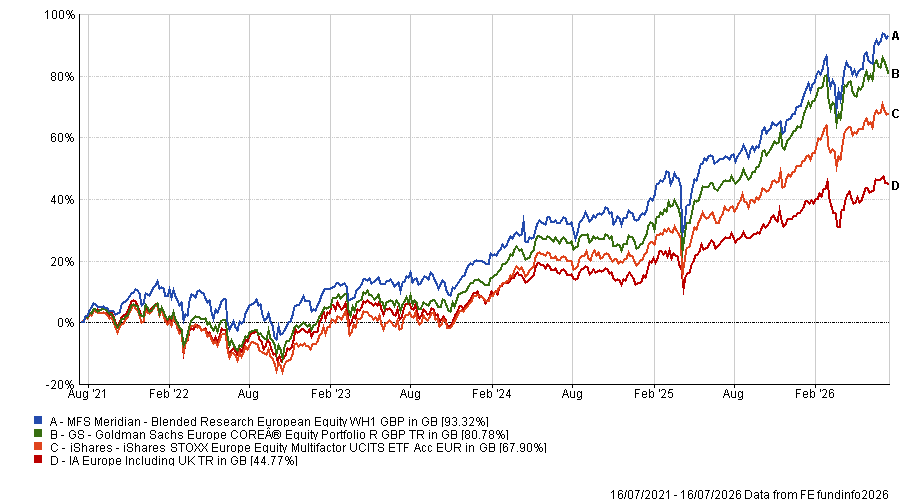
Source: FE Analytics
IA Europe Excluding UK
Looking at European funds with no exposure to the UK, only one strategy managed to log top-quartile returns over the three consecutive years and again in 2026 to the end of June.
Amundi Prime Eurozone gained 17.3% in 2023, 4.9% in 2024, 31.5% in 2025 and 10.2% in the first six months of this year. It tracks the Solactive GBS Developed Markets Eurozone Large & Mid Cap index.
Trustnet looks at how the 10 bought most European funds investors last year have performed in 2026.
Investors who bought Liontrust European Dynamic and/or Artemis SmartGARP European Equity last year have enjoyed strong returns in the first half of 2026.
The two strategies were among the most-bought IA Europe excluding UK funds of 2025 and were the only two of the 10-strong list below that managed to beat their sector average as well as their passive counterparts.
Trackers did what they are built to do, sitting in the middle of the pack rather than leading or lagging it, but in the active camp, some of 2025's popular picks struggled to keep up.
In this series Trustnet is looking at whether investors have had immediate success with their fund picks from 2025. Here we looked at last year’s most popular European funds.
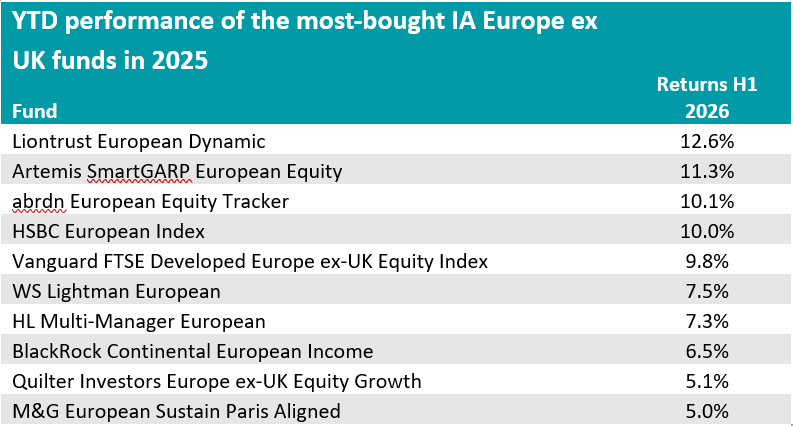
Source: FinXL
Active leaders
Liontrust European Dynamic topped the table at 12.6%. The £2.8bn fund is run by FE fundinfo Alpha Manager duo James Inglis-Jones and Samantha Gleave and carries a maximum FE fundinfo Crown Rating of five.
The process is built on academic research showing cashflow is the key driver of share price performance, FE Investments analysts explained, adding that the managers have delivered “a stellar performance track record” that holds up “regardless of the macroeconomic backdrop”.
In a similar vein, Artemis SmartGARP European Equity returned 11.3%. At £2bn it is run by Alpha Manager Philip Wolstencroft and also holds five crowns.
Square Mile analysts said the fund offers “an all-cap European ex UK portfolio with a value bias using a well-established and proven process”, built around eight factors, of which earnings revisions and valuation carry the most weight.
The analysts noted the fund's transaction costs run higher than peers but said this is “more than compensated for by superior returns over a full market cycle”.
Passive mid-fielders
The three trackers on the list clustered close to the sector average of 8.9%. Abrdn European Equity Tracker was up 10.1%. Just behind HSBC European Index gained 10%. It is the largest fund in the entire group at £7.7bn and is the cheapest on the list with an ongoing charges figure (OCF) of 0.06%.
FE Investments analysts noted HSBC's index range typically uses full replication as its tracking method and pointed to the group's exclusion of controversial weapons manufacturers as a modest source of tracking difference.
Vanguard FTSE Developed Europe ex-UK Equity Index returned 9.8%, just shy of the sector average.
Active laggards
The remaining five active funds all fell short of the sector average in the opening half of the year, although their backers can point to the short-term nature of analysing a six-month period.
All made positive returns, however, with the strongest coming from WS Lightman European, which was up 7.5%. The fund is included on the AJ Bell Recommended Funds best-buy list, with analysts noting that despite being run by a boutique asset manager, manager Rob Burnett is an “experienced fund manager” with a “tried and tested investment approach underpinned by a clear investment philosophy”.
“The fund is typically invested in lower valued stocks and the performance profile is therefore likely to be volatile and different to that of the benchmark,” they noted.
At the other end of the list, M&G European Sustain Paris Aligned props up the table with a 5% return. It is recommended by analysts at FE Investmnets, who said it has a “deliberately balanced split between stable growth and opportunity holdings”, with a focus on reducing portfolio carbon emissions.
“The lack of a strong bias to fast-growing companies differentiates the fund from sustainable competitors and the focus on reducing carbon emissions is well-defined with clear metrics against which to judge performance. The fund could be held as a core European holding in a diversified portfolio of funds,” they said.
The other popular funds in 2025 to underperform the peer group in 2026 so far are HL Multi-Manager European, BlackRock Continental European Income and Quilter Investors Europe ex-UK Equity Growth.
The prime minister will be unveiling cost-of-living measures from tomorrow.
Former Greater Manchester mayor Andy Burnham has succeeded Keir Starmer as prime minister, becoming the seventh to hold the title in just 10 years.
In his first speech in front of Number 10, Burnham pledged to make politics work better, noting this would be a “circuit-breaker” moment for Britain and promising a new political and economic model. As part of this, Burnham said a 10-year plan to reindustrialise the UK would be published later this year.
In the more immediate future, new measures to tackle the impact of the cost-of-living crisis and give people more “breathing space” will be announced on Tuesday, the prime minister revealed.
David Roberts, head of fixed income at Nedgroup Investments, said: “If you’d asked me a few months ago, I would never have said this, but the new UK prime minister Andy Burnham is almost like Mr Stability at the moment.
“It’s almost like the old saying: ‘The lesser of several evils’… he’s Mr Coalescence, the glue that could bind the current government together.”
However, there remain several challenges to contend with, including some unpopular changes made under Starmer’s government to pensions, ISAs and tax.
Burnham has pledged to adhere to the government’s current fiscal rules.
Schroders’ global fixed income team has warned that “any deviation from this stance would be difficult for the gilt market to ignore”.
Appointments to Burnham’s Cabinet, including chancellor Rachel Reeves’ successor, are expected to be announced over the course of the day.
Below, experts share their opinions on what the new prime minister means for markets and what people will want to see early on in his premiership.
A ‘muted response’
Tom Stevenson, investment director at Fidelity International, said: “In more normal circumstances, a new UK prime minister might be expected to dominate the headlines. In market terms, however, the transition has so far prompted a relatively muted response.
“Attention now focuses on what the first 100 days will bring. More importantly from a market perspective, the more significant question may be what measures are announced in the autumn Budget.”
Focus on Number 11
Peter Davies, head of direct fixed income at Canaccord, said investors will be looking for more details on Burnham's policy agenda, cabinet appointments and the new government's economic strategy.
In particular, there will be a sharp focus on who resides at Number 11 Downing Street, with frontrunner Shabana Mahmood “generally received positively by markets,” he said.
“Investors view her as a right-of-centre and pragmatic figure, although the identity of the chancellor is likely to matter less than the new government's broader approach to growth, taxation and public spending. Attention will therefore focus on Andy Burnham's wider economic agenda in the coming weeks,” he said.
'No shortage of ambition'
Helen Miller, director at the Institute for Fiscal Studies, said the new prime minister enters Downing Street "with no shortage of ambition".
"Greater devolution, more public control of utilities and a new council house building programme are among the promises that helped carry him into office. Delivering on any one of those agendas would be challenging. Seeking to rewire the British state against a backdrop of constrained public finances and with an in-tray full of domestic and international challenges will require much more than ambition," she said.
"If the new government is to make progress this decade, it will need to quickly flesh out the vision of what it wants to achieve and be ruthless in its prioritisation."
'Restoring stability will be crucial to boosting confidence'
Susannah Streeter, chief investment strategist at Wealth Club, said Burnham is “under pressure to unlock UK growth”, with one of his first challenges being to restore stability.
“Andy Burnham is inheriting an economy where political turmoil has become a defining feature of the landscape, so restoring stability will be crucial to boosting confidence,” she said.
“He will be the seventh prime minister in a decade, so investors will want to see a reset and reassurance that the economic landscape will remain predictable enough to justify committing capital for the long term.”
Likely Burnham beneficiaries
Angeline Ong, senior technical analyst at IG, highlighted housebuilders as one area of the market that should perform well under Burnham, who used his opening speech to call for more council houses.
“While the policy lacks detail at this stage, any meaningful expansion of social housing would represent a clear demand driver for the UK's affordable housing supply chain,” she said.
Northern-based infrastructure projects should also get a boost from Burnham's leadership and “a renewed focus on transport connectivity and regional regeneration would favour the UK's major infrastructure contractors”.
Lastly, the new prime minister looks set to uphold Starmer's proposed £15bn increase in defence spending, albeit centred as much on industrial strategy as national security.
“His emphasis on rebuilding sovereign manufacturing capability, strengthening domestic supply chains and accelerating investment in next-generation technologies such as AI and quantum computing points to a broader re-industrialisation agenda,” said Ong.
The case for UK small-caps
Each shift in leadership brings fresh uncertainty over tax, spending and regulation, which usually propels investors away from more domestically oriented small-caps.
However, Stuart Widdowson, co-manager of Odyssean Investment Trust, said the medium- to long-term value creation prospects of high-quality UK smaller companies remains “largely independent of who occupies Downing Street”.
“Many smaller companies are UK-listed in name only, generating the bulk of their operations, revenues and profits overseas,” he said.
“Others are being reshaped from within, with proactive management teams driving genuine strategic and operational transformation. In both cases, value creation owes little to a supportive UK macro environment or fiscal backdrop and as such they are largely insulated from the domestic picture.”
Andy Burnham becomes the UK's seventh prime minister in 10 years. Here is what it could mean for ISAs, pensions and wealth taxes.
Andy Burnham has become the UK's seventh prime minister of the past decade today, taking over from Keir Starmer in what is hoped will be a period of stability in UK politics.
Markets have taken the transition in their stride. At the time of writing, sterling is near a 13-month high against the euro and close to $1.35 against the dollar, gilt yields are around 4.95%, having eased back from a two-month high, and the FTSE 100 is trading essentially flat just above 10,500.
The calm, however, doesn't necessarily mean there is confidence in what comes next. Burnham inherits manifesto pledges such as protecting income tax, VAT and National Insurance, which leaves wealth, capital gains and departing assets as the principal levers available to an as-yet-to-be-named chancellor looking to raise revenue.
What exactly the next chancellor does with those levers – and how far Burnham's own instincts on taxing wealth and capital will shape the autumn Budget – remains to be seen.
There are a few points which seem firmer than others: maintaining Rachel Reeves’ fiscal rules and Labour pledges on income tax, National Insurance and VAT.
According to Sarah Coles, head of personal finance at AJ Bell, Burnham has “repeatedly demonstrated an enthusiasm for supporting the underdog and revisiting wealth taxes and taxes on higher earners to help pay for it." Below, she picks through the signals, trying to identify what a Burnham leadership means for investors.
Pensions and ISAs
The most immediate question for investors and savers is whether the next chancellor will revisit two of Reeves' most contested decisions: the inclusion of pension pots in inheritance tax from 6 April 2027 and the planned cut to the cash ISA allowance on the same date. Both have drawn "fierce criticism" and a new chancellor with a mandate to reconsider could shelve either or both.
Burnham has also said inheritance tax changes for farmers deserve a second look and that he wants to revisit the income tax personal allowance, currently frozen until April 2031, but stopped short of committing to raising it.
Tax
On one side, Burnham has spoken about cutting business rates for pubs by 20% and lifting the threshold for small businesses. On employers' National Insurance – a rise that has drawn significant pushback from business groups – Coles founds him “sympathetic to reversing it”.
On the other side, he has repeatedly signalled an appetite for taxing wealth and higher earners more heavily. He has described land as undertaxed, called for reform of council tax and stamp duty, and has previously floated reintroducing the 50p income tax rate – though he declined to say whether that remains on the table.
Before this campaign, his position on inheritance tax was scrapping it entirely and replacing it with a care levy to fund an integrated health and social care system. He confirmed during the campaign he would not rule out revisiting the idea.
Gilts, utilities and ‘public control’
Gilt yields had spiked to a two-month high earlier this month on speculation about a Burnham leadership bid, in part because of past comments in which he said he did not want to be answerable to the bond market. They have since eased back, partly on expectations that Shabana Mahmood will be named the next chancellor. "Whether the bond markets will take him at his word could well become clear" as his premiership gets underway, Coles said.
More specific concerns have emerged around his calls for stronger public control of key services. He has named energy, transport and water as areas where he wants to extend state involvement. That will matter to holders of shares in companies such as National Grid, Trainline and Severn Trent, said Coles.
He has stopped short of calling for nationalisation – the exception being Thames Water – but investors will be watching closely for any sharper definition of what “public control” means in practice.
On pensions specifically, Burnham's focus has been on low-income pensioners rather than savers. He reopened the debate around compensation for women born in the 1950s affected by state pension age changes, though his team later clarified he had not committed to full financial compensation.
Hyperscaler leverage and technological uncertainty is unsettling AI-linked markets, but strategists frame the recent sell-off as an argument for broader diversification rather than abandoning the AI trade.
Global technology stocks have suffered one of their sharpest reversals in months, with semiconductor and AI-linked names giving back a large share of their recent gains as momentum trades unwind across major markets.
Since 22 June, the MSCI AC World index has fallen 1.5% in US dollar terms, but much heavier losses have been seen in the tech space. The MSCI AC World Information Technology and Communication Services index has shed 8.2% while the MSCI AC World Semiconductor & Semiconductor Equipment index has lost 14.6%.
Correspondingly, given how much the AI and semiconductor trades have driven equity markets in recent years, the MSCI AC World Momentum index dropped 14.4% over the same period.
Some in the market attribute part of the recent AI sell-off to technical positioning, arguing that crowded momentum trades were vulnerable to a sharp unwind regardless of the underlying fundamentals.
But Wolf von Rotberg, equity strategist at J. Safra Sarasin Sustainable Asset Management, said the real story behind the wobble is not a loss of faith in AI itself but a structural shift in how the technology's biggest backers are paying for it.
Von Rotberg noted that the combined free cashflow of the five US hyperscalers that have underpinned the AI rally for three years – Alphabet, Amazon, Meta, Microsoft and Oracle – is now approaching negative territory, a shift that is forcing them to fund capital spending externally rather than from their own cash reserves.
Performance of indices since 22 Jun 2026
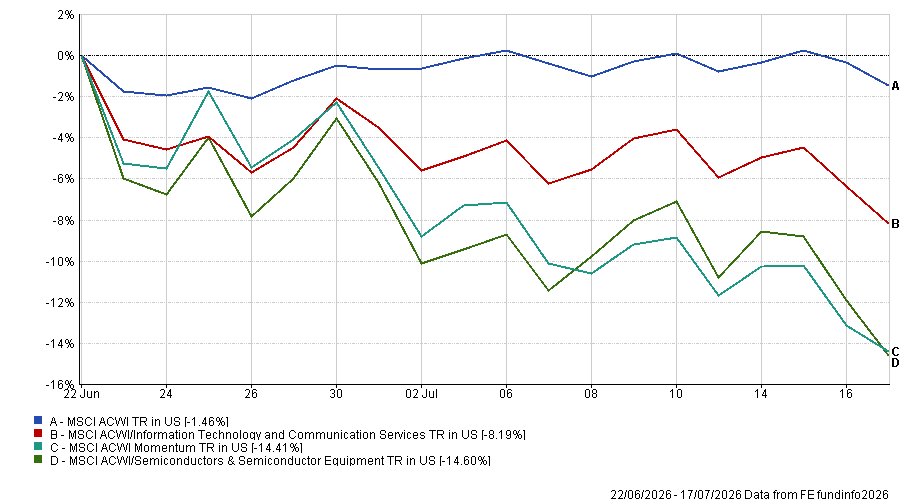
Source: FE Analytics. Total return in US dollars between 22 Jun and 17 Jul 2026
Alphabet has already raised $85bn of fresh equity toward its planned $190bn of 2026 capital expenditure, one of the largest equity raises on record. It has issued a further $110bn of debt since the start of 2025, trailing only Amazon's $152bn, with Oracle having issued $71bn over the same period.
"The market has taken note of the build-up in leverage and has shown its discomfort," von Rotberg said.
"The [hyperscaler] complex has underperformed the broader equity market in 2026. It has fallen by 1.5%, while the S&P 500 has gained 10% year-to-date. The same holds for the newly issued credit instruments, whose performance has been far from stellar. Spreads to treasuries have spiked in July, in an otherwise calm credit market environment."
On the surface, this retreat has left hyperscalers looking "attractively valued". Their aggregate price-to-earnings (P/E) ratio has fallen to its lowest level since the end of the pandemic, yet von Rotberg cautioned against taking this at face value, pointing to a sharp rise in the price-to-free-cashflow multiple that tells a very different story to the P/E ratio alone.
The gap between the two measures matters because it depends on whether capital spending translates into earnings growth, he explained.
J. Safra Sarasin Sustainable Asset Management estimated that cloud earnings would need to keep growing at around 20%, matching the sector's historical performance, to justify current valuations; anything short of that would make the sector look expensive rather than cheap.
A shift in the composition of that spending is adding to the strain. Memory chips now account for 18% of data centre costs, up from just 2% five years ago, and chips depreciate over three to five years, compared with seven to 10 years for buildings and power infrastructure.
"In effect, the incremental capex dollar spent not only fails to generate more future return but is also recognised more quickly as depreciation, weighing on earnings," von Rotberg said. "The impact is sizeable, with depreciation expenses as a share of revenues rising sharply over the coming years."
The firm's modelling suggests depreciation could rise from 8% of sales in 2025 to 22% by 2030. "Against this backdrop, consensus margin expectations appear quite optimistic, remaining largely stable for the coming years," he warned.
A similar concern is playing out on the supply side of the AI trade. Susannah Streeter, chief investment strategist at Wealth Club, pointed to TSMC's results as the trigger for some of last week's selling, despite the Taiwanese chipmaker reporting a 61% year-on-year rise in second-quarter net profit and confirming plans to invest $100bn on expanding advanced manufacturing capacity in the US.
The concern is not whether demand exists today, since customers including Nvidia, AMD and Apple continue to signal strong appetite, but whether the equipment being built now will still be competitive by the time it needs to earn its keep.
"Given the rapid pace of innovation in AI chips and computing architecture, there is a risk that equipment could become outdated, forcing operators to replace it sooner than expected," Streeter said, adding that the build-out phase is taking longer than some anticipated while returns remain further off.
The tension between long-term conviction and near-term doubt can be seen in the recent Natixis Investment Managers' 2026 Strategist Survey. It found 91% of respondents expect AI to remain the single biggest driver of market performance in the second half of the year, while 97% believe its benefits will eventually spread to companies beyond the direct chipmakers and infrastructure builders.
But there was also caution over timing and concentration. Just 45% of strategists surveyed expect a return on AI capital expenditure within the next year and 85% rank concentration in a small number of AI-linked companies as a top concern.
Von Rotberg's take on what happens next is conditional rather than pessimistic. Hyperscalers need to show that AI revenues are materialising, he argued, or they may be forced to moderate their spending plans to protect shareholder value.
But such a moderation would not necessarily be negative for markets, he finished: "A rebalancing of supply and demand for AI infrastructure components would likely trigger a partial reversal of recent price increases and could provide the basis for a more balanced, yet flatter build-out in the years to come."
UK stocks are being bid for as the market remains cheap.
Andy Burnham is set to become the next prime minister later today in what could be the “last roll of the dice” for the UK market, according to Douglas Scott, investment manager at Aegon Asset Management.
UK stocks have been unloved for much of the past decade, with political instability a large factor in investors’ decision to shun the domestic market.
Scott highlighted the series of approaches and takeovers for UK-listed companies this year as a signal for how cheap domestic stocks have become.
There are 29 bids ongoing for UK companies with a total market cap of £61bn, data from Peel Hunt shows. This compares to 40 in the whole of 2025. Five bids have come for companies in the FTSE 100 versus none last year, including Nuveen’s successful approach for asset manager Schroders.
“The one common theme is that overseas buyers, be they listed or private, are buying UK companies with international operations. Indeed, FTSE Russell data shows that 82% of FTSE 100 revenues are overseas, up from 70% in 2014,” he said.
“International buyers are not seeing the UK domestic market as attractive yet and the revolving door at Westminster for prime ministers has not helped that.”
While spending on energy, defence and housing will likely increase under the new-look Labour government, he said, this money will need to come from somewhere, meaning potential tax rises leaving less money in people’s pockets to invest and denting consumer confidence.
Additionally, the UK faces a structural inflation problem due to energy requirements, said Scott. This is important but, as yet, something that “governments of all persuasions have not been able or willing to practically address”.
“As we enthrone the latest in a high turnover line of prime ministers there is a strong feeling that this is the last roll of the dice for UK plc and that failure will result in another revolution, not just of the No. 10 revolving door, but towards an even more dramatic change in government,” he concluded.
Funds run by Baillie Gifford, Schroders and Janus Henderson all make the list.
Small-cap funds and two income specialists are turning things around in 2026 having suffered a difficult past decade, a Trustnet study shows.
This series looks at the funds that have risen to the top quartile of their sector in 2026 but still languish in the bottom 25% of the peer group over the decade.
Looking at those with a worldwide remit, two funds fit this criteria from the IA Global Equity Income sector. UBS Enhanced Global Equity Income was among the funds to have paid the most out in dividends over the past decade. With total dividends of £5,585.90, it actually topped the list.
Managers Grzegorz Ledwon and Jie Song aim to generate at least 110% of the income from the MSCI AC World index over 12 months by investing in dividend-paying companies and through call options.
However, it did not appear on the ultimate guide to global equity income funds produced by Trustnet earlier this year - which looked for funds combining high and growing dividends each year with strong total returns - as its returns were not strong enough.
Total returns have turned around so far in 2026, however, with UBS Enhanced Global Equity Income up 21.3%, the second-best gain of any fund in the list below
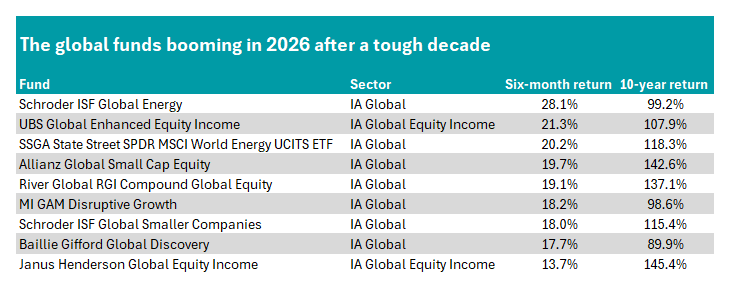
Source: FE Analytics
The other from the IA Global Equity Income sector is the £741m Janus Henderson Global Equity Income fund, managed by Andrew Jones, Ben Lofthouse and Faizan Baig. It is also the fund with the most in assets under management.
Recommended by analysts at Barclays, they said the fund has a strong and established team, with the managers supported by "one of the largest teams of analysts in the global equity income sector".
The managers can utilise the research and insight from the other fund managers and analysts across the firm as well, which helps them identify the best investment opportunities across multiple geographical regions.
"We believe these resources and experience of the team are the main reasons why this fund has performed strongly when compared to other global equity income funds," Barclays analysts said.
Turning to the broader IA Global peer group, seven names appeared on the list above. The top performer has been the £539m Schroder ISF Global Energy fund, which has made 28.1% so far in 2026.
The fund is managed by Mark Lacey and Alex Monk, who invest in exploration and production companies in the traditional oil and gas sectors, but can also branch out to companies involved in infrastructure, utilities, renewable and alternative energy.
It has been boosted by a resurgent oil price. A barrel of Brent crude started the year at just above $60 but rose sharply at the outbreak of the US-Iran war, which resulted in the closure of the Strait of Hormuz, through which a fifth of the world's oil supply passes through.
Although the oil price has since come down, oil companies have continued to do well. This partly reflects that the price remains above $85 at present (higher than the start of the year) but also that the war has placed greater scrutiny on energy security.
The Schroder fund was joined by State Street SPDR MSCI World Energy UCITS ETF in the list above, a passive option that has also benefited from rising oil and gas prices.
Energy was not the only theme, however. Smaller companies have also started to outperform in earnest for the first time in almost a decade, with Allianz Global Small Cap Equity and Schroder ISF Global Smaller Companies making the list above.
Baillie Gifford Global Discovery, managed by Douglas Brodie, Svetlana Viteva and FE fundinfo Alpha Manager John MacDougall, is also a small-cap specialist.
The £352m fund, managed by the same team that heads the Edinburgh Worldwide investment trust, aims to beat the S&P Global Small Cap index over rolling five-year periods.
Nish Patel, manager of The Global Smaller Companies Trust, recently noted that over the past five months, small-caps have outperformed larger companies by around 6 percentage points and the Magnificent Seven by around 12 percentage points.
"We believe this could mark the beginning of a new cycle for the asset class," he said.
This is part of an ongoing series. Previously we have looked at the UK and Asia as well as the four main mixed asset sectors.

The information contained on this website and in the tools, data, prices, news, charts, fundamentals and other content made available through it is provided by Communify Europe Limited, unless expressly stated otherwise.
The information is provided for informational purposes only. It does not constitute investment advice, a personal recommendation, investment research, a research recommendation, an invitation or inducement to engage in investment activity, or a recommendation to buy, sell or hold any share, company, fund, investment vehicle or other financial instrument. Communify Europe Limited does not assess the suitability or appropriateness of any investment for any user.
The information is based on sources that Communify Europe Limited considers reliable. However, Communify Europe Limited does not guarantee that the information is accurate, complete, current, uninterrupted, secure or error-free. Prices, quotes and trades may be delayed by at least fifteen minutes unless expressly stated to be provided in real time.
Past performance is not an indicator of future performance. Communify Europe Limited does not guarantee the return of any investment or the performance of any security, company, investment vehicle, index, underlying asset or market. The value of investments may rise or fall, and investors may lose all or part of the amount invested.
To the extent permitted by applicable law, Communify Europe Limited will not be liable for any loss or damage arising from use of the information contained on this website. Nothing in this notice excludes or limits liability for fraud, death or personal injury caused by negligence, breach of the duty to provide services with reasonable care and skill, or any other liability that cannot be excluded or limited under applicable law. Terms and conditions apply.
© 2026 Refinitiv, an LSEG business. All rights reserved.
 Please wait...
Barclays Investment Solutions Limited provides wealth and investment products and services (including the Smart Investor investment services) and is authorised and regulated by the Financial Conduct Authority and is a member of the London Stock Exchange and NEX. Registered in England. Registered No. 2752982. Registered Office: 1 Churchill Place, London E14 5HP.
Barclays Bank UK PLC provides banking services to its customers and is authorised by the Prudential Regulation Authority and regulated by the Financial Conduct Authority and the Prudential Regulation Authority (Financial Services Register No. 759676). Registered in England. Registered No. 9740322. Registered Office: 1 Churchill Place, London E14 5HP.