Selectors identify the trusts that have been building momentum this year.
Investment trust discounts have started to narrow, leading experts to identify those that might be poised for further re-rating if their strong performance continues.
Data from the Association of Investment Companies (AIC) shows the average investment trust is on a 14% discount to its net asset value (NAV). However, according to Nick Britton, research director at the AIC, this is beginning to change.
“Since the start of the year, discounts have narrowed in 29 AIC sectors and widened in only seven,” he said. “The average discount has narrowed 1.5 percentage points – a small move, but a welcome one.”
With this in mind, Trustnet asked fund pickers for their favourite investment trusts benefitting from narrowing discounts.
Anthony Leatham, head of investment companies research at Peel Hunt, started with the “partial rotation” out of US equities following mixed economic data and other markets have surprised on the upside.
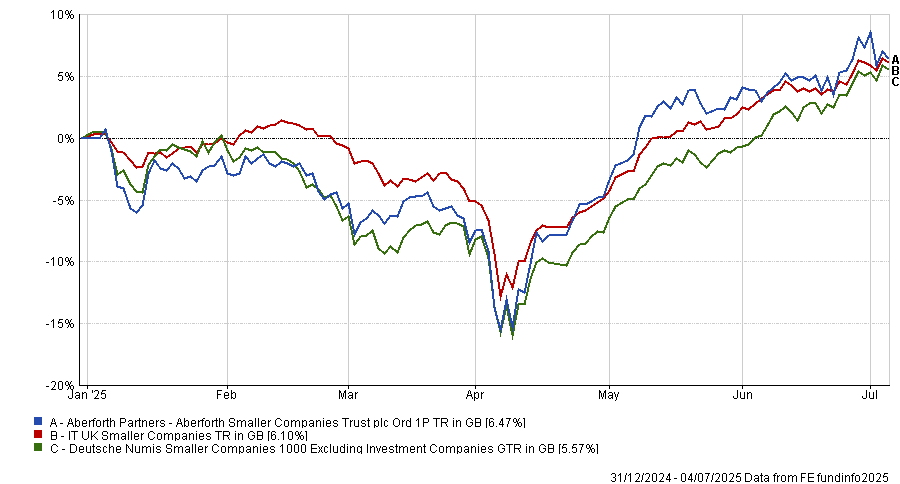
He highlighted Aberforth Smaller Companies as an example of a trust that is already benefiting from this trend.
Its value-focused investment style and emphasis on smaller companies puts the trust on a “triple discount”: the UK is discounted compared with global markets, smaller companies are discounted compared with larger peers and the trust itself is on an 11% discount.
Over the past 12 months, Aberforth Smaller Companies has underperformed the IT UK Smaller Companies sector (5.1%) and the Deutsche Numis Smaller Companies 1000 (23.3%).
However, the trust has been a key beneficiary of “recovery in UK equities and the pick-up in M&A activity” and is outperforming the sector and benchmark this year as a result.
Aberforth Smaller Companies performance vs sector and benchmark YTD
Source: FE Analytics
“As international and domestic buyers alike begin to engage with the attractive valuations and returns on offer at the small-cap end of the UK equity market, we anticipate the layers of discount that run through Aberforth Smaller Companies’ portfolio to narrow,” Leatham said.
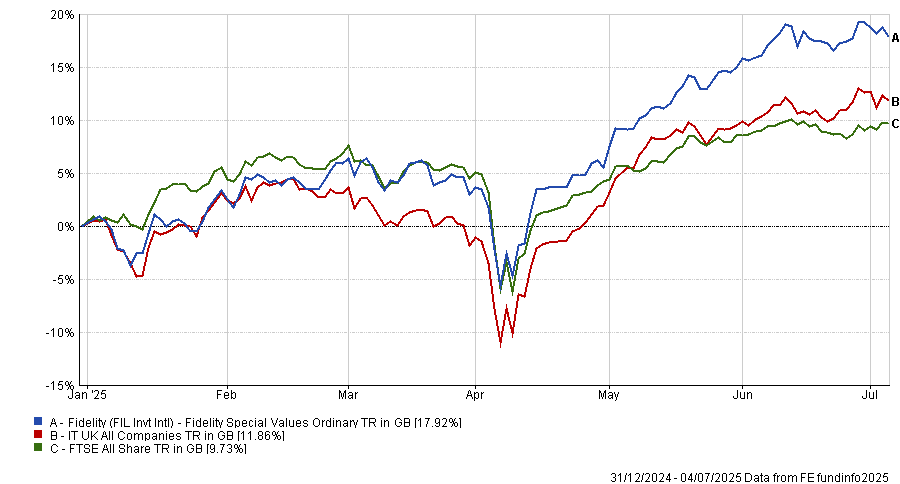
Meanwhile, Winterflood head of investment trust research Emma Bird favoured Fidelity Special Values.
At the end of June, its discount to NAV had narrowed down to around 2-3% from 8% at the start of the year, as investors have become more positive about UK equities, she explained. Net retail flows into the trust’s shares were consistently negative before ‘Liberation Day’ but have rallied since, according to research by Winterflood analysts.
FE fundinfo Alpha Manager Alex Wright has an “impressive stewardship” running the trust, outperforming the FTSE All Share over one, three, five and 10 years. Year-to-date performance has also been strong, with Fidelity Special Values up 17.9% and sitting in the top quartile of the IT UK All Companies sector.
Fidelity Special Values performance vs sector and benchmark YTD
Source: FE Analytics
While the 2% discount “does not offer particular value relative to history”, the board is generally committed to maintaining a single-digit discount in normal conditions, Bird said.
“We believe that the fund’s contrarian value approach, with a focus on the potential for positive change, offers an attractive proposition,” she added.
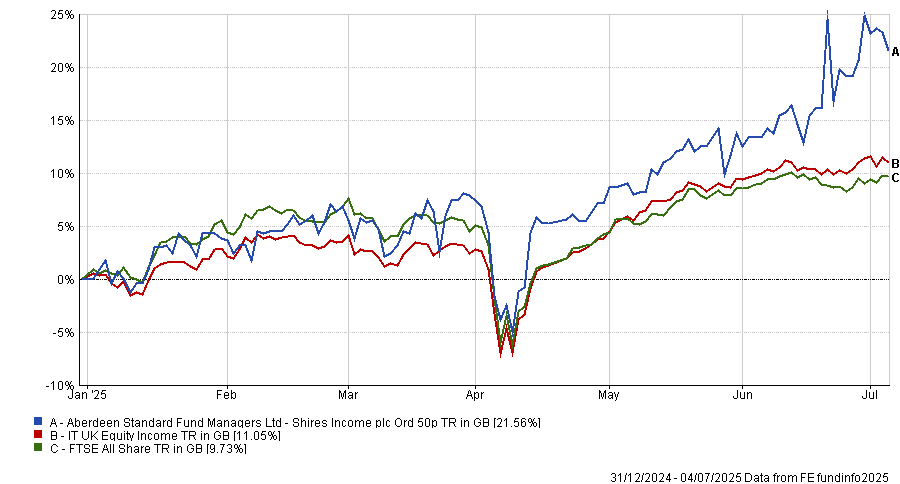
Shires Income has been “quietly building momentum this year”, according to Josef Licsauer, research analyst at Kepler Partners.
Managed by Iain Pyle, the trust favours undervalued high-yielding shares, with a slight preference for mid- and small-caps. As a result, it offers “meaningful diversification beyond traditional large-cap equity income strategies”.
For the first time in two years, Shires Income moved onto a premium towards the end of June (0.6%, as of 26 June, compared with a 13% discount at the end of the last financial year), Licsauer explained. While this has slipped in recent days, the trust still trades close to NAV.
This re-rating is particularly due to the attractive dividend yield of 5.1% which is “above average for the market” and provides a good balance of defensiveness and growth potential, the Kepler analyst said.
With UK fundamentals seemingly improving and the Bank of England entering a gradual rate-cutting cycle, which tends to benefit the more domestically exposed companies, these tailwinds are likely to continue, he explained.
“In a market where UK equities remain cheap and under-owned, we think the strategy's distinctive income-led approach appears to be resonating with investors.”
FE Analytics shows the trust’s 21.6% return is the best result in the IT UK Equity Income sector this year.
Shires Income performance vs the sector and benchmark YTD
Source: FE Analytics
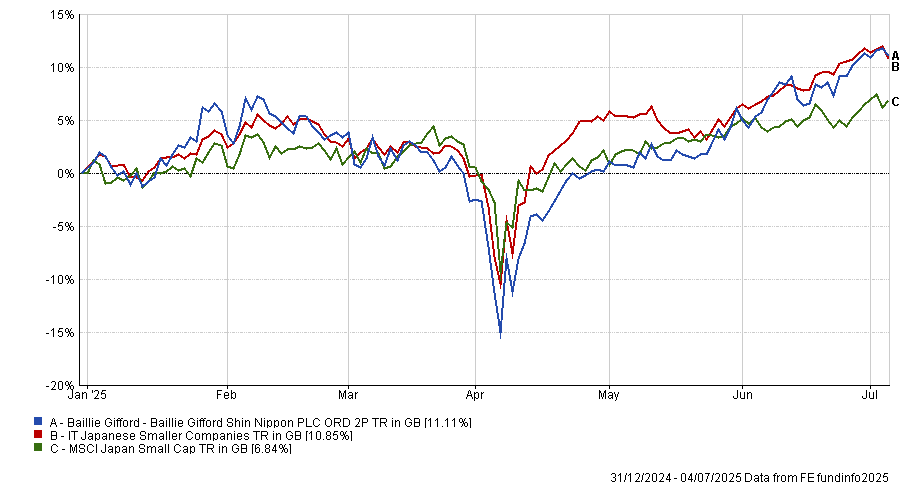
Finally, Mick Gilligan, head of managed portfolio services at Kilik, said Baillie Gifford Shin Nippon has “scope for further narrowing”.
It targets smaller Japanese companies that have disruptive business practices or appealing opportunities, such as overseas growth. This comes at a time when Japanese smaller companies are appealingly valued, with the MSCI Japan Small Cap index trading on a price-to-earnings ratio of 14.3x compared with around 30x for the S&P 500.
Shin Nippon currently has a discount of around 8% to NAV, but it generally traded on a premium between 2013 and 2021, Gilligan explained. With the trust delivering a strong performance so far this year, it is “entirely conceivable that it gets back to a premium rating” if this performance continues.
Baillie Gifford Shin Nippon performance vs the sector and benchmark YTD
Source: FE Analytics
However, Gilligan noted that the trust is a niche investment and if recent performance wanes, the discount is likely to widen. As such, it is only suitable for around a 2.5% allocation in most balanced portfolios, he concluded.
But the UK market should remain an attractive option for global investors, argues AJ Bell investment director Russ Mould.
Forecasts for FTSE 100 dividends have weakened once more, suggesting investors hoping for a return to 2018’s record £85.2bn in payouts will have to wait until at least 2026.
City analysts have forecast £80.4bn in dividends from FTSE 100 members this year, down from their £83bn estimation three months ago. This represents an increase of just 2% on 2024’s payouts, putting the FTSE 100 on a forward dividend yield of 3.5% for 2025.
FTSE 100 dividend forecast
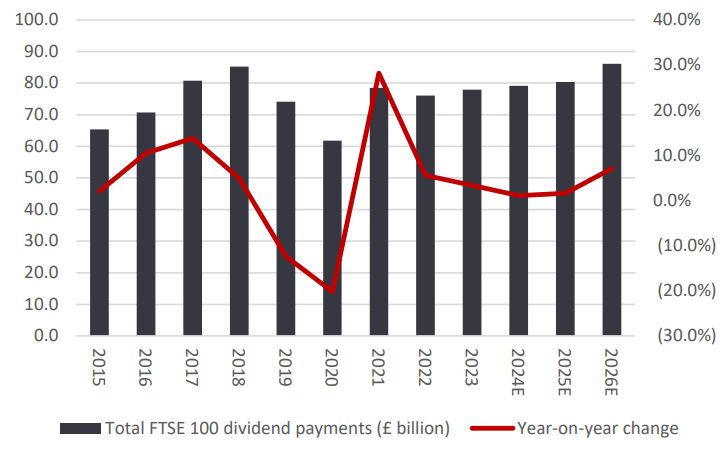
Source: AJ Bell, company accounts, Marketscreener, consensus analysts’ forecasts. Ordinary dividends only.
This is according to AJ Bell’s latest Dividend Dashboard, which aggregates forecasts for FTSE 100 companies from leading analysts on a quarterly basis to generate a dividend outlook for each company.
Russ Mould, investment director at AJ Bell, said: “Analysts seem to think that big increases will be a relative rarity in 2025, perhaps because buybacks are playing a big role in capital allocation plays – a board and chief executive are likely to draw less flak for a pause in a buyback than they are for a dividend cut.
“Investors also need to bear in mind the role of the pound, whose strength against the euro and particularly the dollar this year reduces the value in sterling terms of the dividends declared in those currencies by no fewer than 28 current members of the FTSE 100.”
That said, Natwest is forecast to increase its dividend by £532m this year, followed by Unilever (£210m increase), Admiral (£177m increase) and Fresnilo (£151m increase). On the other hand, big cuts are expected from Rio Tinto, HSBC and Shell.
Forecast dividend increases and decreases
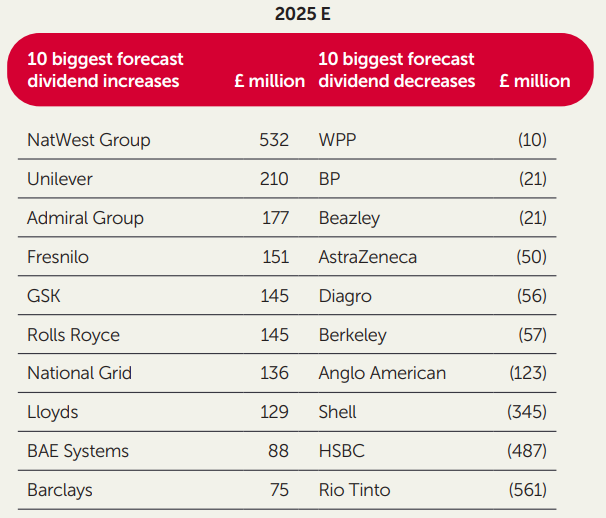
Source: AJ Bell, company accounts, Marketscreener, consensus analysts’ forecasts. Ordinary dividends only.
Unlike 2024, no firm has yet declared a special dividend for 2025. Last year, companies including HSBC, Berkeley Group and Admiral offered such payments to the collective tune of £3.7bn.
“Any similar distributions could further top up the cash pot, as could any merger and acquisition activity,” said Mould.
“A predator is yet to circle a FTSE 100 member in 2025, but buyers of UK assets have tabled bids worth a total of £20bn already this year, after £49bn worth of successful approaches in 2024. Takeover deals can therefore add to the total return from the UK equity market overall.”
Ordinary dividends, special dividends and share buybacks
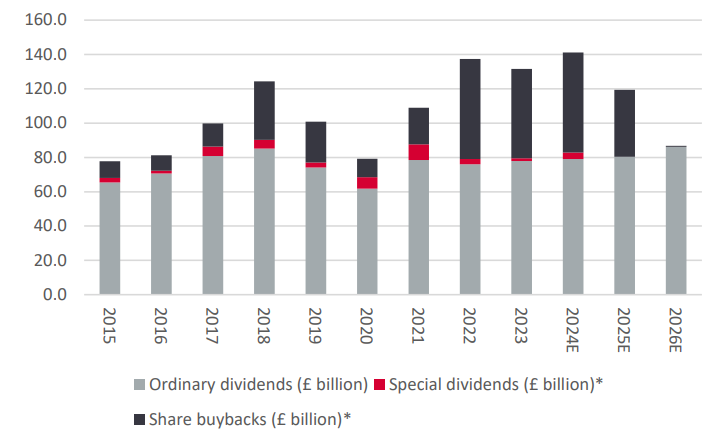
Source: AJ Bell, company accounts, Marketscreener, consensus analysts’ forecasts. *Announced in aggregate as of 20 Jun 2025
While dividend growth remains anaemic, buybacks are playing an increasingly central role in shareholder returns.
FTSE 100 firms have so far announced plans for £39bn in share buybacks in the first quarter of 2025 – equivalent to more than half of 2024’s total – which takes the total expected payout from the headline index to £119.4bn. This equates to just shy of a 5.3% cash yield on the index’s £2.3trn market capitalisation.
“That cash yield beats inflation, the 10-year gilt yield and the Bank of England base rate which, on balance, still seems to go lower before it goes higher once more,” said Mould.
Hopes for a new all-time high in pre-tax profits from the FTSE 100 are also starting to wane, with analysts’ forecasts down 7% from three months ago to £231bn. Forecasts for 2026 have also fallen by 6%.
Mould said the potential for tariffs and trade wars to move those numbers remains, while events unfolding in the Middle East will also have an inevitable impact.
“Although the manner in which BP and Shell are expected to generate one-seventh of the FTSE 100’s total earnings between them in 2025 may mean that the UK market has some kind of hedge in place, should oil spike amid gathering tension between Jerusalem and Washington on the one hand and Tehran on the other,” he noted.
The research further pointed to the fact FTSE 100 earnings are highly concentrated, with just 10 companies forecast to pay out 53% (or £42.4bn) of the forecast total for 2025.
Ultimately, the UK may offer investors a “more propitious mix of sector earnings than tech-heavy America”, said Mould, highlighting the UK premier index’s 9.6% total return so far this year, versus S&P 500’s 2.1%.
He said investors in the UK market would have access to plentiful cyclical and cheap growth and perhaps “feel less obliged to pay top dollar (in every sense) for secular growth”.
In addition, the UK’s exposure to miners and commodities could persuade some investors that the market may serve as a haven in the face of ongoing inflation or worsening geopolitical tensions. Just over a third of the FTSE 100’s expected dividends are expected to come from more defensive sectors, such as healthcare and telecoms.
“Whether this trend [in UK versus US performance] continues or not remains to be seen, and the combination of a higher index and falling profit and dividend forecasts does take some of the shine off the appeal of the UK equity market, simply by dint of mathematics,” Mould said.
Franklin Templeton’s Michael Browne examines the first year of the Labour government and where it could go from here.
A year ago the Labour Party won a historic majority and swept into power with a mandate for a new direction. The promise was to unlock growth and productivity whilst being good custodians of the nation’s moral and financial reputation.
It would be easy to go through the list of key election pledges and assess how far along the road they are to delivering on them. We could talk about policy errors and U-turns, in particular Pensioner Winter Fuel allowances. But in reality, these are symptoms and not the key theme running through the first year of this government.
And, yes it’s the same theme we have had since 2009 and one which has become acutely amplified since the Covid crisis. How does a government spend on its political priorities when, to quote Labour’s Liam Byrne in 2010, when leaving a note for his Conservative successor: “I am afraid there is no money”.
National Accounts axes as a share of GDP
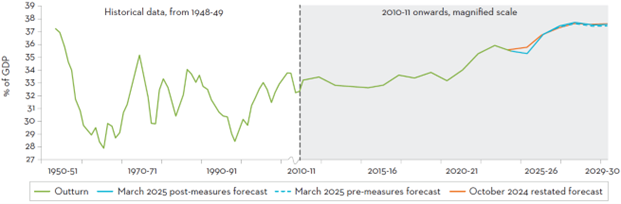
Note: The October 2024 forecast as a share of GDP has been restated to account for revised nominal GDP data in the 2024 Professional Pensions Blue Book.
UK debt to GDP
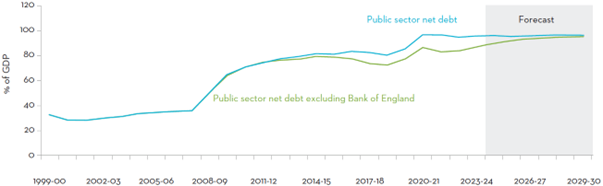
Things were tight in 2010, as the dust settled from the 2008 global financial crisis (GFC) when debt to GDP was around 65% and interest rates were 1%. A decade later after government spending on the Covid crisis, it is now 95% (debt to GDP) with rates at 4.25%; the situation is almost unbearable.
With a natural instinct to boost government spending on health, education and welfare and a need to spend on defence, where is the money coming from?
The first Budget from chancellor Rachel Reeves did some sensible accounting by moving capital expenditure off the debt/GDP target. This has resulted in a series of long-term spending plans being developed for housing, ports, energy and infrastructure. These are hugely significant in re-wiring and re-igniting the UK economy and the focus is right:
These are important initiatives: long-term investments to allow the UK to raise productivity and attract new investment and growth. But such plans are slow to mature, they do little to improve growth now but much to improve it after 2030.
But what about day-to-day spending? Fuel allowances, pensions, disability allowances, the NHS, schools, the list goes on.
And there are powerful forces telling you, you can’t do it all: Firstly, as Liz Truss found out, there is the bond market. Secondly there are the economic experts deep in government, often labelled as ‘Treasury Orthodoxy’, backing up the bond market. Lastly, there is the Monetary Policy Committee (MPC), whose only worry is inflation, which in the long term must be at 2% and their mandate is to settle the nerves of the bond market.
When the MPC was set up under Gordon Brown in 1997, it was a mistake not to give it a dual mandate, inflation and growth, as you see in the US with the Federal Reserve. In 2021 the then-chancellor, Rishi Sunak, tried to give it a secondary growth mandate but somehow it has slipped off the table. It seems to solely focus on inflation and having missed the signals on the way up in 2022, the MPC now sees inflationary dangers lurking inside almost every data point they can find and rates are very slow to fall.
As a government you need growth, to generate income, to fund promises. Growth rates since 2008 have been around half of the long-term trend and the forecasts for 2025 and 2026 show a continued global growth slowdown. The only hope is that as growth slows and even stops entirely in the next 12 months, is that inflation subsides sharply and it allows the MPC to cut rates. The cuts to rates will have to be similar to what the European Central Bank (ECB) has done, eight cuts and counting, and that gilts follow those rates lower.
If the government are tough on the current spending round – and it’s not started well with the U-turns over winter fuel, Universal Credit and Personal Independence Payments (PIP) – then it’s just possible that if the economy flatlines over the next two to four quarters, with weak oil prices and a strong sterling, these rate cuts could ride to the rescue.
This is the great contradiction that all investors remember, especially the bond market, where bad news suddenly becomes the good news. But in the wait for the rate cuts, the political pressure will rise sharply. Could they, would they hold their spending nerve? Not only does Reeves need to be the lucky chancellor, she needs to ensure that the bond market thinks she has the steel to restrict spending.
Effectively you are left thinking that the economic reality has made the promises of the last election un-obtainable. Unless you can find a new source of tax revenue, which is exactly as US president Donald Trump is trying to do via tariffs. They have tried raising taxes on school fees, pensioners, non-doms and employers, all with less success than they forecasted. Would they raise income tax or even capital gains/wealth tax? What would be the consequences? The risk today is that the government gets caught in an economic doom loop of lower growth, needing more taxes to avoid bond market jitters about government promises and spending, which again prompts lower growth.
The Labour party are caught in an economic bind that would have ensnared any party coming to power. But they did know that. The real question is can they find a way out of it? Find an economic path that gives them just enough room to effect their political choices? Or will they get lucky as weak global growth gives them an interest rate break? At present, caught in a mess they didn’t make, they are making it worse by trying to muddle through.
That will, of course lead them to lose the next election (after all only 20% of adults in the UK voted for them in 2024) and, if the polls are right, usher in Nigel Farage’s Reform Party into power. And that is why the UK’s gilts carry such a premium to their G7 neighbours.
Michael Browne is global investment strategist at Franklin Templeton Institute. The views expressed above should not be taken as investment advice.
Value-focused equity funds lead returns under Labour rule.
Funds managed by Artemis, Ninety One and Schroders made the highest returns in the 12 months since Labour won the 2024 general election, Trustnet research shows.
After 14 years in opposition, the party’s 2024 manifesto promised economic stability through unlocking markets, investing in infrastructure and leading the green revolution. But unlike Tony Blair’s government in 1997, prime minister Keir Starmer has faced a sluggish economy, geopolitical uncertainty and strained US relations.
The UK’s economic growth has been far from impressive, with the fiscal situation further strained by a disappointing first Autumn Budget and a debt-ridden public purse.
According to Andy Marsh, co-manager of Artemis Income, while there have been “several false dawns” in recent years when investors thought the UK might come back into favour, there are some notable differences following a year operating under a Labour government.
“The companies that are here now are much stronger, as the weak ones have either disappeared or been taken over,” he said.
Several of the companies still standing are global in nature, Marsh pointed out, meaning they are not too dependent on the fate of the UK economy.
In particular, the UK is home to companies with the defensive qualities that investors look for during periods of uncertainty.
“Most other developed economies have similar challenges – they may not be as bad and they may be different, but I don’t think we’re alone in facing problems,” Marsh said.
But how have UK fund managers fared this year? Trustnet dug into the data to find out.
Performance of UK market over 12 months
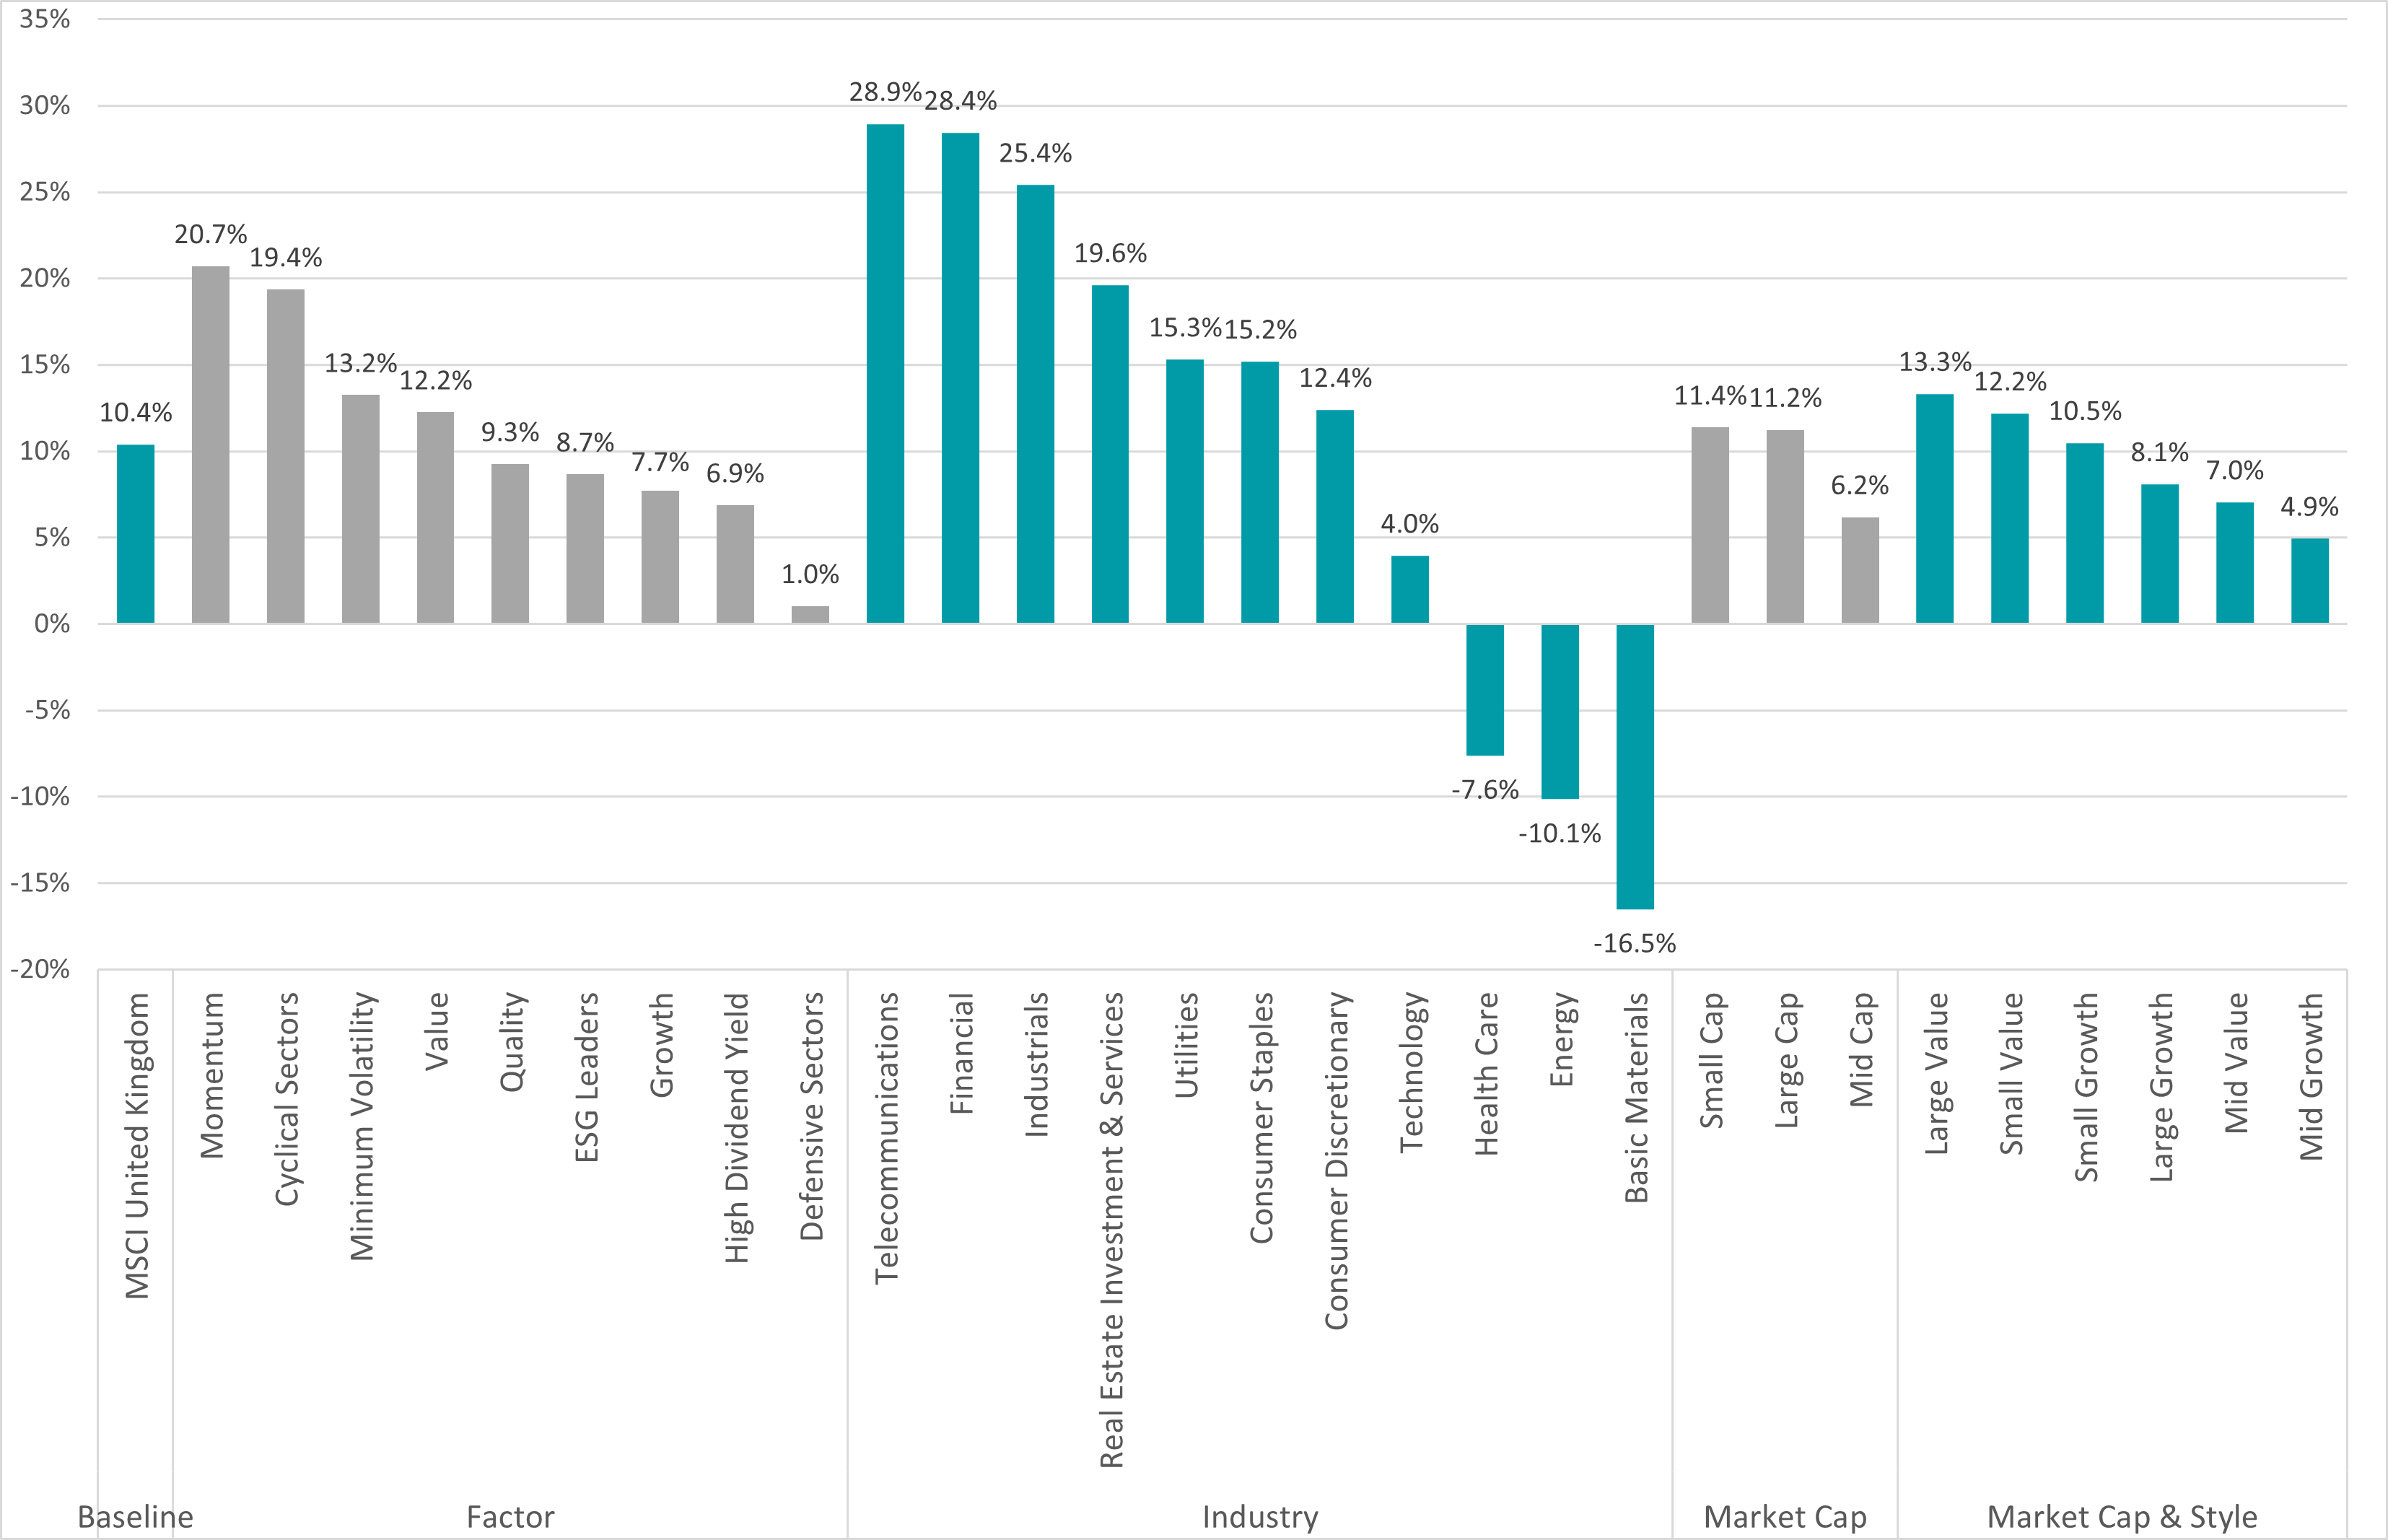
Source: FinXL
As demonstrated by the table above, momentum proved to be the most lucrative investment factor over the past 12 months, delivering a 20.7% total return.
At the industry level, telecommunications and financials emerged as clear winners, posting robust gains of 28.9% and 28.4% respectively.
Meanwhile, value continued its resurgence, beating growth across every market cap segment. Large-cap value and small-gap value returned 12.2% and 13.3% respectively, ahead of their growth counterparts at 10.5% and 8.1%. Even in the mid-cap space, value (7%) had the edge over growth (4.9%).
While small-cap stocks as a whole returned 11.4%, slightly above a 11.2% gain for large-caps, as is shown in the ranking table, this trend didn’t translate to fund performance. Notably, none of the top 25 performing UK funds over the past year had a dedicated small-cap mandate.
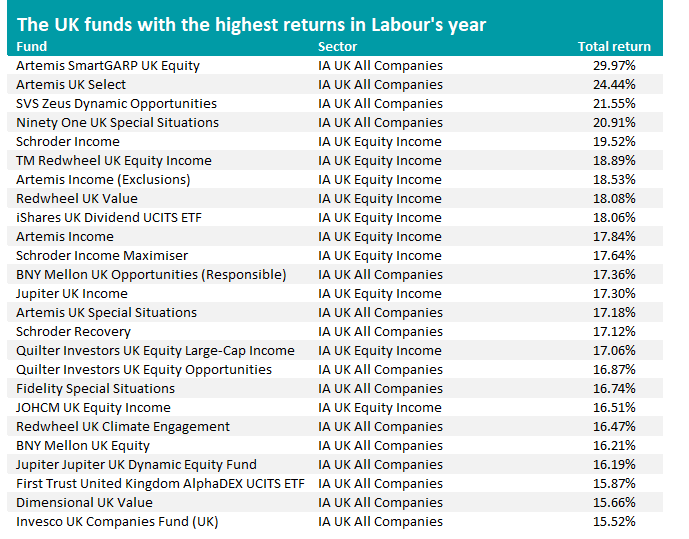
Source: FE Analytics
Of the 25 best-performing UK equity funds over the past 12 months, 15 of the top funds hailed from the IA UK All Companies sector, while the remaining 10 came from the IA Equity Income peer group.
A common thread among the top-performing funds is a clear tilt toward value strategies. In contrast, growth-oriented and small-cap approaches have been notably absent from the top tier of returns during the first year of the Labour government.
Top of the table is Artemis SmartGARP UK Equity, which posted a near-30% total return during the first year of the Labour government – stretching to 144.4% over five years. The fund has almost £880m in assets and a FE fundinfo Crown Rating of five.
Managed by Philip Wolstencroft, the value-focused fund has allocated 23.2% to banks, 9.4% to financial services and 8.9% to oil and gas. Top holdings include Barclays, GSK and Shell.
It has also delivered an annualised alpha of 10.8 over the past three years, with a beta of 0.77, suggesting it has consistently outperformed the market while taking on lower volatility.
Performance of fund vs sector and benchmark over 3yrs
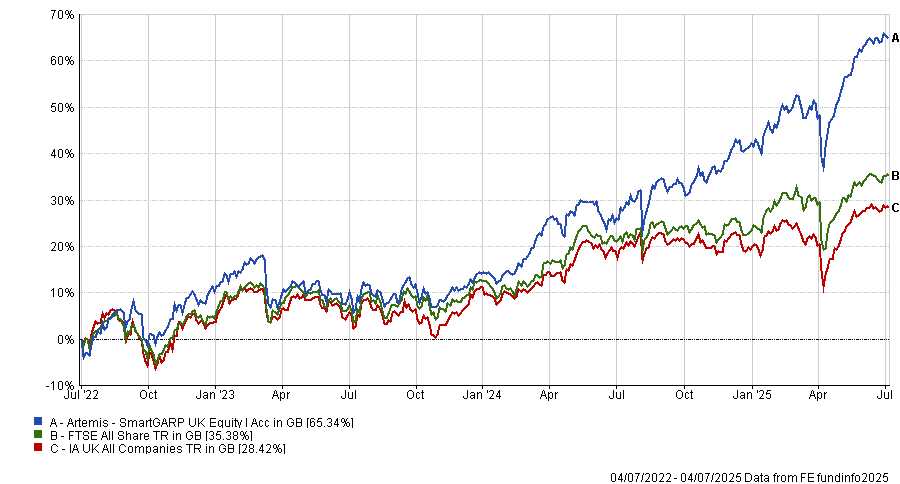
Source: FE Analytics
Also in the top five was Ninety One UK Special Situations, managed by Alessandro Dicorrado, with a 20.9% return over the same period.
Artemis Income, managed by Marsh and Adrian Frost, delivered a 17.8% total return between 4 July 2024 and 4 July 2025, securing a spot in the top 10 performers.
Just missing out on the top 25 in 26th place in the rankings was the first non-equity entrant – VT Redlands Property Portfolio. Targeting long-term capital growth, it returned 15.4% over 12 months and 12% over five years. Top holdings include TR Property Investment Trust and Legal & General Global Infrastructure Index.
The highest-ranking UK small-cap fund was WS Raynar UK Smaller Companies, which came in 53rd overall with a 12-month return of 11.9%.
Justin Oneukwusi, chief investment officer at St. James’s Place, said Labour’s “clear, pro-growth tone and a willingness to engage with business” has brought stability for both markets and investors.
Looking forward, he said: “Regulatory clarity from a growth-oriented government is essential as it gives businesses and consumers confidence, and encourages long-term investing. Leveraging regulation to support better investment decisions, particularly in the UK market, could unlock capital that fuels sustainable growth.
“However, markets also value fiscal credibility. Any move away from fiscal rules risks unsettling bond investors, especially at a time when global debt is rising and uncertainty is weighing on bond markets. Staying the course on fiscal discipline will help reinforce market confidence.
“Investors want predictability on regulation, on tax, and on the broader economic direction. Striking the right balance between reassurance and realism will be crucial. Recognising the role of the private sector in delivering growth will give the Government more levers to pull. In a volatile global landscape, the UK has a real opportunity to lead by creating the certainty that investors and businesses need to plan and grow.”
With a rollercoaster quarter behind us, Trustnet finds out which funds performed best over the past three months.
The second quarter of 2025 saw both a sell-off sparked by US president Donald Trump’s ‘Liberation Day’ tariffs and markets reaching record highs, but which funds made the best returns?
The Trump administration sent risk assets into freefall in April when it hit trading partners with higher reciprocal tariffs than investors were expecting, only to announce a 90-day pause. Stocks rallied in relief and have been climbing since.
Chris Beauchamp, chief market analyst at IG, said: “Equity markets, and investors themselves, have been on a remarkable journey in Q2.
“From the terrifying lows of April to the dizzying heights of the past week, the rebound has caught many by surprise. As we head into Q3, investors are still fretting about inflation and a possible recession, but these threats seem much less imposing than they did three months ago.”
Performance of Investment Association sectors in Q2 2025
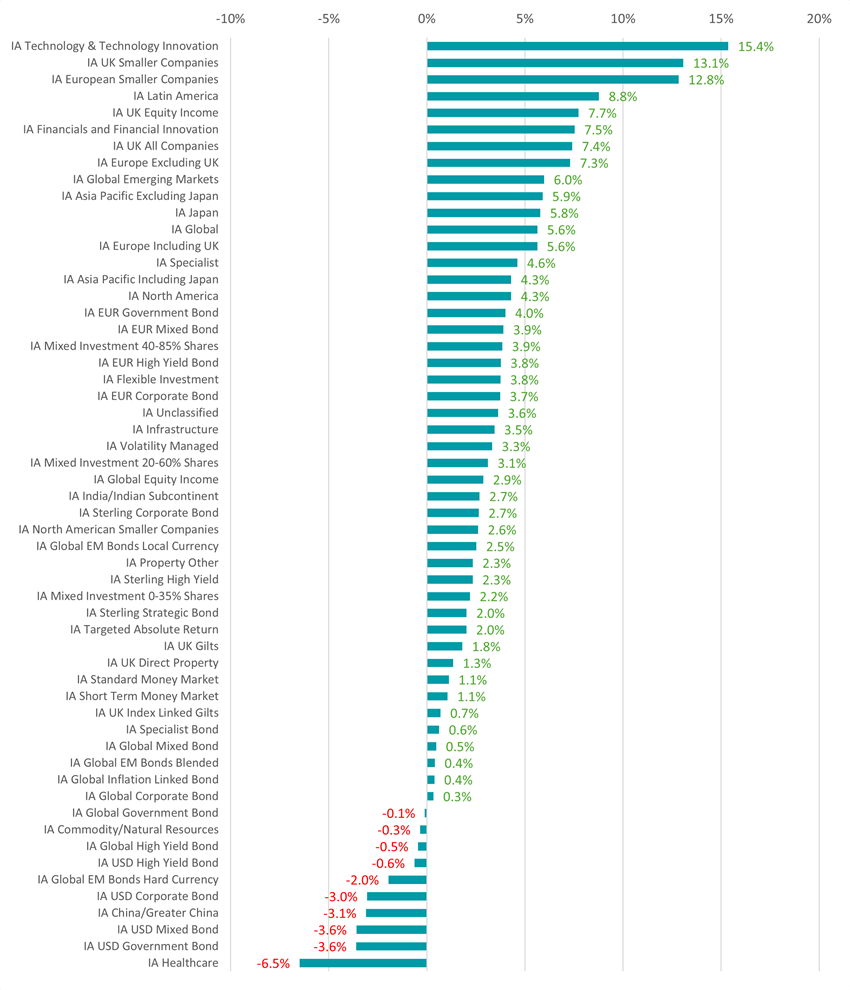
Source: FE Analytics
The chart above shows the average return of each Investment Association sector over the past three months, with IA Technology & Technology Innovation in the lead after making 15.4%. This did come, however, after an average loss of 11.1% in 2025’s first quarter.
Optimism returned after April’s tariff-induced dip as investors were encouraged by a combination of strong corporate results and easing trade tensions, which helped the Nasdaq rise to record highs.
The primary market catalyst remained AI and semiconductors. Market leaders like Nvidia and Microsoft delivered eye-catching returns, with Nvidia alone adding over 40% in the second quarter, driving large-cap tech performance.
Analysts also raised price targets on key chipmakers, citing expected continued demand for AI infrastructure.
UK funds had a resilient quarter, with the FTSE 100 hitting an all-time high of 8,884 on 12 June 2025.
Sterling had a strong quarter, climbing about 6% against the US dollar - its steepest quarterly gain since October 2022 - driven by optimism around a UK-US trade deal.
Mid-cap stocks also held up, with the FTSE 250 delivering its best quarterly return in more than four years. It gained 12.5% on robust domestic demand and fresh trade optimism.
At the bottom of the table is the IA Healthcare sector, where the average fund was down 6.5%. The peer group has struggled for some time, as recently examined by Trustnet, thanks to a mix of regulatory uncertainty, pricing pressures and persistent investor rotation.
Factors such as looming patent expiries (known as ‘patent cliffs’) and ongoing debate over drug‑price reforms have weighed heavily on sentiment. US policies expanding Medicare’s negotiating power and imposing international price comparisons have intensified concerns about future revenue and margins.
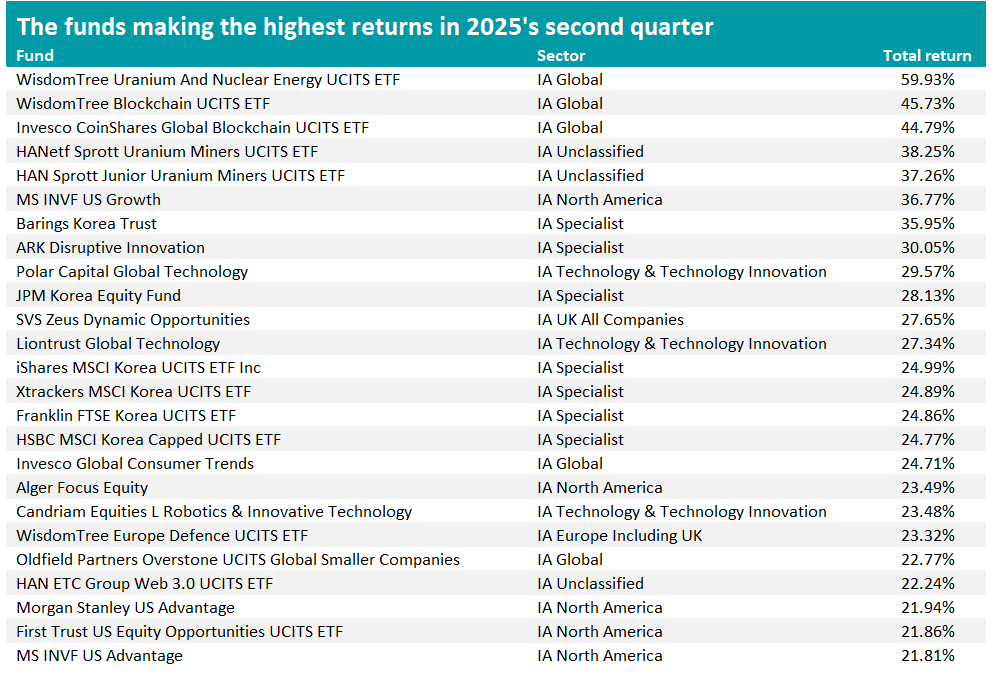
Source: FE Analytics
Turning to individual funds, the best performer was WisdomTree Uranium And Nuclear Energy UCITS ETF, up just under 60%, with HANetf Sprott Uranium Miners UCITS ETF and HAN Sprott Junior Uranium Miners UCITS ETF also appearing in the top five.
Uranium ETFs performed strongly as uranium prices climbed steadily through the quarter and equities linked to uranium production rebounded from earlier lows.
This rise was fuelled by a growing supply shortfall, with global uranium production unable to meet increasing demand from operating reactors. Output cuts by major producers further tightened the market.
Blockchain-themed ETFs such as WisdomTree Blockchain UCITS ETF and Invesco CoinShares Global Blockchain UCITS ETF delivered strong performance in Q2 2025 as the crypto market rebounded and investor appetite for blockchain technology gained momentum.
The rally in Bitcoin and other major cryptocurrencies (Bitcoin rose nearly 30% during the quarter) boosted confidence and buoyed ETFs focused on blockchain infrastructure and related equities.
South Korean equities – and funds like Barings Korea Trust - posted solid gains as foreign investors returned amid easing US trade tensions.
The rally gained further support from sweeping market reforms under president Lee Jae‑myung, including improved corporate governance, higher dividend incentives and the removal of a short-selling ban. These measures reduced South Korea’s ‘Korea Discount’ and raised optimism about the country being upgraded to developed-market status by MSCI.
Other themes include a strong showing from active US growth funds, outside of dedicated tech and blockchain strategies.
Funds like MS INVF US Growth, Alger Focus Equity and First Trust US Equity Opportunities gained over 20%, reflecting that large-cap US growth rebounded strongly. This aligns with Nasdaq’s record-breaking quarter and a rotation back into high-growth names after April's pullback.
European defence is another strong market theme at present. The WisdomTree Europe Defence UCITS ETF made 23.3% in the second quarter while growing to $3bn in assets in just three months after launch.
Core European defence stocks, such as firms like Rheinmetall, Thales and Leonardo, have benefited from rising order books and government spending commitments. Market sentiment was further boosted by the German and EU-wide budgetary shifts, particularly Germany’s massive procurement spending and the EU’s Readiness 2030 plan proposing up to €800bn in collective defence investment.
Broader structural support came from policy moves including NATO’s new pledge to raise European defence spending to 5% of GDP by 2035, Germany’s easing of debt rules and the European Commission’s industrial strategy to rearm Europe.
Trustnet highlights the best-performing funds in a losing sector over five years.
China has long been a market of extremes, capable of dazzling highs but equally steep setbacks. The past five years have tilted firmly toward the latter, as Covid lockdowns, geopolitical tensions and an ongoing tariff war with the US sapped investor confidence.
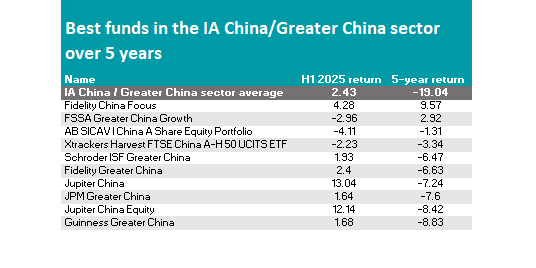
The IA China/Greater China sector spent much of that period among the worst performers in the Investment Association universe and those who invested five years ago are now sitting on 19.7% losses on average.
But the past 12 months have brought signs of recovery, with the peer group gaining 14.9% amid renewed investor interest. Because this volatility can be hard to stomach for many investors, it is important to choose funds that offer a smoother ride or even defy the wider market’s direction.
Data from FE Analytics shows that only two China funds have managed to stay afloat with positive returns during the market’s most turbulent years, from July 2020 to today: Fidelity China Focus and FSSA Greater China Growth.
Performance of fund against index and sector over 1yr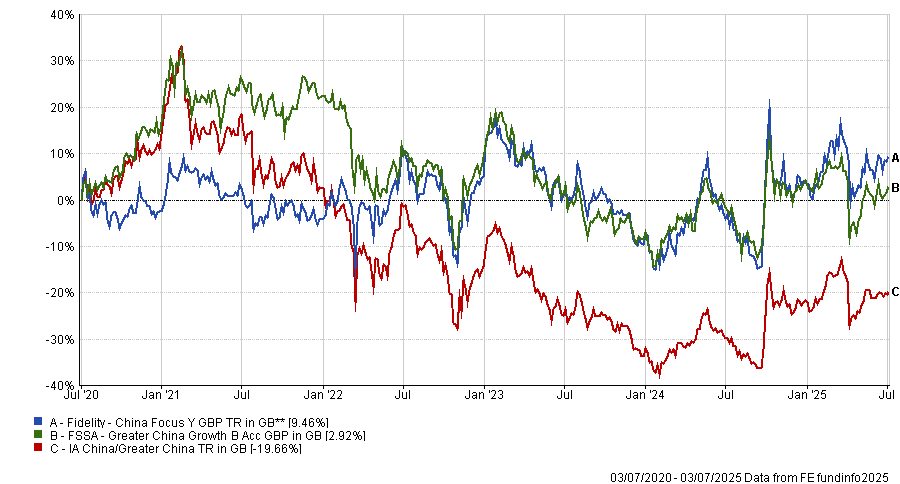
Source: FE Analytics
Fidelity China Focus is a $2.3bn strategy managed by Jing Ning and Nitin Bajaj, who invest at least 70% of its portfolio in China- and Hong-Kong-listed companies, as well as non-Chinese companies which do most of their business in China.
It picks stocks with a bottom-up approach and a value bias.
What sets it apart – and enables it to perform independently of its sector – is its quality-value approach in a sector that RSMR analysts said is “dominated by growth”, as well as its “non-mainstream, benchmark-unaware exposure” and the “under-researched companies” it holds.
Its top-10 positions include well-known names such as technology and entertainment conglomerate Tencent (8.7%) and e-commerce retailer Alibaba (8.2%), but the rest of the portfolio is skewed towards mid-caps, including a number of plays in the consumer discretionary and financials sectors.
Fidelity China Focus suffered in the 2020 calendar year, when it ranked at the very bottom of its sector with a -3.9% return, but the losses were much more contained in 2021 and 2023 and performance was positive in 2022, adding 10% while its average peer was down 15.7%.
“The value bias of the fund can lead the fund to lag in markets where growth companies outperform,” RSMR analysts explained. “In addition, the focus on high-quality companies can mean the fund underperforms when low-quality companies are rewarded by the market.”
This isn’t the only Fidelity strategy in the list of the IA China/Greater China sector’s best performers, with Fidelity Greater China also making an appearance a few positions behind, as shown in the table below.
Source: FE Analytics
The only other fund in the black was the £407.5m FSSA Greater China Growth fund, co-managed by FE fundinfo Alpha Manager Martin Lau and Helen Chen, who invest primarily in large- and medium-sized companies based in or with significant operations in China, Hong Kong or Taiwan.
“The fund is a lower-risk option for investors seeking exposure to Chinese equities,” RSMR analysts said. “The managers’ contrarian nature makes this fund somewhat differentiated to a passive option as it tends to be underweight some of the largest stocks and sectors in the [MSCI Golden Dragon] index and often focuses on contrarian growth opportunities outside of the mega-caps.”
Tencent is the largest holding (9.6%), followed by Taiwan Semiconductors (8.1%); further down the list, Chinese consumer companies make up a quarter of the portfolio.
“The domestic China consumption story will be important to the fund over the longer term and whilst this will be cyclical at times it should grow over the medium term as China continues to catch up with more developed economies,” RSMR said.
To the analysts, this is a satellite investment option with a key differentiator in its “strong emphasis on downside protection, limiting volatility versus other China mandates”.
FSSA Greater China Growth has remained in the first quartile of performance against the peer group in all calendar years between 2021 and 2023, but slipped more recently, with 10.7% return in 2024 versus a sector average of 14.5%.
Another standout name was JPM Greater China, which in the past five calendar years, never fell to the bottom quartile of performance; a feat also achieved by three smaller strategies: Jupiter China Equity, GAM Multistock - China Evolution Equity and Polar China Stars.
Co-manager Finn Provan explains what was learnt from not downsizing UnitedHealth Group.
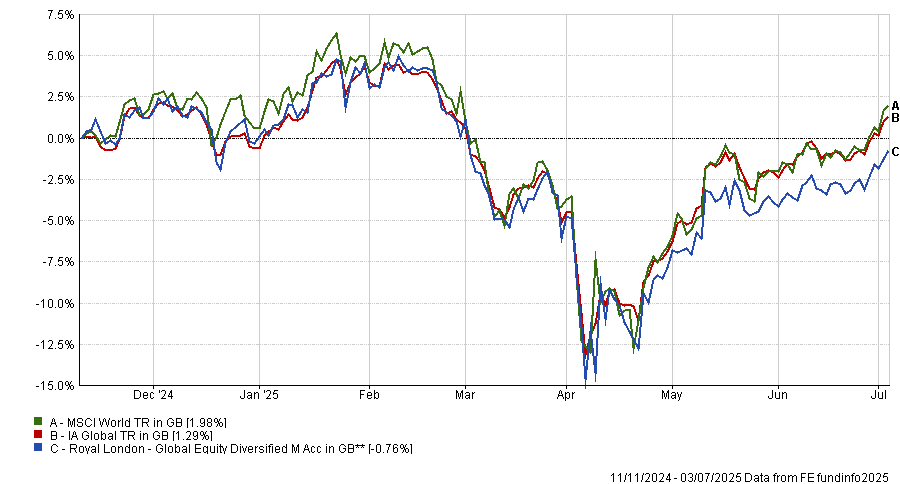
No team of fund managers should ever be entirely bullish on even their highest conviction holding, according to Finn Provan, co-manager of the £6.1bn Royal London Global Equity Diversified fund.
While a high-conviction process can be praised, even talented managers can make mistakes. For Provan, the biggest example over the past year was UnitedHealth Group, a stock that “everyone in the room was bullish on” going into the year.
This meant that when the stock slid dramatically following the death of the chief executive of one of its subsidiaries in December, the team did not move to downsize it fast enough, convinced that the market would correct itself.
When UnitedHealth Group instead dropped 45%, its high allocation dragged Royal London Global Equity Diversified down. While the team would have never sold out of it entirely, not bringing it down fast enough was a mistake, she explained.
“Poor year-to-date performance is really a story of UNH,” she said.
While Provan has been on the fund as an analyst for over five years, she became co-manager when Matt Kirby and Paul Schofield officially took over Royal London Global Equity Diversified in November last year, following the departure of Peter Rutter and his team.
Performance of Royal London Global Equity Diversified vs the sector and benchmark under new managers
Source: FE Analytics.
Below, Provan explains why the quantitative approach makes it a suitable all-weather portfolio, how the ‘benchmark relative’ approach can still provide value in a world of passives and why some of their favourite opportunities are in areas people have never heard of.
What is Royal London Global Equity Diversified’s philosophy?
It’s a fund of data-enabled stock-picking. We’re a team of sector and regional generalists equipped with data to filter the noise and find good stocks.
We want to maximise stock-specific returns and minimise factor risk through an almost 200-stock portfolio. We believe that you can make a good investment in a company at any stage of its corporate life cycle by using data.
What differentiates the fund?
Because it’s a very balanced portfolio of stocks, we want it to function as something of an all-weather portfolio, which you don’t need to chop and change depending on macro events or whether we’re in a growth or value market.
We’re a benchmark relative approach, but we’re not narrative-driven. Because of our methodology and data tools, we have clear ideas of what makes a good company based on where it is in the corporate life cycle. We want to stick to that, instead of letting ourselves get distracted by news and narratives.
Why should investors use a benchmark relative approach instead of a passive?
The way we think about it is that we don’t want to replicate the benchmark’s performance; we want to replicate its risk profile. So, for example, we want our allocation to European banks to match the risk profile of European banks within the index.
But within that, we want to let the stocks do the talking, so if there’s a company within a sector that we think is strong from a wealth creation standpoint or a valuation perspective, we want to push that to be a slight overweight to show we have conviction in those stocks. The allocation can be similar, but we want the stocks to look quite different.
The performance target is 1-2% ahead of the benchmark and we used to get even better than that, but we’ve only got a tracking error that is also only about 1-2%. We think we manage our risk similarly to the benchmark by not taking factor risk, but can still be the active stock pickers we say we are.
What you want is to be getting active style returns, because it’s a stockpicker portfolio, with passive levels of risk.
How do you find new opportunities?
We have a few considerations: we like to look where we haven’t looked in a while, what sectors have changed since the last time we looked, what areas have momentum and what the fund needs to balance its risks.
We call it turning over rocks. We have 6,000 companies we can invest in and over three years we want to have turned over all those rocks, brushed over them to make sure we’ve not missed anything.
I think for me, the perfect situation is where we look at a certain subsector and find companies that make their cash in a similar way to bigger companies, but that aren’t even in the benchmark.
For example, we own a Japanese Pachinko machine maker that’s up 350% since we bought, but it's unlocking its balance sheet and giving cash back to shareholders. We always aim to have those idiosyncratic stocks within the portfolio.
What was your best call over the past year?
The best call was probably selling Delta Airlines in early Q4 last year. It was bought in 2022 based on the assumption that it was a turnaround company that could benefit from the post-Covid period.
We made the call that the turnaround story had happened and we sold it when it was still up over 100% for us, right before it slid massively at the start of the year.
What do you do outside of fund management?
I like reading! I’m in several book clubs and I’m a massive fan of anything written by Toni Morrison, Joan Didion or Gabriel Garcia Marquez.
Other than that, I’ve gotten into running, but I suppose that’s because everyone else on the team is always running marathons.
The government’s reported plan to lower the cash ISA limit misunderstands why people choose cash and risks pushing them into investments they’re not ready for.
You don’t create confident investors by limiting their choices. You create them by helping them understand what they’re doing.
The government wants more people to invest. That’s the motivation behind its apparent plan to slash how much individuals can save in cash ISAs, possibly cutting the current £20,000 allowance to as low as £5,000. The goal is to shift more capital into equities and other long-term assets, particularly in the UK.
But restricting access to a product that people understand and trust won’t solve this problem. Savers aren’t holding cash because they haven’t been nudged hard enough. They’re holding it because cash is simple, stable and, crucially, they understand it. Strip away that option and you create uncertainty, rather than unlock investment.
For pretty much every saver, cash isn’t a speculative asset but peace of mind. It’s what they turn to when the boiler breaks, when they lose work or when they’re saving for something real and tangible: a deposit, a car, a wedding. It’s a buffer against the unknown.
Cash doesn’t demand technical knowledge. It doesn’t fluctuate. And unlike investing, it doesn’t punish you for checking your balance. That clarity and control matters, especially to people who’ve had to fight for financial stability.
Yes, returns on cash are limited. But in today’s market, with interest rates around 5%, many see it as good value for low risk. That’s a rational, informed trade-off.
That means moving from saving to investing isn’t simply about shifting accounts. It’s about entering a system that’s inherently more complex.
Most people aren’t taught how markets work. They don’t learn about risk-adjusted returns or how to weigh volatility against time. They just know that investments can lose money and that they don’t want to make a mistake they can’t afford.
The choice paralysis is real. There are thousands of funds, platforms and portfolios. Many sound similar. Some are low-cost and diversified; others are high-fee, opaque and ill-suited to beginners. But the difference between a good choice and a poor one often only becomes clear years later.
We’ve built a system that expects people to act like investors without equipping them to think like investors. That gap – between access and understanding – is where risk becomes harm.
The vast majority of retail savers will never pay for financial advice. The cost doesn’t make sense for small portfolios. DIY platforms fill part of the space, but most can’t offer tailored recommendations without breaching regulation. So users get filters, charts and disclaimers, but no clear direction.
This leaves people trying to make investment decisions alone, without context and without confidence. They’re right to be hesitant.
When ISA rules were changed in 2014 to allow more investment flexibility, uptake didn’t surge. Most savers just kept doing what they were doing.
The impulse behind the cash ISA cap is understandable. UK companies need more domestic capital. Long-term investing can build wealth. But capital isn’t passive: it follows trust and it follows understanding.
Remove the familiar structure of cash ISAs and people won’t automatically move into markets. Some may just leave their money outside the ISA wrapper. Others might disengage entirely, afraid of making the wrong call.
But if someone is nudged into investing before they’re ready and ends up taking a loss, that lesson won’t teach them to be smarter – it’ll teach them not to come back.
If the government wants more people to invest, it needs to focus less on restricting behaviour and more on building capability. That means treating financial education as a long-term priority, not a footnote.
We need a public that understands the difference between cash and risk assets, knows how to assess basic investment options and feels confident about long-term strategy. Until that foundation is in place, changing the rules around ISAs won’t move behaviour in any meaningful or lasting way.
Because investing isn’t intuitive. It’s not the same as saving and it’s not something people fall into just because a tax rule changes.
The goal of widening participation in capital markets is a good one but – while there’s merit in nudge theory – savers deserve better than a push. They need the tools to choose for themselves and the confidence to know what they’re choosing.
Pushing people toward risk without equipping them for it is potentially ineffective and harmful. Policymakers should take note: trust in financial markets is hard-won and easily lost. If the aim is to build a nation of investors, it must begin with education, not coercion.
Gary Jackson is head of editorial at FE fundinfo. The views expressed above should not be taken as investment advice.
Experts identify UK equity funds with long-term potential for a variety of risk appetites.
UK equity funds targeting smaller companies, dividend payers and value stocks are among those that fund pickers expect to outperform if the UK market continues to perform strongly.
After years of underperformance, the domestic market is staging a comeback.
As investors have struggled to get to grips with trade volatility stemming from the White House, formerly top-performing markets such as the S&P 500 have struggled. Meanwhile, the UK has rallied as investors have pivoted out of the US, with the FTSE All Share surging by 9.4% this year, one of the better developed market results.
Performance of indices year to date
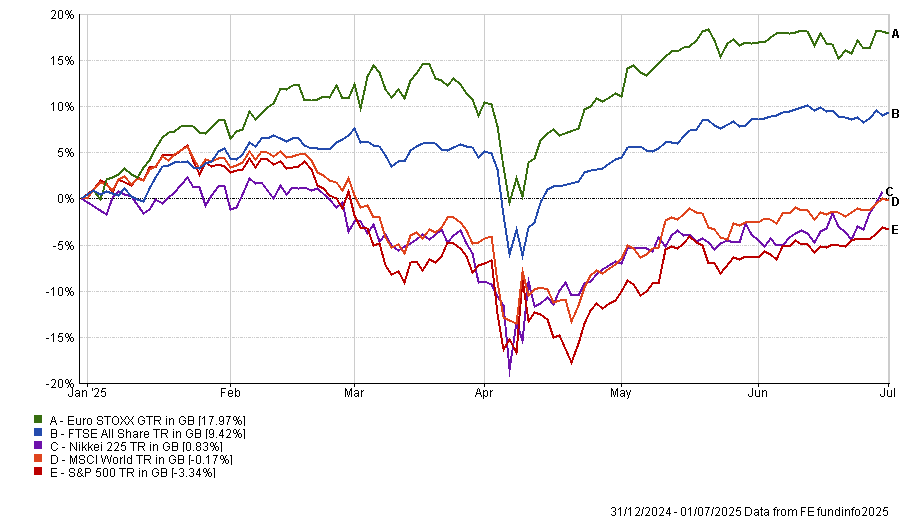
Source: FE Analytics. Total return in sterling.
For some managers, this could signal the start of a genuine long-term rally for the UK market. Below, experts identify funds that have already benefited from the recent rally and might be poised to continue outperforming.
Jack Driscoll, fund analyst at FE Investments, highlighted George Ensor’s RGI UK Listed Small Companies fund, saying: “The UK market rebound has finally rippled down to smaller companies.”
This has benefitted this strategy, which invests 80% of its capital in the smallest 10% of the market. As a result, Ensor’s fund is up by 6.5% so far this year, beating the average peer in the IA UK Smaller Companies sector.
Performance of RGI UK Listed Small Companies vs the sector and benchmark year to date
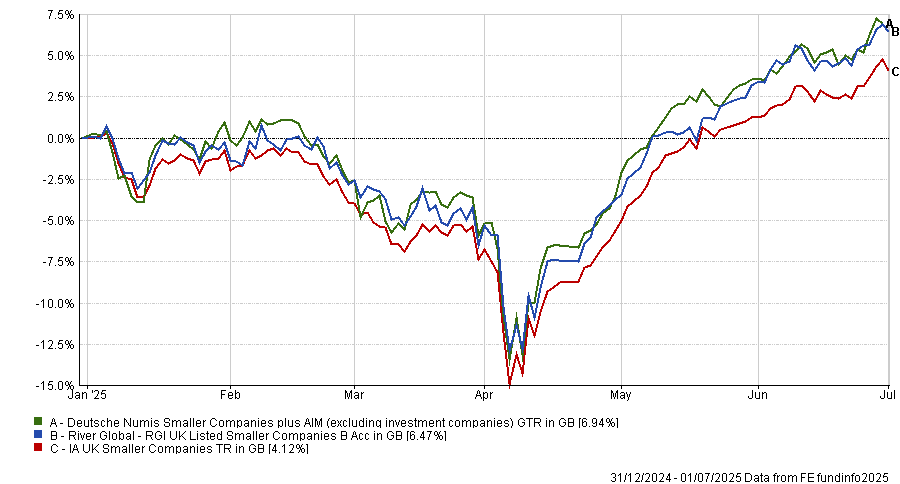
Source: FE Analytics. Total return in sterling.
Driscoll added that RGI UK Listed Small Companies has a large weighting in cyclicals, which “gives direct exposure to the domestic economy”. This has been a tailwind this year as the Bank of England has entered a gradual rate-cutting cycle, benefitting the fund’s 14% allocation towards financials.
Its 70-stock book is another advantage because it “leaves headroom to top-up outperformers without adding concentration risk”. This allows Ensor to run his winners if optimism towards the UK persists.
However, because it is targeting the smallest companies at an already volatile market capitalisation, it is most suitable as a satellite holding for investors. This added volatility means the fund would be most suited for investors with a higher level of risk appetite and at least a five-year time horizon, Driscoll explained.
For an alternative that could suit both growth and income investors, Paul Angell, head of investment research at AJ Bell, identified Henry Dixon’s Man Income fund.
The fund targets UK companies across the market cap spectrum that are paying a yield in line with or better than the market average, he explained.
“Their investment process centres on identifying two types of stocks: those trading below their replacement cost (i.e. what it would cost today to replace a company's assets and operations) that are also cash-generative; and those where the market appears to be undervaluing profit streams,” Angell said.
There are plenty of undervalued and unloved companies in the UK, giving the fund a broad opportunity set, he noted.
This has allowed Man Income to benefit from the recent rally, narrowly beating the FTSE All Share, as seen below. Despite strong returns, it “remains cheaper than the market on a circa 10x price-to-earnings ratio”.
Performance of Man Income vs the sector and benchmark year to date
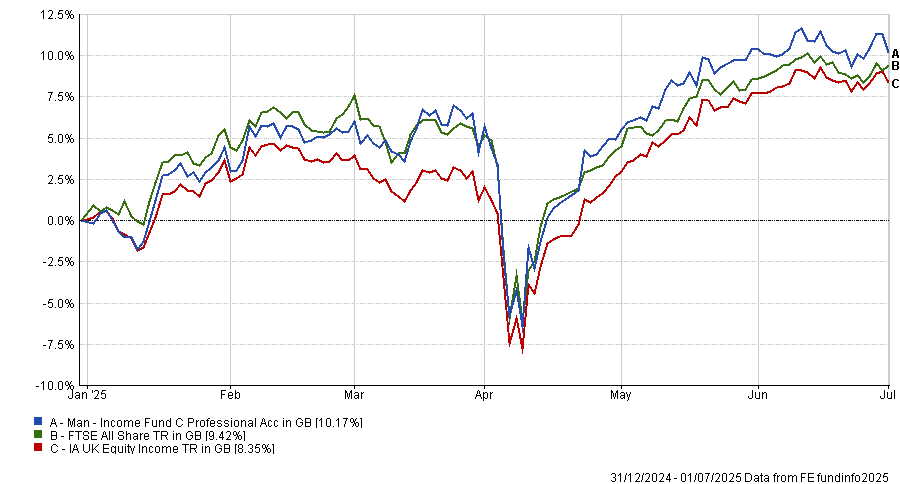
Source: FE Analytics. Total return in sterling
Long-term returns are also strong, with the fund posting top-quartile results in the IA UK Equity Income sector over the past three-, five- and 10-year periods.
In terms of risk tolerance, Angell suggested that a low allocation would suit more cautious investors.
Finally, Forvis Mazars’ associate investment governance director and model portfolio manager James Rowlinson pointed to Jupiter UK Dynamic Equity.
While he accepted there was initial uncertainty about the strategy after manager Ben Whitmore departed last year, new manager Alex Savvides has “set the fund up for future success”.
Jupiter UK Dynamic Equity's value tilt has been a benefit this year as investors have pivoted away from growth towards more defensive and cautious stocks. Improving sentiment towards the UK and a rotation away from the US has naturally boosted the valuation of bargain stocks.
Additionally, Savvides has made beneficial changes to the overall approach. Instead of just taking good value stocks, he has emphasised overlooked names with improving outlooks, which have significant rerating potential.
Already, this change in strategy is paying off, with names such as Burberry and ConvaTec surging this year on the back of improved sentiment. As a result, it has made a top-quartile return in the IA UK All Companies sector, beating the UK market by around four percentage points.
Performance of Jupiter UK Dynamic Equity vs the sector and benchmark year to date
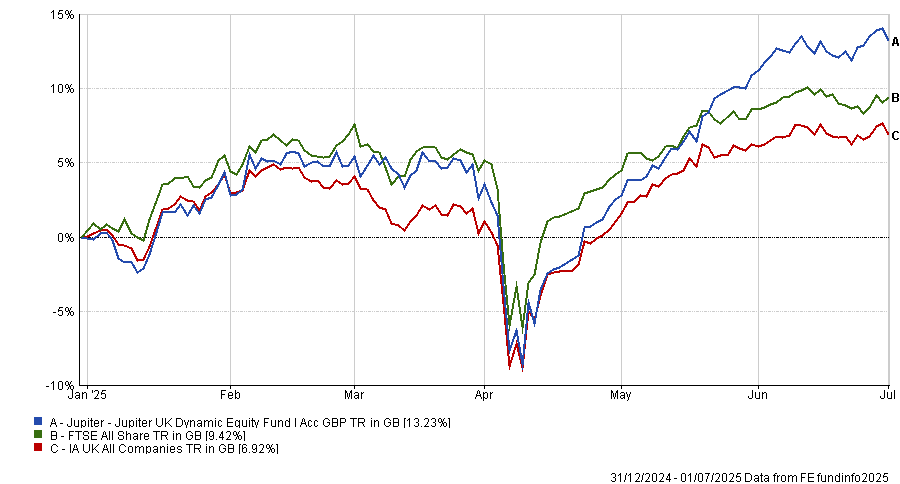
Source: FE Analytics. Total return in sterling.
While the fund can in theory go anywhere on the UK market, it has a slight tilt towards mid-caps and a beta of more than one. As a result, investors should treat it as a source of diversification in a balanced portfolio, by pairing it with another fund that has a complementary style, Rowlinson concluded.
Analysts at AJ Bell explain why private equity has not driven takeover attempts this year.
Out of nearly 50 takeover attempts involving UK-listed companies so far this year, trade buyers – typically firms operating in the same or a related sector as their targets – have accounted for almost half (21), according to data from AJ Bell.
This runs counter to the prevailing narrative that private equity is the dominant force in UK takeovers. In reality, private equity has been far less active than expected in 2025.
“Private equity companies haven’t been as prolific or successful with UK takeovers this year as their reputation implies,” said Dan Coatsworth, investment analyst at AJ Bell.
Bids this year have included high-profile names, such as food delivery group DoorDash’s successful £2.9bn bid for rival Deliveroo in May. In March, Tesco food supplier Bakkavor agreed to a £1.2bn bid from rival Greencore.
Trade bids in H1 2025
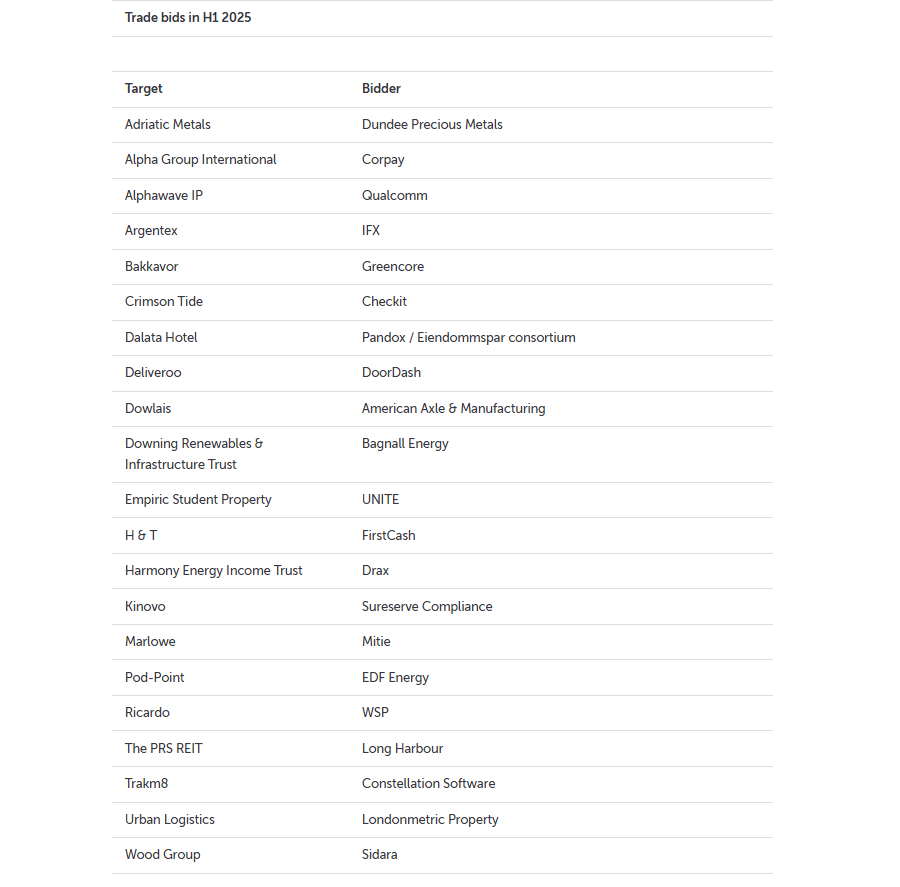
Source: AJ Bell. Company announcements
Some businesses also chose to put themselves on the market. For example, hotel business Datala put itself up for sale in March, “effectively saying it didn’t suit being a listed company because it was much smaller than quoted peers, it was undervalued, and the shareholder base was concentrated”.
The rise of trade buyers this year was attributed to their time horizon and willingness to take a long-term approach. “Trade buyers will take a long-term view of a company’s potential worth, and they are often happy to pay a fair price”.
As a result, they will try and buy a business that may remove a major competitor from the market or open the door to a new geography, as demonstrated in the deals above.
By contrast, private equity firms – while still actively bidding for high-profile companies, such as Advent’s failed £3.7bn bid for industrials group Spectris in June – had a far more limited presence int the market.
Private Equity bids in H1 2025
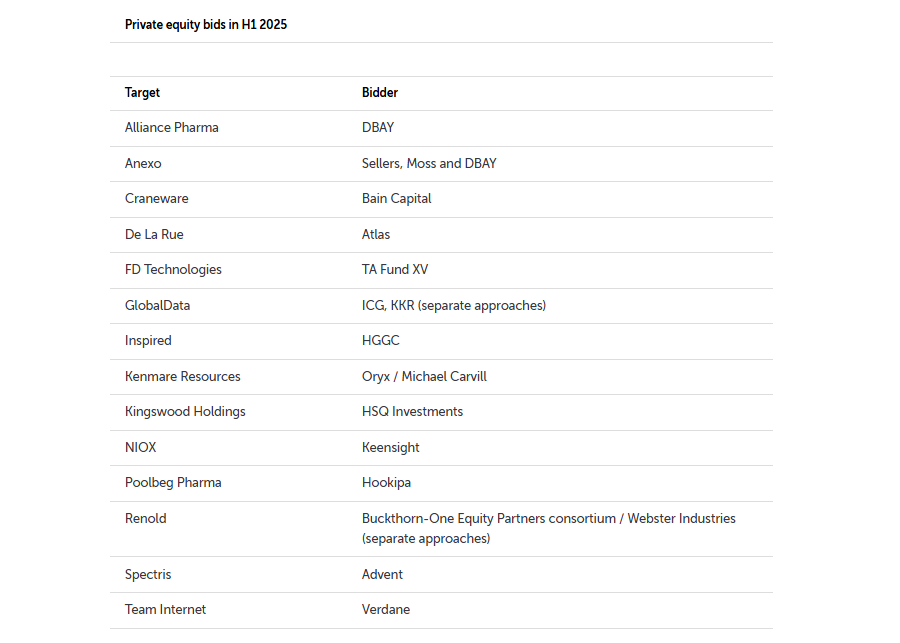
Source: AJ Bell. Company announcements
There are 14 private equity bids in the chart above, compared to the 21 trade bids over the same period. Of these, five ended up failing, including KKR’s earlier attempt to target analytics company GlobalData.
“It’s easy to suggest private companies are behind most bids, yet data tells a different story,” said Coatsworth.
This is a sharp departure from this time last year, when experts suggested ‘clever money’ from private equity bidders was behind a wave of mid-cap takeovers.
The lack of activity from private equity this year is not an issue of funding because the industry is “awash” with cash, Coatsworth noted.
Trade and tariff uncertainty could be playing a role, with private equity companies perhaps pausing investment due to the misty outlook in the same way as public companies. “If they are going to spend big bucks, they will want confidence in the geography, industry and corporate profit potential.”
Secondly, he argued private equity firms' risk appetites have dwindled. They want companies that make good money currently rather than ones that might be profitable in the future, in contrast to trade buyers. Private equity wants to be able to “flip an acquisition within three to five years at a profit” and they may be struggling opportunities that fit that bill.
Finally, “private equity firms often look for missing pieces of the puzzle”. They generally aim to acquire businesses that can be combined with other companies in their portfolio to create a larger entity they can sell on. He added: “The UK market might not have the sort of characteristics they are looking for.”
However, private equity firms and trade buyers are hardly the only people behind this year’s merger and acquisition activity.
Investment trusts were responsible for seven bids this year as part of the recent “takeover frenzy” in investment trusts. Several vehicles below £200m have been realising they need to merge or wind up, and with high-profile campaigns by activist investors such as Saba, many trusts have started making offers to “gobble up” some of their competitors.
This has included high-profile mergers such as the recent £2.1bn deal between Fidelity European and Henderson European Trust.
JP Morgan Asset Management’s Hugh Gimber explains how to put cash to work in today’s market.
Forecasting the economy and markets can be hard at the best of times, let alone when policy is changing so rapidly.
Today, however, uncertainty is not just a descriptor of predicting challenges; it is actively influencing the US economy. CEOs face a choice: make major hiring or investment decisions now or ‘wait and see’ for a few months, in the hope that greater clarity will emerge.
While sentiment has improved somewhat recently, US businesses following April’s tariff announcements highlighted hesitancy to invest as great as during the depths of the Covid-19 pandemic in April 2020. We expect this temptation to pause decision making to weigh on growth ahead.
For the Federal Reserve, life would be relatively straightforward if the only uncertainty was around downside risks to growth. Interest rates could be cut pre-emptively to guard against the risk of recession.
Yet with tariff-related price pressures likely to emerge in the coming months, the situation is clearly not that simple. Like CEOs, Fed chair Jerome Powell is quite rightly opting to be patient in planning his next policy move.
Businesses, not investors, can afford to wait and see
Investors do not have the same luxury of simply hitting pause. With inflation eroding the purchasing power of cash, there is a clear need to put cash to work. And of course, if investment decisions are only taken at times when uncertainty is low, it is likely that markets will already have efficiently priced in what is to come.
It is therefore imperative to focus on strategies that can perform well in multiple states of the world. Today we see five themes that will help investors thrive in these unstable times.
First and foremost, within equity markets, regional equity diversification is arguably more important today than at any point since the global financial crisis. After an incredibly strong run for US equity markets, we believe that, unlike the last 10-15 years, investors will see better risk-adjusted returns ahead from being well regionally diversified than from running concentrated US portfolios. With the US economy appearing somewhat less exceptional, and with new fiscal stimulus improving Europe’s medium-term growth outlook, the gap in earnings between the two regions is likely to narrow.
Second, we expect income-oriented strategies to prove relatively defensive if volatility picks up again. Dividend growth is typically more resilient than earnings growth, and with corporates pulling back from capex, this resilience may be even greater than usual if earnings do slow.
Diversifying the diversifiers
Third, for the more defensive aspects of a portfolio, government bond markets have been caught in a tug of war for the last two years. When growth concerns have come to the fore, bond yields have fallen in anticipation of more central bank easing ahead. Yet these rallies in bond prices have not been sustained, with the market still wary of inflation risks, and governments around the world keen to hit the fiscal accelerator.
While we expect some of this volatility in bond yields to persist, core bonds absolutely deserve their place in providing income and downside protection against a growth shock. UK gilts appear better positioned than their regional peers, given a relatively weak growth backdrop and a UK government that is much more constrained by its own fiscal rules.
Our fourth theme focuses on investors needing to consider diversification against the global economy proving too hot rather than too cold. Rising trade barriers threaten a classic negative supply shock, at a time where fiscal policy is already taking a more expansionary turn.
While 2022 may be a year that many investors are keen to forget, it also provides a helpful template for how markets may respond to an inflation shock.
Alternative assets, and core real assets in particular, provided the best places to hide in a period where stocks and bonds sold off simultaneously. For investors unable to access less liquid strategies, commodities, macro hedge funds and large cap UK equities were also relatively resilient. In a world where inflation and growth risks are more evenly balanced, these alternative tools are an increasingly essential part of a well-diversified portfolio.
Finally, currency considerations cannot be overlooked. Since 2010, the FX exposure of unhedged US assets has provided something of a ‘free lunch’. US dollar appreciation has added an additional 1.9% per annum for sterling investors, while also often providing a diversification benefit during risk-off periods. With the US dollar’s safe haven status no longer as solid, a different balance of currency risks may be required.
By focusing on strategies that perform well in various scenarios, investors can position themselves to succeed amidst the complexities of today's global economy. Establishing stable foundations for an unstable world will therefore be crucial.
Hugh Gimber is global market strategist at JP Morgan Asset Management. The views expressed above should not be taken as investment advice.
New Junior ISA rate to also apply from mid-July.
National Savings and Investments (NS&I) has launched new issues of its two, three and five-year British Savings Bonds today, offering savers fixed interest rates across both Guaranteed Growth and Guaranteed Income Bonds.
In addition, NS&I’s Junior ISA will offer 3.55% AER tax-free to savers under the age of 18 – marking the first interest rate change since 18 August 2023 (4% AER).
The rates across growth and income for two, three and five years are illustrated in the table below.
|
Product |
Previous interest rate (from 15 April 2025) |
New interest rate from 3 July 2025 (on general sale) |
|
Guaranteed Growth Bonds 2-year (Issue 74) |
4.00% gross/AER |
3.85% gross/AER |
|
Guaranteed Income Bonds 2-year (Issue 74) |
3.93% gross/4.00% AER |
3.79% gross/3.85% AER |
|
Guaranteed Growth Bonds 3-year (Issue 76) |
4.10% gross/AER |
3.88% gross/AER |
|
Guaranteed Income Bonds 3-year (Issue 76) |
4.03% gross/4.10% AER |
3.82% gross/3.88% AER |
|
Guaranteed Growth Bonds 5-year (Issue 68) |
4.06% gross/AER |
3.84% gross/AER |
|
Guaranteed Income Bonds 5-year (Issue 68) |
3.99% gross/4.06% AER |
3.78% gross/3.84% AER |
|
Product |
Previous interest rate (from 18 August 2023) |
New interest rate from 18 July 2025 |
|
Junior ISA |
4.00% AER (tax-free) |
3.55% AER (tax-free) |
The one-year British Savings Bonds remain unchanged at 4.05% gross/AER for growth and 3.98% gross and 4.05% AER for income.
Andrew Westhead, NS&I retail director, said: “Today’s announcement is in response to changes in the wider market and will ensure we continue to offer a range of fixed-term options while balancing the interests of savers, taxpayers and the broader financial services sector.”
These bonds are fixed-term savings accounts with guaranteed returns that are available for savers with a minimum investment of £500.
The Murray Income trust is facing a “surprise” strategic review launched to improve long-term returns and address a persistent discount.
The board of the £931m FTSE 250-listed trust managed by Aberdeen said it would examine a range of options with the aim of boosting shareholder value, while continuing to deliver an attractive yield.
This follows a “detailed evaluation of performance”, which the board said has been "below expectations for some time".
Performance of trust against index and sector over 1yr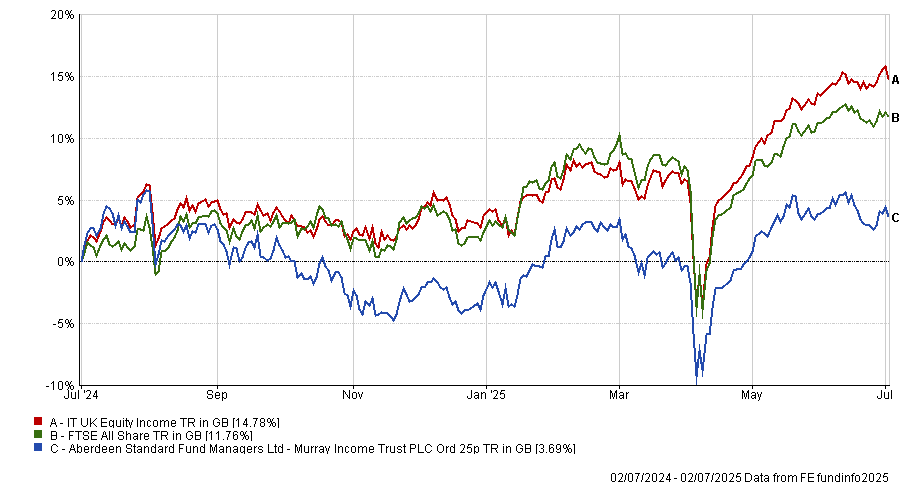 Source: FE Analytics
QuotedData’s James Carthew described the announcement as a surprise, noting that last year’s annual report contained no direct criticism of the trust’s performance.
He highlighted that the trust currently trades on a 10.3% discount, which is unusually wide for a large-cap income-focused vehicle. “That sort of level is bound to attract attention from discount-driven investors,” he said. Emma Bird, head of investment trust research at Winterflood, noted that Murray Income’s discount has averaged 9.3% since the start of 2023, which is currently the second-widest in its peer group.
When it comes to performance, the trust has ranked last among its 18-strong UK Equity Income peer group over the past year, underperforming the sector-leading Temple Bar Investment Trust by more than 20 percentage points. It also sits close to the bottom of the fourth quartile over both three and five years.
Bird welcomed the board’s decision to act, as strategic reviews have been increasingly prevalent in the investment trust sector in recent years, particularly among smaller, sub-scale funds.
“This is clearly not the case for Murray Income, which has a market cap of over £800m, but we commend the board for seeking to address the other issues facing the fund,” she said.
A merger could be "a plausible outcome", she added, particularly in a crowded sector where more than half of the trusts have market caps below £500m. Bird pointed to the possibility of a combination with one of Aberdeen’s other UK equity income mandates – Aberdeen Equity Income, Dunedin Income Growth or Shires Income – all of which are smaller and trade on tighter discounts or small premiums.
The board said it would make further announcements in due course.
The managers of Credo Dynamic redeployed capital from REITs into hedge-fund-style strategies.
The managers of the multi-asset Credo Dynamic fund have rotated out of real estate investment trusts (REITs) and into long/short alternatives this year, as narrowing discounts and takeovers shrank the opportunity set in listed property.
A range of hedge fund-style strategies have become the main beneficiary of the shift, with three new positions added to boost diversification and improve risk-adjusted returns.
“A couple of months ago, our big bet was investment trusts and REITs. We saw big opportunities in the discounts and that was a major differentiator for us over the past year,” said fund manager Ben Newton.
“But now that’s starting to tail off. Discounts have narrowed, peers have exited, or some holdings have been taken out altogether. There have been several takeovers – Harmony, Assura and Urban Logistics REIT just to name a few. So now, we’re seeing fewer opportunities in that space.”
At their highest, REITs made up 9.5% of Credo Dynamic; now that’s closer to 4.5%.
Newton and lead manager Rupert Silver are now seeing fewer opportunities across the board, and therefore added to a set of long/short strategies (which seek to profit from stock gains in their long positions as well as price declines in short positions).
“Long/short funds have essentially no correlation to equities, a big positive for us,” said Newton.
Their choice went to three strategies run by AQR Equity Market Neutral, Alternative Trends and Delphi Long/Short.
“AQR Equity Market Neutral uses 500 characteristics to screen positions – a kind of algorithm-led, AI-style approach. It’s very different from what we could do in-house, so we’re happy to allocate to a manager with strong intellectual property and a solid (albeit short) track record,” he continued.
Performance of funds against sector over 1yr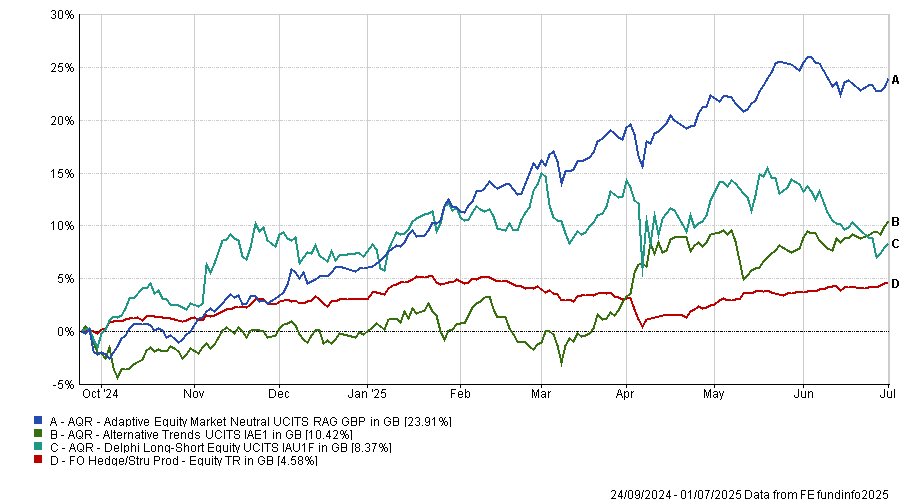
Source: FE Analytics
The managers said they want to avoid getting caught up in overly crowded trades, especially with signs of froth in areas like Bitcoin and treasuries.
“Delphi Long/Short is long value and quality, short overstretched areas of the market. That’s about diversifying the portfolio – we still hold tech and equities that would benefit in a boom, but if there’s a rotation or frothy behaviour, this helps protect against that,” said Newton.
Alternative Trends, meanwhile, focuses on momentum strategies in more esoteric asset classes. “It has low correlation and high potential returns, which makes the portfolio more robust,” he added. “These are liquid enough that we can rotate into equities or bonds if a better opportunity appears – or if discounts re-emerge.”
Silver and Newton run Credo Dynamic using a core-satellite structure. Around 50% of the portfolio is in core holdings: typically exchange-traded funds (ETFs) and corporate bonds, giving long-term exposure to global markets.
The rest, they explained, is more opportunistic, used to dial up risk when the environment justifies it through smaller companies and individual stocks or diversify through alternatives or at times aim to protect capital. They actively shift the balance based on bottom-up opportunities combined with more macro and valuation signals.
Alternatives, although a smaller allocation, have been a standout contributor in the past year, when the fund stood out against its average peer, as the chart below shows.
Performance of fund against sector over 1yr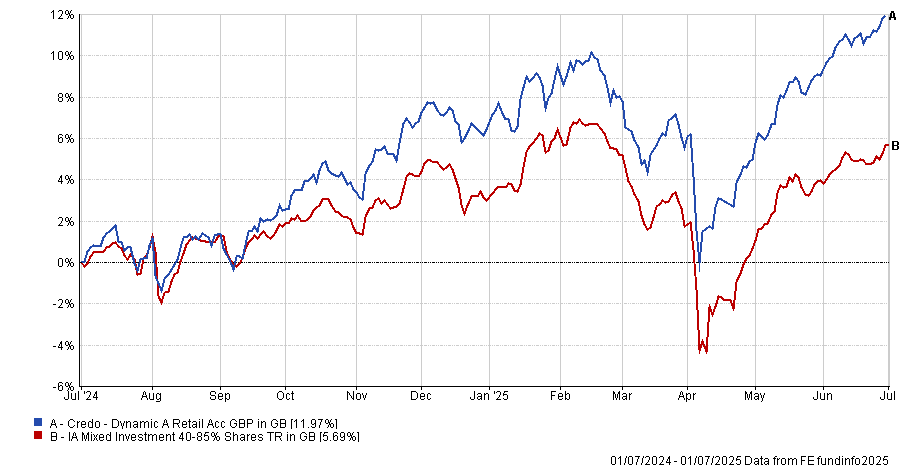
Source: FE Analytics
“Alternatives have been especially important over the past 12 months – they’ve delivered the best returns, even though they’re a small part of the fund,” said Silver. “We like retaining that exposure when the future feels uncertain.”
That sense of uncertainty – combined with a lack of compelling opportunities – is exactly why they’ve chosen to focus on building a broad, balanced portfolio rather than making high-conviction macro calls.
“It’s a relatively uncertain environment on a number of metrics, but we’re not in risk-off mode. It’s about focusing on the type of risk you're taking. There’s no single area that stands out. It’s hard to know where to hang your hat, because we’re not seeing anything screamingly obvious,” said Newton.
That view has fed into their overall positioning, which currently sits at around 48% equity, just under 30% bonds and the remaining 20% in alternatives and cash.
While the managers are generally comfortable running a higher portfolio turnover than peers – “the satellite side of the portfolio can be highly active and opportunistic at times,” they said, noting their past focus on discounted investment trusts – recent turnover has been elevated due to the REIT unwind and rotation into alternatives. However, they expect it to fall back if no major new opportunities emerge in the coming months.
Newton summarised their outlook: “I don’t want to give the impression we’re preparing for a bearish scenario – we’re not building up a big cash buffer or waiting for a crash. We just think risks are elevated and obvious opportunities are scarce, so we’re asking: how can we still deliver strong returns from a very broad portfolio?”
Fundsmith Equity portfolio sees US drinks firm replaced by European optical powerhouse
Terry Smith has sold Fundsmith Equity’s stake in Brown-Forman, the US spirits group behind Jack Daniel’s, and started building a new position in Franco-Italian eyewear conglomerate EssilorLuxottica, according to the fund’s latest factsheet.
The disposal ends a holding that made up 1.29% of the £20bn portfolio at the start of the year and comes after a slump in Brown-Forman’s share price following disappointing quarterly results in May. The stock is down 22.8% year-to-date.
Performance of stock over the year to date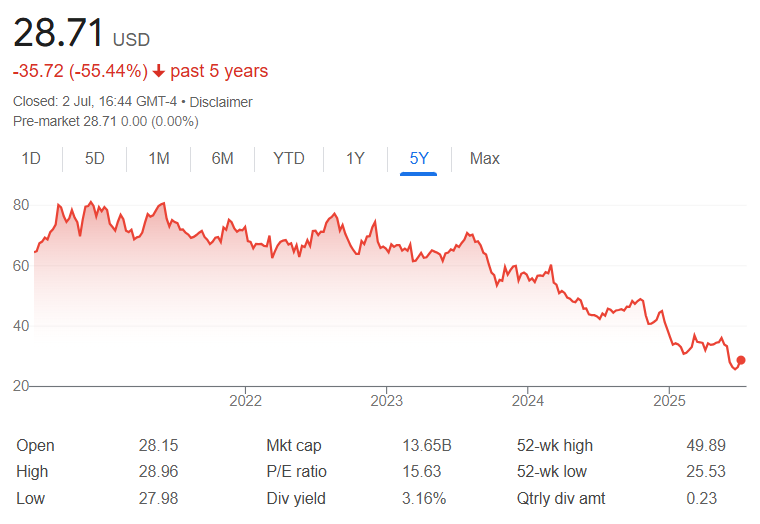
Source: Google Finance
Dan Coatsworth, investment analyst at AJ Bell, said the company had struggled with weaker demand amid rising prices and macroeconomic uncertainty. “Alcohol fans are balking at the price hikes triggered by tariffs and concerns around economic weakness have led people to seek cheaper alternatives as they watch their spending,” he said.
EssilorLuxottica, by contrast, has been gaining traction with fund managers. Daniel Avigad, who runs the TM Lansdowne European Special Situations fund, recently described it as “an industry powerhouse” and “a serious contender in Europe’s race to build a $1trn company” due to its combination of horizontal breadth and vertical integration. The firm holds a 30-40% market share across multiple levels of the eyewear value chain.
Fundsmith Equity has faced investor frustration after several years of lagging returns. Once a consistent top performer, the fund last ranked in the top quartile of the IA Global sector in 2019 but was in the third quartile for the past three full calendar years as well as 2025 to date.
Yet fund pickers told Trustnet investors in the fund should stick with it. The top contributors to performance in June included Meta, Microsoft, Nike, Texas Instruments and Alphabet; the largest detractors were Automatic Data Processing, Brown-Forman, Visa, Unilever and Procter & Gamble.
Trustnet reviews the past six months to find out the strongest parts of the market.
Investors would have been rewarded by holding European stocks, banks and funds investing in gold over the opening half of 2025, research by Trustnet shows.
The first half of the year has been more turbulent than investors would have liked, with US president Donald Trump’s new administration sparking a cycle of market sell-offs and rallies through its upheaval of the global order in areas such as trade, defence and diplomacy.
Below, we look at the market from a range of viewpoints to find out which asset classes, stocks and funds made the highest returns over the past six months.
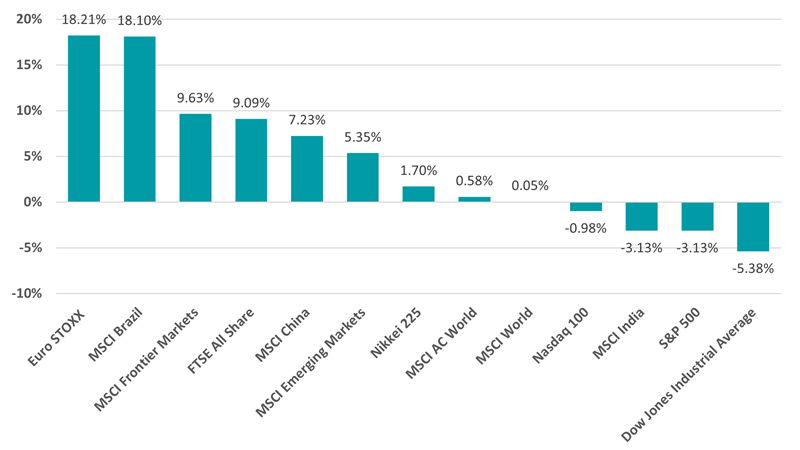
Performance of asset classes in 2025’s first half
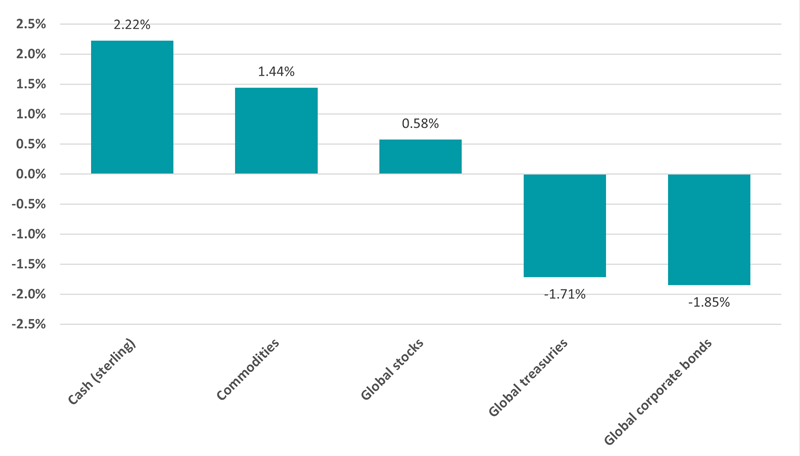
Source: FinxL. Total return in sterling between 1 Jan and 30 Jun 2025
Cash has been the best-performing asset over the past six months, followed by commodities. Global equities, represented by the MSCI AC World index, eked out a small positive return in sterling terms.
However, this headline figure conceals the widely different performance of equities in the first and second quarters of the year: the MSCI AC World fell 4.3% in the first quarter but was up 5.1% in the second.
The opening quarter was especially weak because investors pulled back from the so-called Magnificent Seven (Alphabet, Amazon, Apple, Meta Platforms, Microsoft, Nvidia and Tesla), which had led the market for several years.
But sentiment recovered in the second quarter as markets shook off the initial ‘Liberation Day’ tariff shock and rallied when Trump later paused or reduced them.
Performance by region in 2025’s first half
Source: FinxL. Total return in sterling between 1 Jan and 30 Jun 2025
Ben Yearsley, director at Fairview Investing, described the opening half of 2025 as “generally good”, pointing to the strong performance of European equities and “creditable” showing from UK stocks.
“The interesting one is the US, where despite a fresh record high for the S&P, the year-to-date gain of 5.44% has been more than wiped out by currency losses – very few investors hedge their equity exposure,” he added.
Performance of equity sectors in 2025’s first half
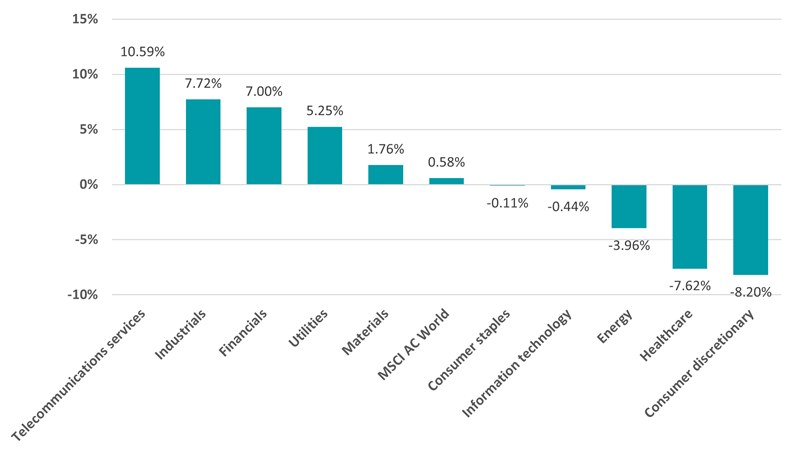
Source: FinxL. Total return in sterling between 1 Jan and 30 Jun 2025
Telecommunications topped the list of equity sectors, returning over 10% in sterling terms, as they benefited from resilient cash flows and growing investor appetite for stable yield. Industrials, financials and utilities also outperformed the wider global index.
Conversely, there was sharp underperformance from consumer discretionary and healthcare stocks. Discretionary companies struggled with subdued consumer demand on the back of inflation worries and real wage stagnation, while healthcare’s headwinds include regulatory uncertainty, pricing pressures and patent cliffs.
Performance of investment factor in 2025’s first half
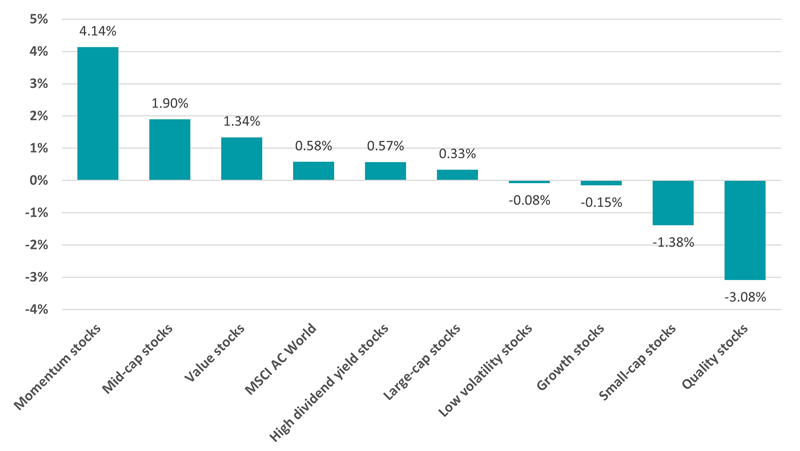
Source: FinxL. Total return in sterling between 1 Jan and 30 Jun 2025
This environment favoured momentum stocks as investors moved towards recent winners, while quality stocks suffered from little new upside to justify higher prices.
A look at the composition of the underlying indices – MSCI ACWI Momentum and MSCI ACWI Quality – also helps explain their performance in 2025’s first half. The momentum index has a lower allocation to areas like the US, tech stocks and healthcare than the quality index, with more in financials, industrials and utilities.
Performance of fund sectors in 2025’s first half
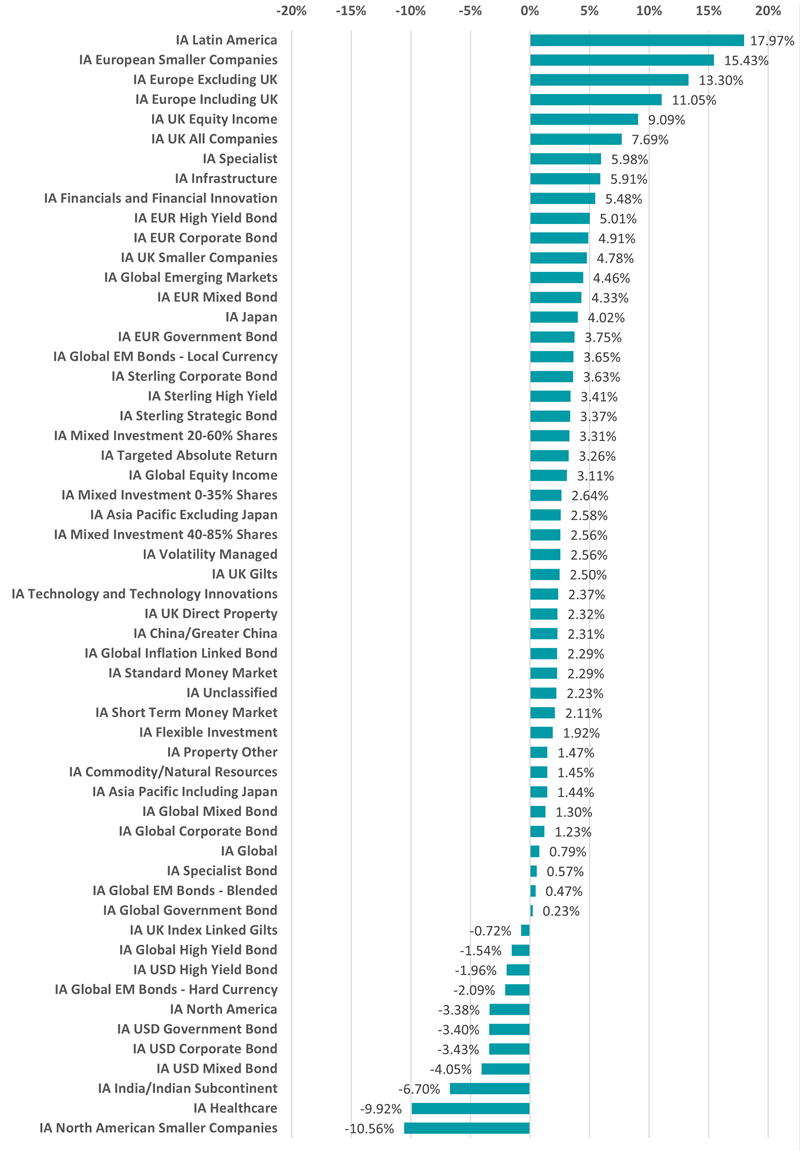
Source: FinxL. Total return in sterling between 1 Jan and 30 Jun 2025
Within the Investment Association sectors, IA Latin America was the best-performing peer group over the past six months with an average return of just under 18%. BlackRock GF Latin American made the highest return here, up 24.8%, followed by iShares MSCI EM Latin America UCITS ETF (18.5%) and Barings Latin America (18.5%).
As geopolitical tensions and valuations have risen elsewhere, investors turned their focus to Brazil and Mexico. Both countries’ stock indices are at record highs, yet still trade at a steep discount to developed peers.
The macro environment has been supportive, with a softer dollar lifting local currencies, rate cuts gaining traction and sovereign bond yields remaining appealing. This combination of relative political calm, favourable carry trades and historically discounted stocks has sharpened the appeal of Latin America in 2025.
The three European fund sectors followed, all making double-digit average returns. European equities have gained significant traction in 2025 as investors pivot away from the uncertainty surrounding US policy.
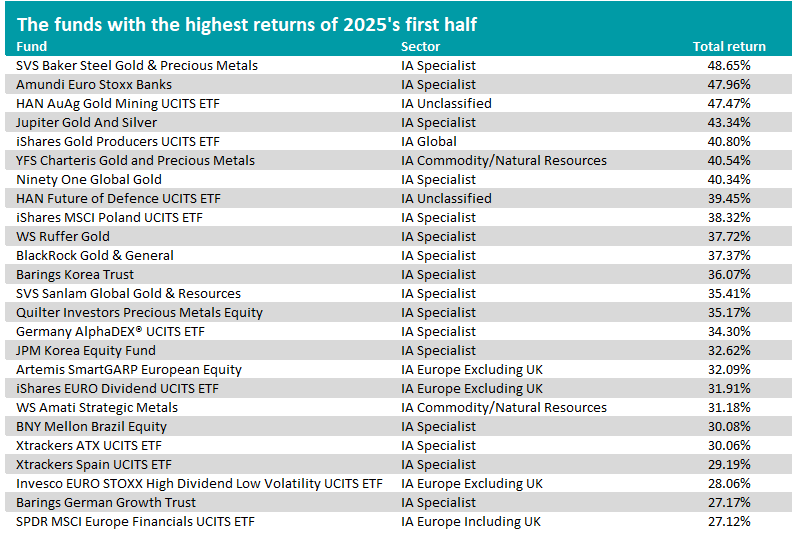
Source: FE Analytics. Total return in sterling between 1 Jan and 30 Jun 2025
When it comes to individual funds, however, gold was the main theme. As the chart above shows, seven of the 10 best-performing funds over the past six months are gold strategies, with SVS Baker Steel Gold & Precious Metals making 48.7%.
Investors have increasingly turned to gold in 2025, driven by a blend of geopolitical shocks and persistent economic uncertainty. Tensions in the Middle East, renewed US tariff threats, and ongoing trade disputes have rekindled demand for safe-haven assets like gold, contributing to its climb to record highs.
At the same time, a weakening US dollar and expectations of rate cuts from the Federal Reserve have bolstered gold’s appeal relative to non-yielding assets. Central banks, notably in China and Russia, have maintained aggressive gold buying to diversify reserve holdings, reinforcing upward pressure on prices.
Several other themes are represented in the table above, including Europe’s outperformance (Artemis SmartGARP European Equity, iShares EURO Dividend UCITS ETF), strong banks (Amundi Euro Stoxx Banks, SPDR MSCI Europe Financials UCITS ETF) and higher spending on defence (HAN Future of Defence UCITS ETF).
The trust's annual report details a focus on "adaptable holdings" and continued belief in the US healthcare sector.
Following a disappointing end to its financial year, the Monks Investment Trust managers are doubling down on building portfolio resilience to weather ongoing uncertainty.
The £2.5bn portfolio, which is managed by Spencer Adair, Malcolm MacColl and Helen Xiong, has delivered a NAV return of 163.3% over 10 years, slightly behind the FTSE World index’s 182% rise over the same period, according to the latest annual report for the year to 30 April 2025.
However, in the 12 months to April, Monks has underperformed the index by 5.2%, with a flat NAV return of 0.1% compared to FTSE World’s 5.3% gain.
The managers cited global trade tensions ignited by US president Donald Trump’s ‘Liberation Day’ tariffs and strong negative momentum within the US markets – the impact of which was more keenly felt due to the trust’s near 60% weighting to North America.
Regional allocation of Monks Investment Trust
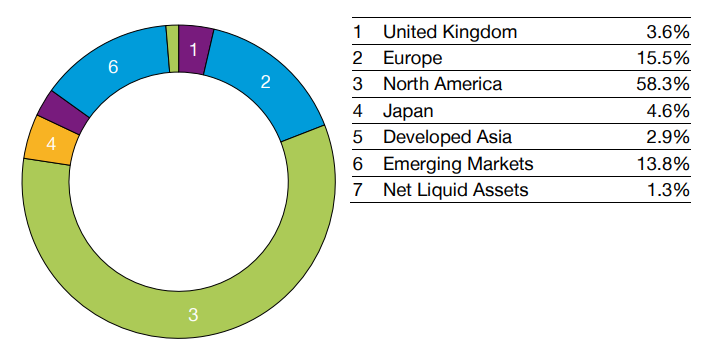
Source: Baillie Gifford
The Monks management team said that ongoing uncertainty caused by the volatile situation in the US cannot be priced, hedged or insured against. Instead, the managers are prioritising building resilience, retaining perspective and remaining reward-seeking.
The Monks’ game plan
The managers’ focus has been on ensuring holdings are “sufficiently adaptable” so that the portfolio is “positioned to win across a wide range of scenarios”.
“Rather than attempting to predict the unpredictable, we focus on building resilience through investing in companies with robust fundamentals and a diversity of growth drivers,” they said.
As such, the trust’s portfolio companies are “conservatively financed”, with 20% net debt/equity compared to the index (50%), and structurally more profitable with 39% gross margins versus 29%, the team said.
Monks also invests more in future growth and its companies have a higher return on equity at 19% versus the index’s 15%.
Holdings are organised into three profiles: stalwart (wealth compounders), rapid (typically technological innovators and disruptors) and cyclical growth (economically sensitive businesses whose growth arrives unevenly).
“This broad and pragmatic approach to growth gives us degrees of freedom to adapt to changing conditions, seize emerging opportunities and shift emphasis as market cycles evolve,” the team said.
The annual report also provided insight into position sizing, with over 40% of the portfolio by weight in the top 15 holdings. The managers said they believe these companies’ have the highest likelihood of at least doubling in return over the next five years.
“However, we recognise the asymmetries that equity investing offers and embrace this by managing a basket of smaller, 'incubator' positions (<0.5%), where the path to growth is less clear but potentially highly rewarding for shareholders,” the team added.
The trust currently invests in 40 such companies – around 15% of the portfolio.
The overall impact of this strategy is that Monks’ shareholders are not “overly exposed to the fortunes of one company, but instead a diverse range of holdings”.
Another method of ensuring resilience is to focus on more enduring and structural trends that will “outlast political cycles”, according to the managers. Examples include artificial intelligence (AI) and the penetration of electric and autonomous vehicles.
Around 25% of Monks is invested in companies that power, build or benefit from AI. The team currently has around 3.5% invested directly in the growth of electric and autonomous vehicles but noted “the direction of travel is clear”.
“By building resilience and maintaining perspective, we create the mental space to remain reward-seeking,” the managers said.
Under the weather
Elsewhere in the report, the managers pointed to the disappointing performance of its healthcare holdings, which were among the largest detractors from relative performance for the portfolio.
“President Trump’s healthcare appointments and their combined pronouncements have impacted short-term sentiment in healthcare,” the managers said.
As demonstrated in the table below, US health insurer Elevance Health suffered a fall in share price, which the managers have put down to tightened Medicaid eligibility criteria post-pandemic.
Top five contributors and detractors to relative performance by stock for the year end 30 April 2025 (%)
|
|
Average weight in portfolio |
Average weight in Index |
Average active weight |
Total Return |
Attribution |
|
Top five |
|
|
|
|
|
|
DoorDash |
2.3 |
0.1 |
2.2 |
40.6 |
0.8 |
|
Prosus |
2.9 |
0.1 |
2.9 |
29.9 |
0.6 |
|
Alnylam Pharmaceuticals |
1.0 |
0.0 |
0.9 |
70.1 |
0.6 |
|
Sea Limited |
0.8 |
0.0 |
0.8 |
98.9 |
0.5 |
|
Shopify |
1.4 |
0.1 |
1.2 |
27.2 |
0.5 |
|
Bottom five |
|
|
|
|
|
|
Elevance Health |
3.1 |
0.1 |
3.0 |
-24.5 |
-1.0 |
|
Novo Nordisk |
1.7 |
0.5 |
1.2 |
-51.1 |
-1.0 |
|
Martin Marietta Materials |
3.0 |
0.0 |
2.9 |
-15.8 |
-0.8 |
|
Moderna |
0.4 |
0.0 |
0.4 |
-70.6 |
-0.5 |
|
Block |
1.2 |
0.1 |
1.1 |
-25.1 |
-0.5 |
Source: Revolution, FTSE. All attribution figures are calculated gross of fees, relative to the index from stock level up, based on closing prices.
Despite this, the managers remain optimistic, arguing that there is “a structural tailwind for growth in the years ahead” as the population ages, treatments become more expensive and need for health insurance coverage grows.
However, in the top five, the managers highlighted Alnylam Pharmaceuticals, which received positive results from its late-stage trial to treat a rare heart condition – an achievement that could give it wider access to the patient population.
“We took some profits on shareholders’ behalf after the share price rose by 80% but we remain excited by the company’s potential to address even larger patient populations,” the managers said.
In contrast, Monks sold its position in Moderna, citing disappointing revenue from the Covid-19 vaccine and slow speed to market with its respiratory syncytial virus vaccine.
“Though we continue to believe that they have a potentially exciting pipeline of drugs, our patience has been exhausted,” the managers said.
Kepler’s David Brenchley identifies the investment trusts to consider if the dollar continues to weaken.
Perhaps it’s the financial writer in me, but our long-awaited holiday to Japan was hastened by a currency that had moved heavily in our favour; the same may be the case for the US next year.
We decided to take in the sights of Tokyo, Kyoto, Nara and Osaka in May, to take advantage of a weak yen. The GBP/JPY exchange rate had climbed by c. 50% over the past five years, from c. 130 five years ago to c. 195.
Sterling has climbed against the US dollar, too. Perhaps that will be our next big trip.
The GBP/USD exchange rate has risen c. 30% in the past three years, from c. 1.05 to c. 1.37 at the time of writing. You’ll recall that during the Truss premiership there were fears the pound would hit parity with the dollar.
Sterling’s four-year high against the dollar may be good news for holidaymakers, but it’s not so good for those UK-based investors whose portfolio is heavily weighted to USA Inc.
During this period of dollar weakness (since 28 September 2022), the S&P 500 has generated a total return of c. 70%, yet UK (and other Europe-based) investors have not kept up with this. The iShares Core S&P 500 UCITS ETF, denominated in sterling, is up c. 33.6%, according to FE fundinfo.
Currency movements are notoriously difficult to predict, but it’s prudent to at least consider the risk that depreciation could drag on your returns when investing overseas. The S&P 500 has powered ahead since 2022, but sterling investors would have been better off putting their cash into the iShares Core FTSE 100 UCITS ETF, which has returned 37.8%.
This is a far cry from the post-financial crisis period when a strong dollar worked in our favour. Indeed, the iShares Core S&P 500 UCITS ETF returned c. 354% in the 10 years to 28 September 2022, versus a US dollar return of c. 196% from the S&P 500.
Now, a rethink of this dollar dependence seems sensible. Bear in mind that president Trump wants a weaker dollar so that the US becomes more competitive from an export perspective as well as to shrink its trade deficit.
So, what, if anything, should a non-US dollar denominated investor do if the greenback continues to slide?
Most obviously, all things being equal, domestically oriented investments become more attractive. Broadly, this is because you don’t have to take on any currency risk – and we’ve already shown that in sterling terms the FTSE 100 has outperformed the S&P 500 recently.
The nuance here is that only c. 30% of FTSE 100 companies’ revenues come from the UK, with a large portion of that being US dollar sales. So, perhaps a more interesting place to look would be the UK small- and mid-cap segment, where companies are more geared to the UK economy. FTSE 250 companies generate c. 45% of revenues domestically and that number will be lower for small-cap firms.
Take Rockwood Strategic, which invests at the very bottom of the small-cap segment, in micro-cap companies. Rockwood Strategic’s portfolio generates roughly half of its revenue from the UK, with the other half coming from the US as well as continental Europe, Asia and Africa.
From a mid-cap perspective, consider Schroder UK Mid Cap, which has been boosted by its domestic exposure, such as housebuilders and other companies down the housebuilding supply chain including brick makers.
Emerging market economies have tended to be negatively correlated with the US dollar in that when the dollar rises, emerging markets generally do badly. If this is the case, it’s fair to suggest that the reverse should hold true and that as the dollar continues to weaken, emerging markets will thrive.
That’s particularly true of the countries at the smaller end of the emerging complex, which tend to have more US dollar debt, suggesting that BlackRock Frontiers could benefit.
Fidelity Emerging Markets is an interesting option here, in that it is a differentiated option in the sector. Managers Nick Price and Chris Tennant are very valuation-focused, giving them the flexibility to stray from the benchmark, which leads them into small- and mid-caps, as well as having the ability to short companies with weak balance sheets.
A further asset class that has benefited from lower dependence on the US dollar as a source of funding is gold. Aside from it doing well in an uncertain geopolitical environment, central banks in countries with big US dollar revenues have been diversifying and reducing their exposure to the currency. To do this, they’ve been buying physical gold.
One beneficiary of this trend has been Golden Prospect Precious Metals, which continues to be a standout performer with a share price total return of c. 79% over the past year. High conviction exposure to smaller-cap miners, where the managers still see compelling valuations, has contributed to this and Golden Prospect Precious Metals still trades on a discount of c. 15%.
Of course, this is not all to say that wholesale portfolio changes are merited. The US market continues to chug along and it’s possible that the dollar could perk up at some point. However, most signs suggest that an ever-strengthening dollar will no longer provide a big boon to returns from your Stateside exposure. Diversification seems more important today than ever.
David Brenchley is an investment specialist at Kepler Partners. The views expressed above should not be taken as investment advice.
Trustnet finds out how European equities have caught investors’ eyes this year.
Investors have turned positive on European stocks with the opening months of 2025 seeing them outpace US equities, but exactly which of the region’s stocks and funds are performing the best?
The June edition of Bank of America’s closely watched Global Fund Manager Survey found a net 34% of asset allocators are overweight European equities. This is 0.8 standard deviations above the long-term average and reflects vastly improved sentiment towards the once-unloved region.
There is no doubt that 2025 is turning out to be a strong year for European equities. Since the start of the year, the Euro STOXX index has made a 18.3% total return (in sterling terms), compared with a 0.6% loss from the MSCI AC World index.
Performance of Euro STOXX vs other equity indices in 2025
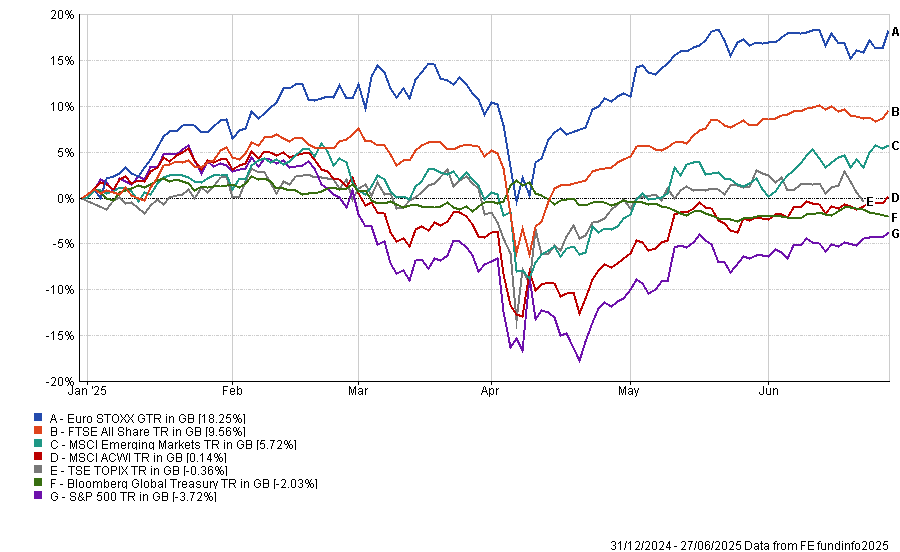
Source: FE Analytics. Total return in sterling between 1 Jan and 27 Jun 2025
As the chart above shows, European stocks have outpaced all the major equity regions and government bonds by a wide margin this year. This includes US stocks – the former market darlings – as tariff threats, political uncertainty and high valuations caused investors to rotate away from the US.
Alex Holroyd-Jones, multi asset portfolio manager at Ninety One, also highlighted the positives for Europe: “A confluence of macroeconomic forces is building a more constructive case for European equities. Chief among them is the region’s cyclical upturn.
“The eurozone is showing signs of recovery after weak growth for much of the last two years. Business sentiment, measured by [purchasing managers’ indices], is climbing, led by improvement in manufacturing. Consumer confidence is also recovering, buoyed by real wage growth as inflation cools and employment remains resilient. A new credit cycle has emerged, with credit growth regaining after a period of contraction. Europe’s long-idling growth engine is finally gaining traction.”
Performance of European equity sub-indices in 2025
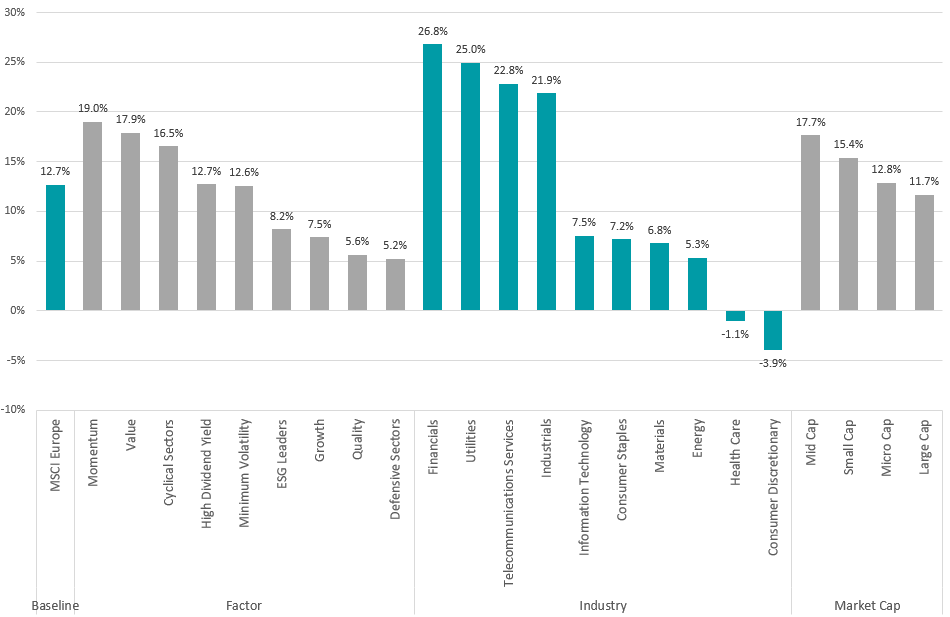
Source: FinXL. Total return in sterling between 1 Jan and 27 Jun 2025
While European stocks have had a strong first half of 2025, the gains haven’t been evenly spread. Financials, utilities and telecoms stand out with returns well above the MSCI Europe benchmark.
These sectors are seen as stable and income-generating, especially in an environment where interest rates remain high and economic uncertainty lingers. Investors are leaning into dependable earnings and steady cash flows rather than chasing more speculative growth.
The pattern is clear in factor performance too. Momentum and value stocks are making the highest returns, while growth and quality have fallen behind, showing a clear shift toward cheaper but proven names over expensive future growth potential.
On an individual country level, the strongest returns have come from Spain (up 29.4%), Norway (24.8%), Austria (24.4%), Italy (21.6%) and Ireland (20.2%). Denmark is the only constituent of the MSCI Europe index in negative territory this year, down 9.4%.
This has acted as a strong backdrop for European equity funds. Of the 250 funds in the IA Europe Excluding UK, IA Europe Including UK and IA European Smaller Companies sectors, 241 - or 96.4% - have made a positive return in 2025 so far. The 25 with the highest returns can be found in the table below.
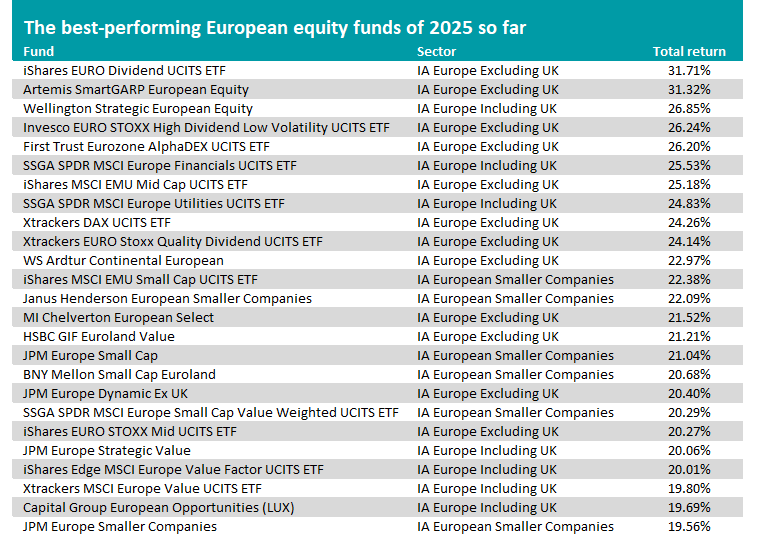
Source: FE Analytics. Total return in sterling between 1 Jan and 27 Jun 2025
At the top of the table, iShares EURO Dividend UCITS ETF reflects the ‘stable and income-generating’ theme mentioned above. It invests in eurozone companies with the highest dividend yields, with 50.2% of its portfolio in financials, 10.7% in utilities and 5.8% in telecoms.
Invesco EURO STOXX High Dividend Low Volatility UCITS ETF, SSGA SPDR MSCI Europe Financials UCITS ETF, iShares MSCI EMU Mid Cap UCITS ETF and SSGA SPDR MSCI Europe Utilities UCITS ETF also reflect some of the previously highlighted themes.
The £905m Artemis SmartGARP European Equity fund is the highest-ranked active fund in 2025, making a 31.3% total return. Manager Philip Wolstencroft has been running the fund since its launch in 2001 using the SmartGARP process, which seeks out companies growing faster than the market but on lower valuations.
Its biggest sector allocation is to financials (accounting for 41.6% of the portfolio), followed by industrials (11.8%) and healthcare (10.2%). Italy, Spain and France are the largest country weightings.
Analysts at Rayner Spencer Mills Research said: “This fund is suitable as a core investment or for use alongside a large-cap or passive vehicle. The mid-cap weighting is significantly higher than that of the market and introduces investments that are often not found in the fund’s peers. In this way, the fund provides diversification, particularly relative to strategies that are more growth or large-cap orientated.”
Wellington Strategic European Equity is in third place with a 26.8% total return this year. Unlike many of the funds in the table, this resides in the IA Europe Including UK sector, with the UK being its largest geographical allocation.
Manager Dirk Enderlein looks for companies with “superior structural free-cash-flow and earnings growth outlook and a strong competitive positioning combined with attractive valuation levels”. However, the fund is at capacity and currently soft closed to new investments.
Of the 25 best European funds this year, a handful were also in their sectors’ top quartile over the previous three and five years, suggesting their recent strength is not limited to the current market backdrop.
These funds are Artemis SmartGARP European Equity, Wellington Strategic European Equity, SSGA SPDR MSCI Europe Financials UCITS ETF, WS Ardtur Continental European, Janus Henderson European Smaller Companies, BNY Mellon Small Cap Euroland and SSGA SPDR MSCI Europe Small Cap Value Weighted UCITS ETF.
Looking forward, Ninety One’s Holroyd-Jones pointed out that risks remain for European equities, as the continent is reliant on external demand, particularly from China, and therefore vulnerable to US trade policies. It is also a net importer of oil, so further conflict in the Middle East could increase the risk of an oil price shock adding to inflation.
However, he finished: “For investors willing to look beyond short-term noise, Europe offers the potential alignment of improving macro fundamentals, supportive policy, attractive valuations and the prospect of renewed capital inflows away from US assets.
“The eurozone may not displace the US as the epicentre of global equity markets, but its risk assets are well positioned to outperform over the medium term as global capital rebalances.”
The manager explains why businesses such as Lloyds, Frasers Group and DFS look particularly compelling.
The recent popularity of defence stocks has made it challenging to find opportunities that still have room to run, according to Fidelity’s Alex Wright.
As geopolitical tensions boiled over, defence investment has been thrust into the limelight, with NATO members recently committing to spending 5% of GDP on defence. This is the latest in a string of positive developments for defence companies, causing the FTSE All Share Aerospace & Defense index to climb 64.3% so far this year.
This is significantly ahead of the wider FTSE All Share (up 9.1%), as well as the S&P 500 and the MSCI AC World, as seen in the chart below.
Performance of the indices year to date
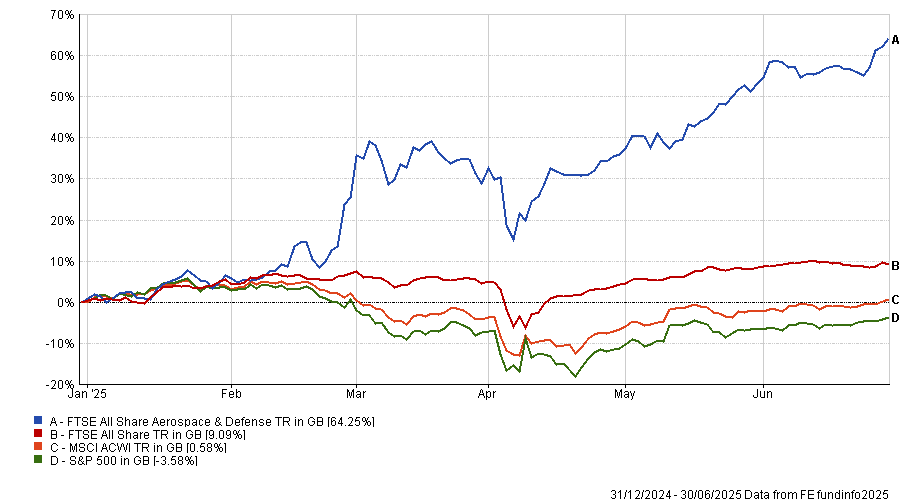
Source: FE Analytics. Total return in sterling
Following this, defence-focused funds have surged in popularity. For example, the WisdomTree European Defence ETF has accumulated $3bn in capital in just three months.
However, Wright explained: “I think defence has become extremely fashionable and therefore valuations are too high, so we’re reducing it.”
This marks a turnaround in Wright’s approach, with his Fidelity Special Values trust and Fidelity Special Situations fund typically having very high allocations to defence, he explained.
While both portfolios currently hold Babcock, Serco and Rolls-Royce, these positions were heavily reduced since 2020, due to most of the surge in defence spending being already priced in.
Recent trades in Fidelity Special Situations and Special Values
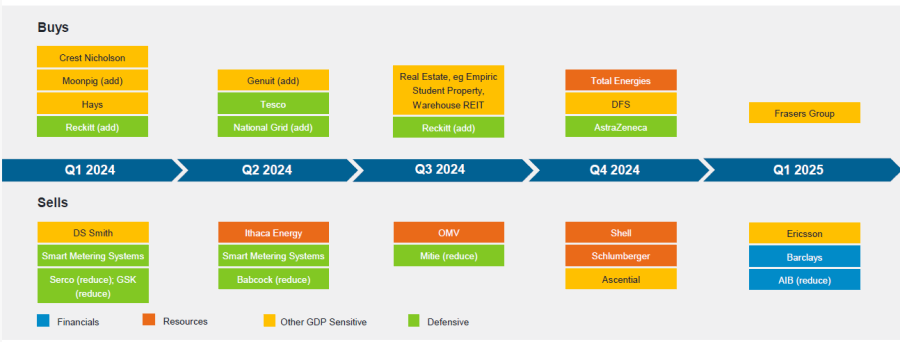
Source: Fidelity International.
While he conceded that the defence has done “a lot better than we would have expected”, other areas appeared more compelling: “Overall, I think defence has become fashionable, but I would say banks are coming back and have a lot further to go.”
For the first time since 2016, Wright has raised his allocation towards Lloyds Bank. Restrictive regulations hit banks hard and Lloyds had particularly suffered, but the tone seems much better from here, the Fidelity manager said.
“In the UK, there’s been an easing of the regulatory burden, which had been very onerous for banks,” he said.
Partially, this is because of the need to remain globally competitive. The US is making “a lot of noise” about deregulation and if other developed markets do not follow suit, the US will continue to drain capital from the rest of the world. To prevent this, he argued that regulators have been easing up on banks.
Most UK banks are also extremely cash-generative with plenty of excess capital, he explained. Traditionally, banks used this capital to fund share buybacks, but as banks perform well, buybacks become more expensive. As a result, many UK banks are opting to grow through buying out smaller competitors.
“It makes a lot more sense for these banks to buy other banks, rather than buy your own, which is essentially what you do in share buybacks,” he said.
As a result, Wright also holds significant positions in NatWest and Standard Chartered. All three banks are up so far this year, as demonstrated on the chart below.
Share prices vs the index year to date
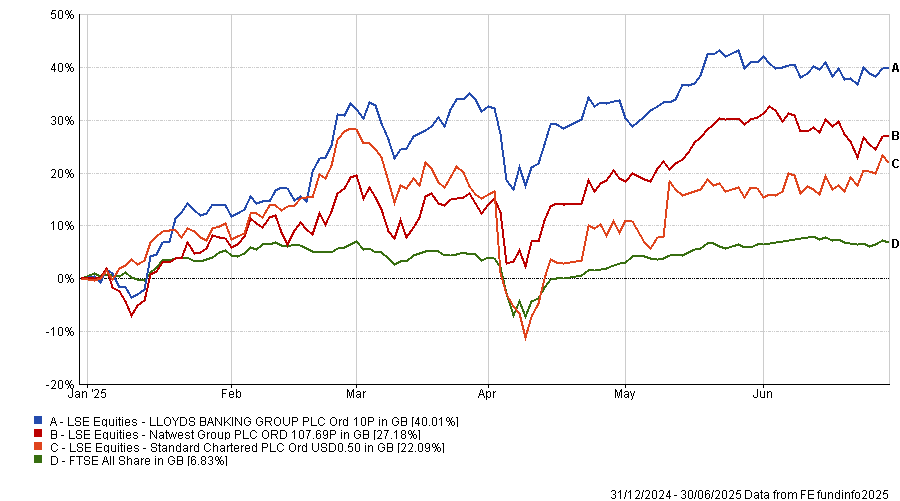
Source: FE Analytics. Share price in sterling
However, he noted that he is not positive on banks universally, with the increased position in Lloyds being funded by selling out of Barclays.
The more domestic companies in the UK index have also been appealing this year, he explained. Businesses that are sensitive to gross domestic product (GDP) are becoming more attractive in a period where dollar assets seem to be risky. Additionally, the UK consumer is in a much stronger position than the narrative suggests.
“I think the interesting thing this year is that consumers have a lot of money, with wage increases above the level of Inflation and savings at a very high level,” he said. “There has just not been that confidence to spend.”
Playing on this, one of the biggest recent additions to the portfolio is Frasers Group, formerly known as Sports Direct.
Trading at a price-to-earnings ratio of just 6x, despite a strong balance sheet, it is an “exceptional value” opportunity. Additionally, Frasers Group is “very different” to its average competitor because it has stakes in many other retail companies, such as Hugo Boss and ASOS.
Another domestic stock Wright favoured this year is sofa retailer DFS. It rallied after some very depressed market sales and is benefiting from challenges to some of its more direct competitors, such as SCS.
Share prices vs the index year to date
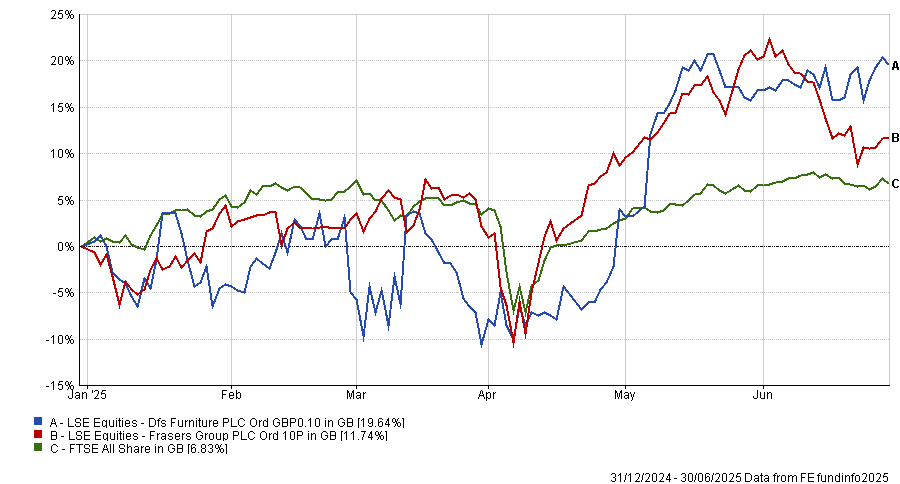
Source: FE Analytics. Share price in sterling
“These more UK domestic areas have been a theme for us this year,” Wright said. “It’s been out of value and out of favour and therefore has good valuations. We can buy into those.”
Over the past one, three, five and 10 years, Fidelity Special Situations and Fidelity Special Values have delivered top-quartile returns in the IA UK All Companies and IT UK All Companies sectors, respectively.
Performance of strategies vs sectors and index over the past 10yrs
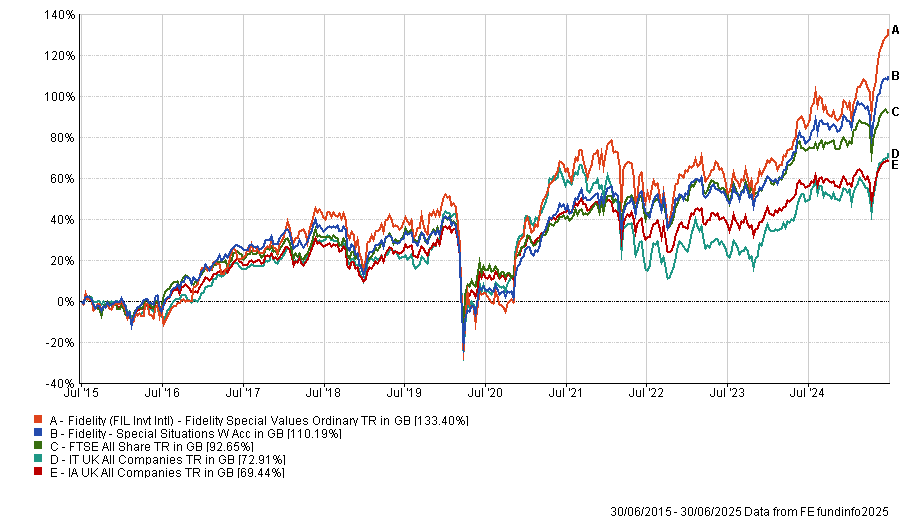
Source: FE Analytics
The information contained within this website is provided by Allfunds Digital, S.L.U. acting through its business division Digital Look Ltd unless otherwise stated. The information is not intended to be advice or a recommendation to buy, sell or hold any of the shares, companies or investment vehicles mentioned, nor is it information meant to be a research recommendation. This is a solution powered by Allfunds Digital, S.L.U. acting through its business division Digital Look Ltd incorporating their prices, data news, charts, fundamentals and investor tools on this site. Terms and conditions apply. Prices and trades are provided by Allfunds Digital, S.L.U. acting through its business division Digital Look Ltd and are delayed by at least 15 minutes.
© 2025 Refinitiv, an LSEG business. All rights reserved.
 Please wait...
Barclays Investment Solutions Limited provides wealth and investment products and services (including the Smart Investor investment services) and is authorised and regulated by the Financial Conduct Authority and is a member of the London Stock Exchange and NEX. Registered in England. Registered No. 2752982. Registered Office: 1 Churchill Place, London E14 5HP.
Barclays Bank UK PLC provides banking services to its customers and is authorised by the Prudential Regulation Authority and regulated by the Financial Conduct Authority and the Prudential Regulation Authority (Financial Services Register No. 759676). Registered in England. Registered No. 9740322. Registered Office: 1 Churchill Place, London E14 5HP.