

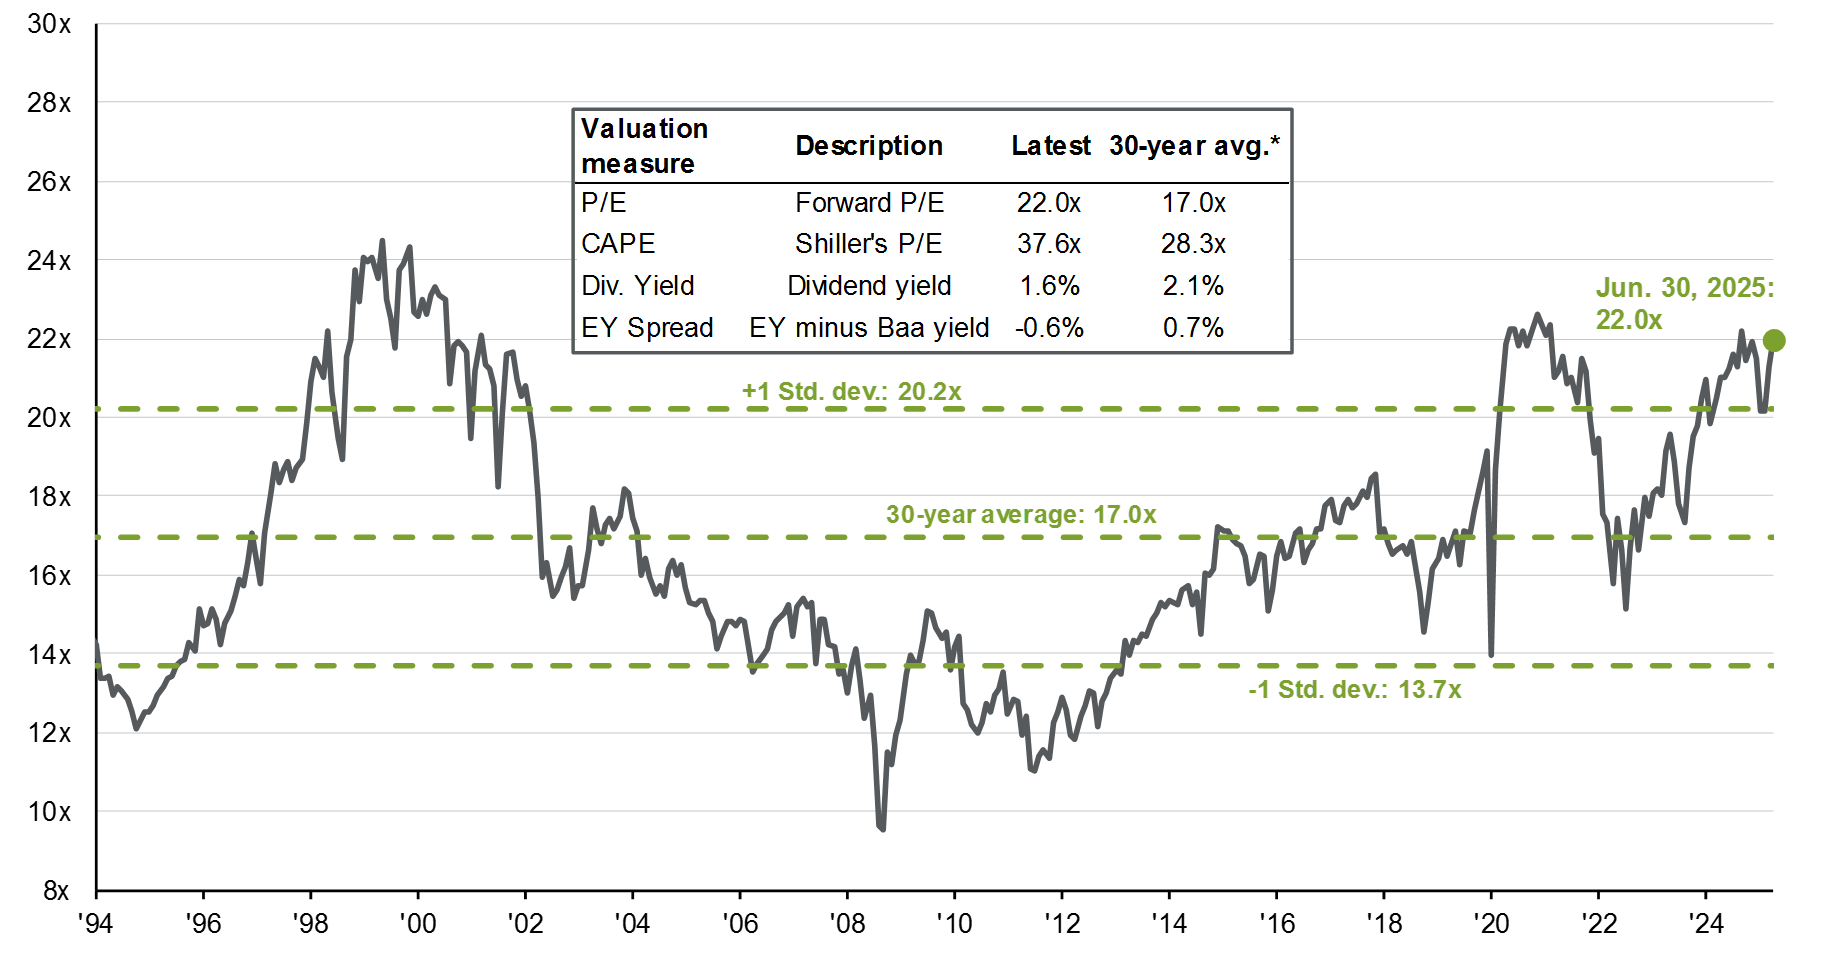
 Source: Bloomberg, FactSet, Moody’s, Refinitiv Datastream, Robert Shiller, Standard & Poor’s, J.P. Morgan Asset Management.

I’ve been talking pensions this week with friends and family. And it has reminded me how lucky I am. I’ve had the same job for almost 28 years and I have a good occupational pension, but I’m painfully aware how rare this is becoming. Indeed, some of my friends or their partners have little or no pension savings at all despite being in their 50s.
Worryingly, they are not alone. Various surveys suggest as many as 27% of people over 50 have no private pension provision, all of which is incredibly depressing. But an uplifting chat with the wonderful Dan Boardman-Weston, CEO of BRI Wealth Management, cast things in a more positive light.
For some later starters, at least, there is still hope.
He pointed out that, thanks to the generous allowances and tax relief on pensions, and tax-efficient Individual Savings Accounts (ISAs), there’s every chance a determined saver aged 50 who is earning a good wage could build up a retirement pot of over £1m by the age of 67.
“Of course, you should start saving as early as you can for your retirement, but many people don’t pay adequate attention to their finances until later in life, when the prospect of retirement is looming large,” he said.
“The good news is that it’s not too late, as long as the government does not reduce tax breaks on pensions and ISAs too far from current levels.”
The strategy requires saving relatively large amounts of money each year, and consequently, this won’t be for everybody. But people in their 50s are often best placed to afford it; the mortgage is usually paid off and children are likely to have flown the nest, potentially leaving this age group with more disposable income than at any other time in their lives.
Before I am castigated for generalising, I know from bitter experience that many people in their 50s can be under immense financial pressure, as they are sandwiched between caring for children and elderly parents. But for those without such onerous financial burdens, read on.
Currently the maximum you can pay into a pension each year is the lower of taxable earnings or £60,000*. This may sound an enormous amount to put aside from your income. But thanks to the way tax relief works, each £100 contribution only costs a higher-rate taxpayer £60, or £55 for additional-rate taxpayers. It would therefore cost £36,000 to add £60,000 to your pension pot for a higher-rate taxpayer. That’s still quite a sum. So let’s be more realistic and say we aim to save £40,000 a year. That means squirrelling away £27,000 a year, or £2,250 a month.
Somebody earning a gross £85,000 a year takes home almost exactly £5,000 a month, making it quite feasible in many cases to save just over £2,000 a month if there are no child-related costs or mortgage payments, especially if there are two incomes in the household.
If somebody saved £2,250 a month from age 50 in the stock market, assuming investment growth in the stock market of 4.4% a year, then they could accumulate a pension pot worth about £1,057,000 by age 67, just in time for retirement.
Now, that 4.4% growth rate is not guaranteed, but it is conservative by historical standards. And investment trust savers, in particular, should be used to better performance than this.
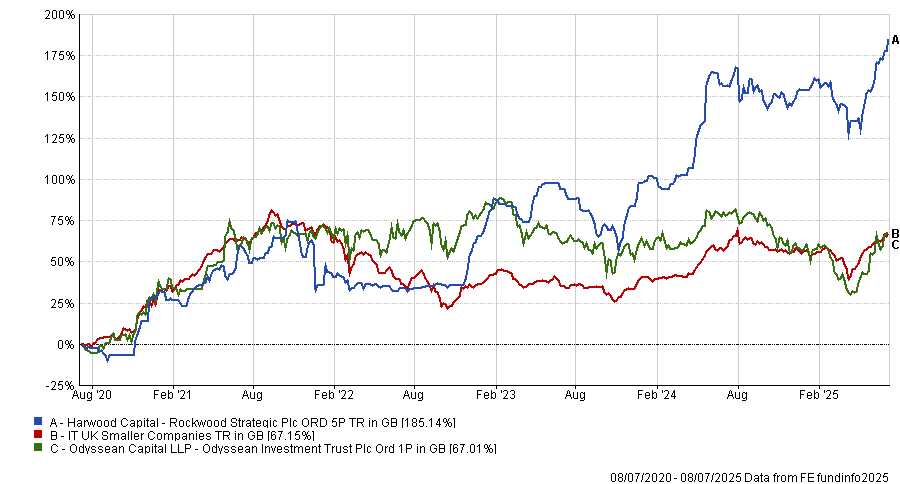
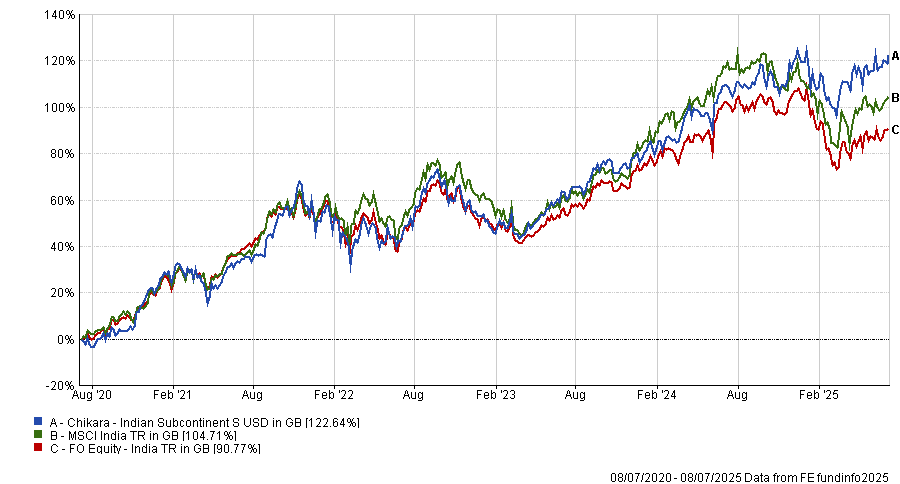
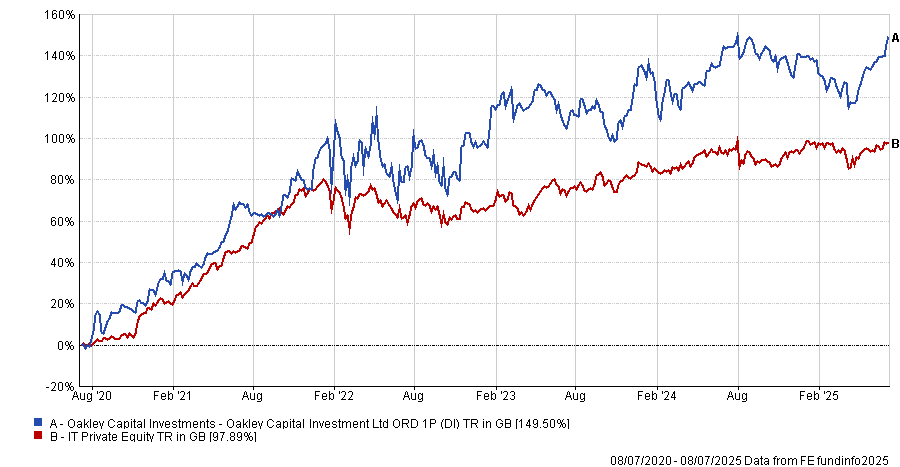
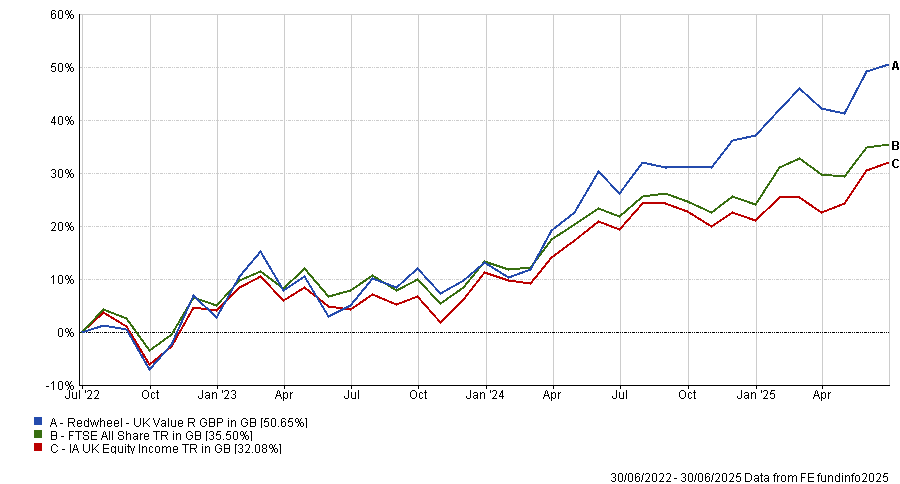
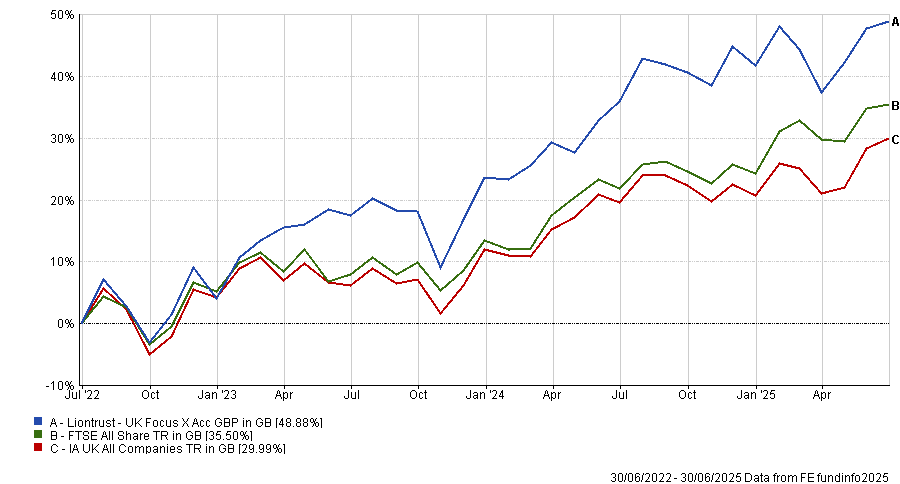
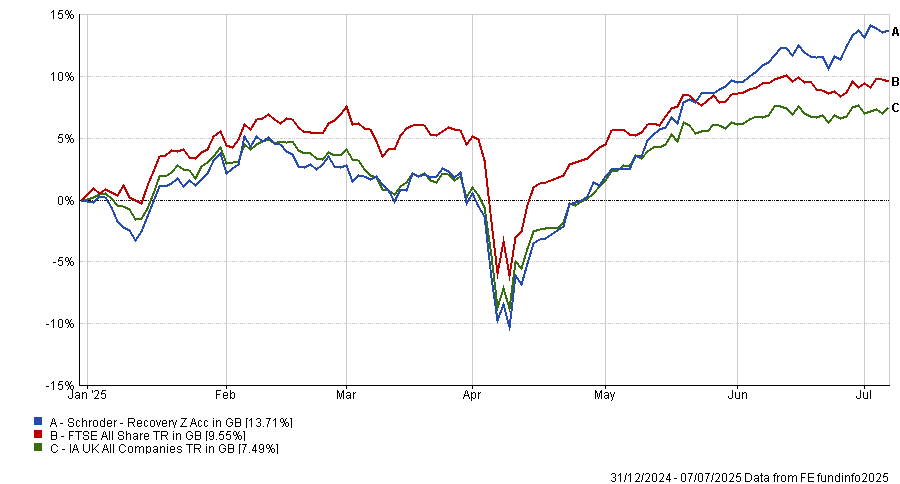
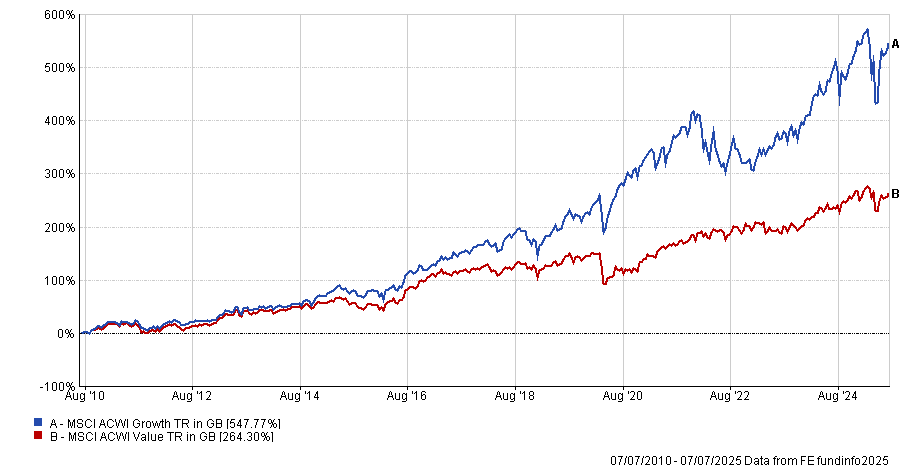
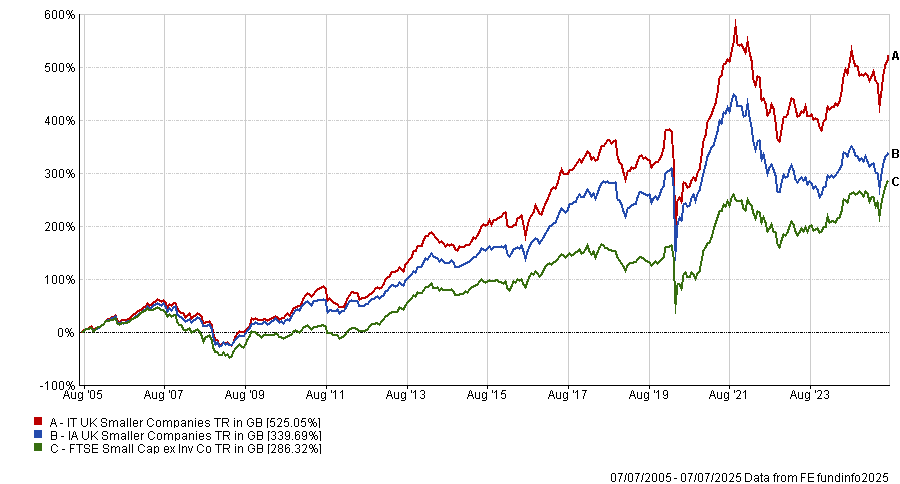
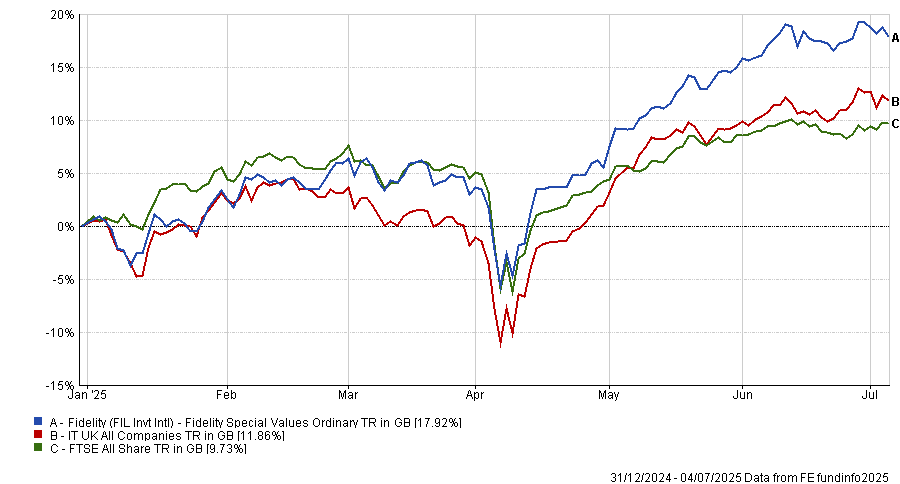
The average investment trust in the Global sector has returned an average of 11.18% a year over the past 20 years**, while the average investment trust from the UK All Companies sector has returned an average of 9.92% a year**, still more than double the assumed returns in Boardman-West’s calculations. Now, past returns are no guarantee of future performance, but they should provide some encouragement to those who think starting to save in a pension later in life is a waste of time. You could be surprised at the sums that you can accumulate.
Either way, it’s crucial that people do not waste any time in making use of the pension tax breaks because there is constant talk of paring back the tax benefits.
“People need to take advantage of pension tax relief while it is still available,” says Boardman-Weston. “There are rumours that the government is considering removing higher-rate tax relief and introducing a flat rate at a lower level, which would make pension saving more expensive for higher earners. I would urge everybody to utilise these generous allowances while they are still in place.”
Those with higher earnings could also take advantage of the annual ISA allowance, set at £20,000 for the 2025/26 tax year, which would, if fully utilised over the same period of 17 years, produce a total fund of £528,000, assuming the same annual growth of 4.4%. This ISA pot is made up of £340,000 in contributions and just over £160,000 of investment growth.
Although ISAs have grown in popularity in recent years, it is pensions that provide the more generous tax reliefs. The government effectively refunds any tax you have paid on your contributions at your highest rate. Either way, even if retirement age is on the horizon, get saving. And at least consider investment trusts as an efficient, well-diversified way of accessing public and private companies and other assets like infrastructure and property to make the most of your contributions.
* A taper is applied which reduces the £60,000 maximum allowance on incomes above £260,000.
** Source: Association of Investment Companies.
Annabel Brodie-Smith is communications director at the Association of Investment Companies. The views expressed above should not be taken as investment advice.
 Source: Ashoka, Bloomberg.
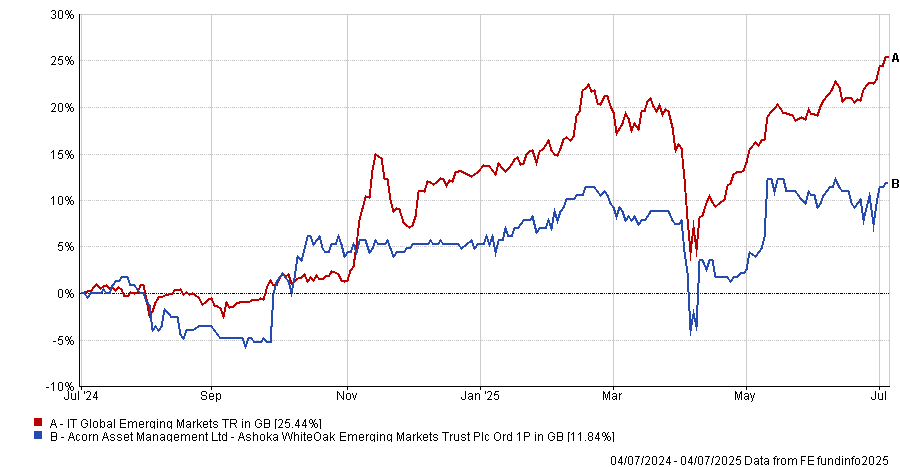
 Please wait...