The trust's annual report details a focus on "adaptable holdings" and continued belief in the US healthcare sector.
Following a disappointing end to its financial year, the Monks Investment Trust managers are doubling down on building portfolio resilience to weather ongoing uncertainty.
The £2.5bn portfolio, which is managed by Spencer Adair, Malcolm MacColl and Helen Xiong, has delivered a NAV return of 163.3% over 10 years, slightly behind the FTSE World index’s 182% rise over the same period, according to the latest annual report for the year to 30 April 2025.
However, in the 12 months to April, Monks has underperformed the index by 5.2%, with a flat NAV return of 0.1% compared to FTSE World’s 5.3% gain.
The managers cited global trade tensions ignited by US president Donald Trump’s ‘Liberation Day’ tariffs and strong negative momentum within the US markets – the impact of which was more keenly felt due to the trust’s near 60% weighting to North America.
Regional allocation of Monks Investment Trust
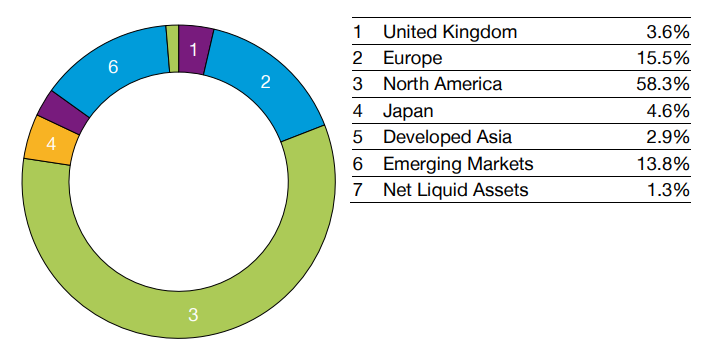
Source: Baillie Gifford
The Monks management team said that ongoing uncertainty caused by the volatile situation in the US cannot be priced, hedged or insured against. Instead, the managers are prioritising building resilience, retaining perspective and remaining reward-seeking.
The Monks’ game plan
The managers’ focus has been on ensuring holdings are “sufficiently adaptable” so that the portfolio is “positioned to win across a wide range of scenarios”.
“Rather than attempting to predict the unpredictable, we focus on building resilience through investing in companies with robust fundamentals and a diversity of growth drivers,” they said.
As such, the trust’s portfolio companies are “conservatively financed”, with 20% net debt/equity compared to the index (50%), and structurally more profitable with 39% gross margins versus 29%, the team said.
Monks also invests more in future growth and its companies have a higher return on equity at 19% versus the index’s 15%.
Holdings are organised into three profiles: stalwart (wealth compounders), rapid (typically technological innovators and disruptors) and cyclical growth (economically sensitive businesses whose growth arrives unevenly).
“This broad and pragmatic approach to growth gives us degrees of freedom to adapt to changing conditions, seize emerging opportunities and shift emphasis as market cycles evolve,” the team said.
The annual report also provided insight into position sizing, with over 40% of the portfolio by weight in the top 15 holdings. The managers said they believe these companies’ have the highest likelihood of at least doubling in return over the next five years.
“However, we recognise the asymmetries that equity investing offers and embrace this by managing a basket of smaller, 'incubator' positions (<0.5%), where the path to growth is less clear but potentially highly rewarding for shareholders,” the team added.
The trust currently invests in 40 such companies – around 15% of the portfolio.
The overall impact of this strategy is that Monks’ shareholders are not “overly exposed to the fortunes of one company, but instead a diverse range of holdings”.
Another method of ensuring resilience is to focus on more enduring and structural trends that will “outlast political cycles”, according to the managers. Examples include artificial intelligence (AI) and the penetration of electric and autonomous vehicles.
Around 25% of Monks is invested in companies that power, build or benefit from AI. The team currently has around 3.5% invested directly in the growth of electric and autonomous vehicles but noted “the direction of travel is clear”.
“By building resilience and maintaining perspective, we create the mental space to remain reward-seeking,” the managers said.
Under the weather
Elsewhere in the report, the managers pointed to the disappointing performance of its healthcare holdings, which were among the largest detractors from relative performance for the portfolio.
“President Trump’s healthcare appointments and their combined pronouncements have impacted short-term sentiment in healthcare,” the managers said.
As demonstrated in the table below, US health insurer Elevance Health suffered a fall in share price, which the managers have put down to tightened Medicaid eligibility criteria post-pandemic.
Top five contributors and detractors to relative performance by stock for the year end 30 April 2025 (%)
|
|
Average weight in portfolio |
Average weight in Index |
Average active weight |
Total Return |
Attribution |
|
Top five |
|
|
|
|
|
|
DoorDash |
2.3 |
0.1 |
2.2 |
40.6 |
0.8 |
|
Prosus |
2.9 |
0.1 |
2.9 |
29.9 |
0.6 |
|
Alnylam Pharmaceuticals |
1.0 |
0.0 |
0.9 |
70.1 |
0.6 |
|
Sea Limited |
0.8 |
0.0 |
0.8 |
98.9 |
0.5 |
|
Shopify |
1.4 |
0.1 |
1.2 |
27.2 |
0.5 |
|
Bottom five |
|
|
|
|
|
|
Elevance Health |
3.1 |
0.1 |
3.0 |
-24.5 |
-1.0 |
|
Novo Nordisk |
1.7 |
0.5 |
1.2 |
-51.1 |
-1.0 |
|
Martin Marietta Materials |
3.0 |
0.0 |
2.9 |
-15.8 |
-0.8 |
|
Moderna |
0.4 |
0.0 |
0.4 |
-70.6 |
-0.5 |
|
Block |
1.2 |
0.1 |
1.1 |
-25.1 |
-0.5 |
Source: Revolution, FTSE. All attribution figures are calculated gross of fees, relative to the index from stock level up, based on closing prices.
Despite this, the managers remain optimistic, arguing that there is “a structural tailwind for growth in the years ahead” as the population ages, treatments become more expensive and need for health insurance coverage grows.
However, in the top five, the managers highlighted Alnylam Pharmaceuticals, which received positive results from its late-stage trial to treat a rare heart condition – an achievement that could give it wider access to the patient population.
“We took some profits on shareholders’ behalf after the share price rose by 80% but we remain excited by the company’s potential to address even larger patient populations,” the managers said.
In contrast, Monks sold its position in Moderna, citing disappointing revenue from the Covid-19 vaccine and slow speed to market with its respiratory syncytial virus vaccine.
“Though we continue to believe that they have a potentially exciting pipeline of drugs, our patience has been exhausted,” the managers said.
Kepler’s David Brenchley identifies the investment trusts to consider if the dollar continues to weaken.
Perhaps it’s the financial writer in me, but our long-awaited holiday to Japan was hastened by a currency that had moved heavily in our favour; the same may be the case for the US next year.
We decided to take in the sights of Tokyo, Kyoto, Nara and Osaka in May, to take advantage of a weak yen. The GBP/JPY exchange rate had climbed by c. 50% over the past five years, from c. 130 five years ago to c. 195.
Sterling has climbed against the US dollar, too. Perhaps that will be our next big trip.
The GBP/USD exchange rate has risen c. 30% in the past three years, from c. 1.05 to c. 1.37 at the time of writing. You’ll recall that during the Truss premiership there were fears the pound would hit parity with the dollar.
Sterling’s four-year high against the dollar may be good news for holidaymakers, but it’s not so good for those UK-based investors whose portfolio is heavily weighted to USA Inc.
During this period of dollar weakness (since 28 September 2022), the S&P 500 has generated a total return of c. 70%, yet UK (and other Europe-based) investors have not kept up with this. The iShares Core S&P 500 UCITS ETF, denominated in sterling, is up c. 33.6%, according to FE fundinfo.
Currency movements are notoriously difficult to predict, but it’s prudent to at least consider the risk that depreciation could drag on your returns when investing overseas. The S&P 500 has powered ahead since 2022, but sterling investors would have been better off putting their cash into the iShares Core FTSE 100 UCITS ETF, which has returned 37.8%.
This is a far cry from the post-financial crisis period when a strong dollar worked in our favour. Indeed, the iShares Core S&P 500 UCITS ETF returned c. 354% in the 10 years to 28 September 2022, versus a US dollar return of c. 196% from the S&P 500.
Now, a rethink of this dollar dependence seems sensible. Bear in mind that president Trump wants a weaker dollar so that the US becomes more competitive from an export perspective as well as to shrink its trade deficit.
So, what, if anything, should a non-US dollar denominated investor do if the greenback continues to slide?
Most obviously, all things being equal, domestically oriented investments become more attractive. Broadly, this is because you don’t have to take on any currency risk – and we’ve already shown that in sterling terms the FTSE 100 has outperformed the S&P 500 recently.
The nuance here is that only c. 30% of FTSE 100 companies’ revenues come from the UK, with a large portion of that being US dollar sales. So, perhaps a more interesting place to look would be the UK small- and mid-cap segment, where companies are more geared to the UK economy. FTSE 250 companies generate c. 45% of revenues domestically and that number will be lower for small-cap firms.
Take Rockwood Strategic, which invests at the very bottom of the small-cap segment, in micro-cap companies. Rockwood Strategic’s portfolio generates roughly half of its revenue from the UK, with the other half coming from the US as well as continental Europe, Asia and Africa.
From a mid-cap perspective, consider Schroder UK Mid Cap, which has been boosted by its domestic exposure, such as housebuilders and other companies down the housebuilding supply chain including brick makers.
Emerging market economies have tended to be negatively correlated with the US dollar in that when the dollar rises, emerging markets generally do badly. If this is the case, it’s fair to suggest that the reverse should hold true and that as the dollar continues to weaken, emerging markets will thrive.
That’s particularly true of the countries at the smaller end of the emerging complex, which tend to have more US dollar debt, suggesting that BlackRock Frontiers could benefit.
Fidelity Emerging Markets is an interesting option here, in that it is a differentiated option in the sector. Managers Nick Price and Chris Tennant are very valuation-focused, giving them the flexibility to stray from the benchmark, which leads them into small- and mid-caps, as well as having the ability to short companies with weak balance sheets.
A further asset class that has benefited from lower dependence on the US dollar as a source of funding is gold. Aside from it doing well in an uncertain geopolitical environment, central banks in countries with big US dollar revenues have been diversifying and reducing their exposure to the currency. To do this, they’ve been buying physical gold.
One beneficiary of this trend has been Golden Prospect Precious Metals, which continues to be a standout performer with a share price total return of c. 79% over the past year. High conviction exposure to smaller-cap miners, where the managers still see compelling valuations, has contributed to this and Golden Prospect Precious Metals still trades on a discount of c. 15%.
Of course, this is not all to say that wholesale portfolio changes are merited. The US market continues to chug along and it’s possible that the dollar could perk up at some point. However, most signs suggest that an ever-strengthening dollar will no longer provide a big boon to returns from your Stateside exposure. Diversification seems more important today than ever.
David Brenchley is an investment specialist at Kepler Partners. The views expressed above should not be taken as investment advice.
Trustnet finds out how European equities have caught investors’ eyes this year.
Investors have turned positive on European stocks with the opening months of 2025 seeing them outpace US equities, but exactly which of the region’s stocks and funds are performing the best?
The June edition of Bank of America’s closely watched Global Fund Manager Survey found a net 34% of asset allocators are overweight European equities. This is 0.8 standard deviations above the long-term average and reflects vastly improved sentiment towards the once-unloved region.
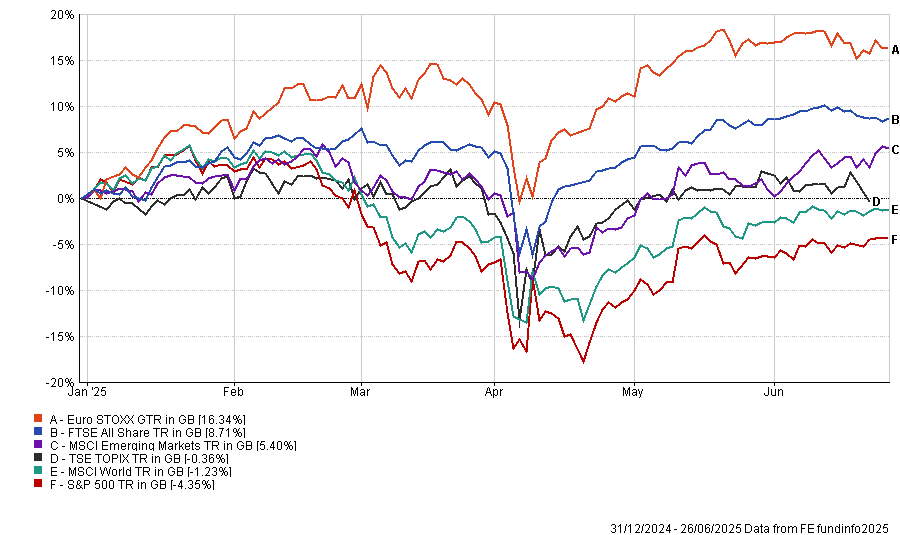
There is no doubt that 2025 is turning out to be a strong year for European equities. Since the start of the year, the Euro STOXX index has made a 18.3% total return (in sterling terms), compared with a 0.6% loss from the MSCI AC World index.
Performance of Euro STOXX vs other equity indices in 2025
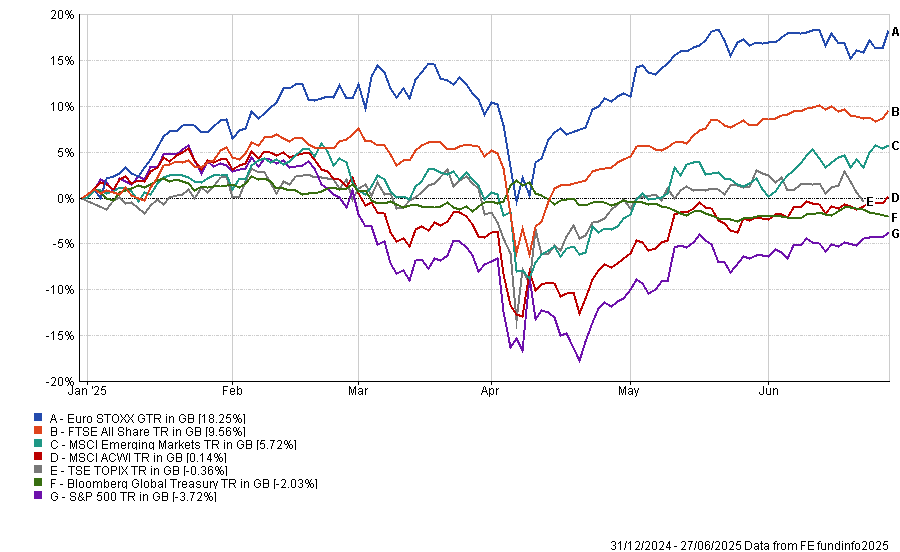
Source: FE Analytics. Total return in sterling between 1 Jan and 27 Jun 2025
As the chart above shows, European stocks have outpaced all the major equity regions and government bonds by a wide margin this year. This includes US stocks – the former market darlings – as tariff threats, political uncertainty and high valuations caused investors to rotate away from the US.
Alex Holroyd-Jones, multi asset portfolio manager at Ninety One, also highlighted the positives for Europe: “A confluence of macroeconomic forces is building a more constructive case for European equities. Chief among them is the region’s cyclical upturn.
“The eurozone is showing signs of recovery after weak growth for much of the last two years. Business sentiment, measured by [purchasing managers’ indices], is climbing, led by improvement in manufacturing. Consumer confidence is also recovering, buoyed by real wage growth as inflation cools and employment remains resilient. A new credit cycle has emerged, with credit growth regaining after a period of contraction. Europe’s long-idling growth engine is finally gaining traction.”
Performance of European equity sub-indices in 2025
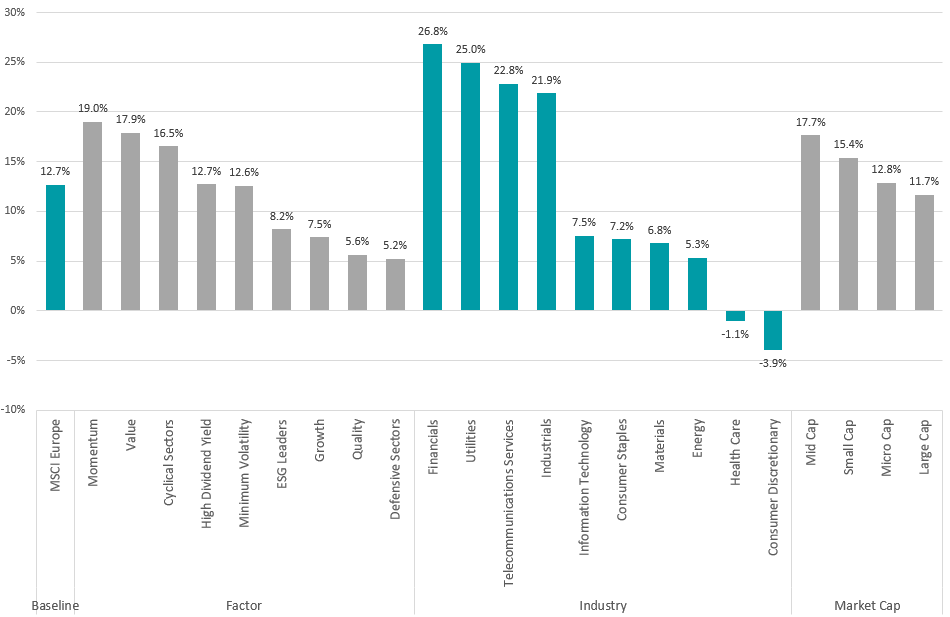
Source: FinXL. Total return in sterling between 1 Jan and 27 Jun 2025
While European stocks have had a strong first half of 2025, the gains haven’t been evenly spread. Financials, utilities and telecoms stand out with returns well above the MSCI Europe benchmark.
These sectors are seen as stable and income-generating, especially in an environment where interest rates remain high and economic uncertainty lingers. Investors are leaning into dependable earnings and steady cash flows rather than chasing more speculative growth.
The pattern is clear in factor performance too. Momentum and value stocks are making the highest returns, while growth and quality have fallen behind, showing a clear shift toward cheaper but proven names over expensive future growth potential.
On an individual country level, the strongest returns have come from Spain (up 29.4%), Norway (24.8%), Austria (24.4%), Italy (21.6%) and Ireland (20.2%). Denmark is the only constituent of the MSCI Europe index in negative territory this year, down 9.4%.
This has acted as a strong backdrop for European equity funds. Of the 250 funds in the IA Europe Excluding UK, IA Europe Including UK and IA European Smaller Companies sectors, 241 - or 96.4% - have made a positive return in 2025 so far. The 25 with the highest returns can be found in the table below.
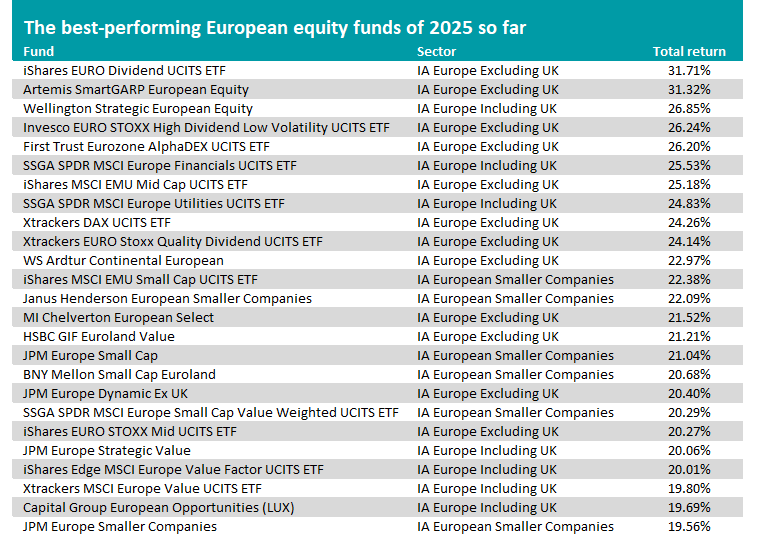
Source: FE Analytics. Total return in sterling between 1 Jan and 27 Jun 2025
At the top of the table, iShares EURO Dividend UCITS ETF reflects the ‘stable and income-generating’ theme mentioned above. It invests in eurozone companies with the highest dividend yields, with 50.2% of its portfolio in financials, 10.7% in utilities and 5.8% in telecoms.
Invesco EURO STOXX High Dividend Low Volatility UCITS ETF, SSGA SPDR MSCI Europe Financials UCITS ETF, iShares MSCI EMU Mid Cap UCITS ETF and SSGA SPDR MSCI Europe Utilities UCITS ETF also reflect some of the previously highlighted themes.
The £905m Artemis SmartGARP European Equity fund is the highest-ranked active fund in 2025, making a 31.3% total return. Manager Philip Wolstencroft has been running the fund since its launch in 2001 using the SmartGARP process, which seeks out companies growing faster than the market but on lower valuations.
Its biggest sector allocation is to financials (accounting for 41.6% of the portfolio), followed by industrials (11.8%) and healthcare (10.2%). Italy, Spain and France are the largest country weightings.
Analysts at Rayner Spencer Mills Research said: “This fund is suitable as a core investment or for use alongside a large-cap or passive vehicle. The mid-cap weighting is significantly higher than that of the market and introduces investments that are often not found in the fund’s peers. In this way, the fund provides diversification, particularly relative to strategies that are more growth or large-cap orientated.”
Wellington Strategic European Equity is in third place with a 26.8% total return this year. Unlike many of the funds in the table, this resides in the IA Europe Including UK sector, with the UK being its largest geographical allocation.
Manager Dirk Enderlein looks for companies with “superior structural free-cash-flow and earnings growth outlook and a strong competitive positioning combined with attractive valuation levels”. However, the fund is at capacity and currently soft closed to new investments.
Of the 25 best European funds this year, a handful were also in their sectors’ top quartile over the previous three and five years, suggesting their recent strength is not limited to the current market backdrop.
These funds are Artemis SmartGARP European Equity, Wellington Strategic European Equity, SSGA SPDR MSCI Europe Financials UCITS ETF, WS Ardtur Continental European, Janus Henderson European Smaller Companies, BNY Mellon Small Cap Euroland and SSGA SPDR MSCI Europe Small Cap Value Weighted UCITS ETF.
Looking forward, Ninety One’s Holroyd-Jones pointed out that risks remain for European equities, as the continent is reliant on external demand, particularly from China, and therefore vulnerable to US trade policies. It is also a net importer of oil, so further conflict in the Middle East could increase the risk of an oil price shock adding to inflation.
However, he finished: “For investors willing to look beyond short-term noise, Europe offers the potential alignment of improving macro fundamentals, supportive policy, attractive valuations and the prospect of renewed capital inflows away from US assets.
“The eurozone may not displace the US as the epicentre of global equity markets, but its risk assets are well positioned to outperform over the medium term as global capital rebalances.”
The manager explains why businesses such as Lloyds, Frasers Group and DFS look particularly compelling.
The recent popularity of defence stocks has made it challenging to find opportunities that still have room to run, according to Fidelity’s Alex Wright.
As geopolitical tensions boiled over, defence investment has been thrust into the limelight, with NATO members recently committing to spending 5% of GDP on defence. This is the latest in a string of positive developments for defence companies, causing the FTSE All Share Aerospace & Defense index to climb 64.3% so far this year.
This is significantly ahead of the wider FTSE All Share (up 9.1%), as well as the S&P 500 and the MSCI AC World, as seen in the chart below.
Performance of the indices year to date
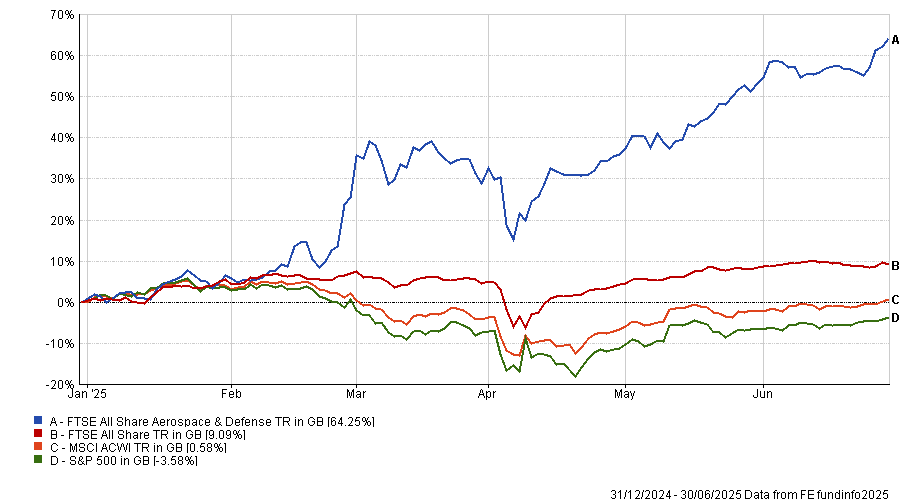
Source: FE Analytics. Total return in sterling
Following this, defence-focused funds have surged in popularity. For example, the WisdomTree European Defence ETF has accumulated $3bn in capital in just three months.
However, Wright explained: “I think defence has become extremely fashionable and therefore valuations are too high, so we’re reducing it.”
This marks a turnaround in Wright’s approach, with his Fidelity Special Values trust and Fidelity Special Situations fund typically having very high allocations to defence, he explained.
While both portfolios currently hold Babcock, Serco and Rolls-Royce, these positions were heavily reduced since 2020, due to most of the surge in defence spending being already priced in.
Recent trades in Fidelity Special Situations and Special Values
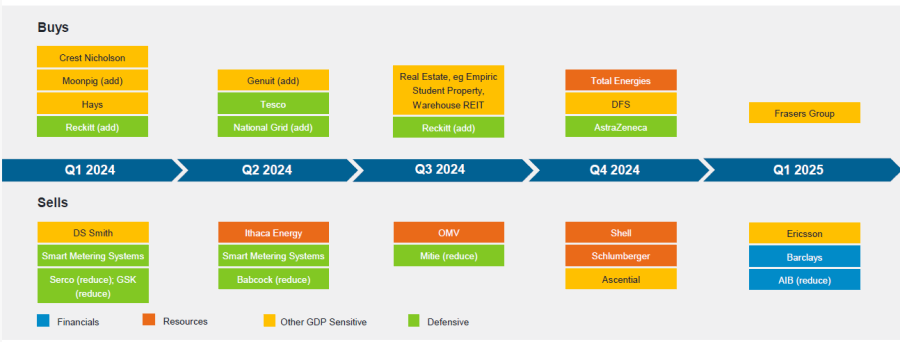
Source: Fidelity International.
While he conceded that the defence has done “a lot better than we would have expected”, other areas appeared more compelling: “Overall, I think defence has become fashionable, but I would say banks are coming back and have a lot further to go.”
For the first time since 2016, Wright has raised his allocation towards Lloyds Bank. Restrictive regulations hit banks hard and Lloyds had particularly suffered, but the tone seems much better from here, the Fidelity manager said.
“In the UK, there’s been an easing of the regulatory burden, which had been very onerous for banks,” he said.
Partially, this is because of the need to remain globally competitive. The US is making “a lot of noise” about deregulation and if other developed markets do not follow suit, the US will continue to drain capital from the rest of the world. To prevent this, he argued that regulators have been easing up on banks.
Most UK banks are also extremely cash-generative with plenty of excess capital, he explained. Traditionally, banks used this capital to fund share buybacks, but as banks perform well, buybacks become more expensive. As a result, many UK banks are opting to grow through buying out smaller competitors.
“It makes a lot more sense for these banks to buy other banks, rather than buy your own, which is essentially what you do in share buybacks,” he said.
As a result, Wright also holds significant positions in NatWest and Standard Chartered. All three banks are up so far this year, as demonstrated on the chart below.
Share prices vs the index year to date
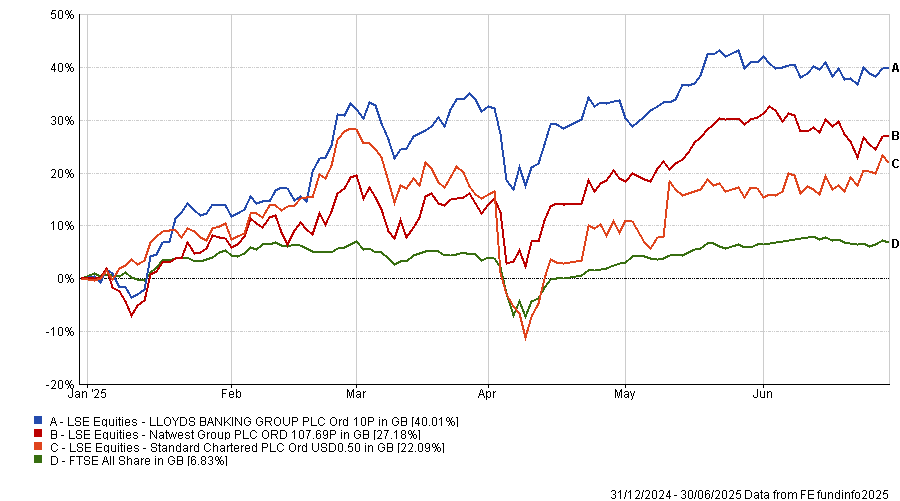
Source: FE Analytics. Share price in sterling
However, he noted that he is not positive on banks universally, with the increased position in Lloyds being funded by selling out of Barclays.
The more domestic companies in the UK index have also been appealing this year, he explained. Businesses that are sensitive to gross domestic product (GDP) are becoming more attractive in a period where dollar assets seem to be risky. Additionally, the UK consumer is in a much stronger position than the narrative suggests.
“I think the interesting thing this year is that consumers have a lot of money, with wage increases above the level of Inflation and savings at a very high level,” he said. “There has just not been that confidence to spend.”
Playing on this, one of the biggest recent additions to the portfolio is Frasers Group, formerly known as Sports Direct.
Trading at a price-to-earnings ratio of just 6x, despite a strong balance sheet, it is an “exceptional value” opportunity. Additionally, Frasers Group is “very different” to its average competitor because it has stakes in many other retail companies, such as Hugo Boss and ASOS.
Another domestic stock Wright favoured this year is sofa retailer DFS. It rallied after some very depressed market sales and is benefiting from challenges to some of its more direct competitors, such as SCS.
Share prices vs the index year to date
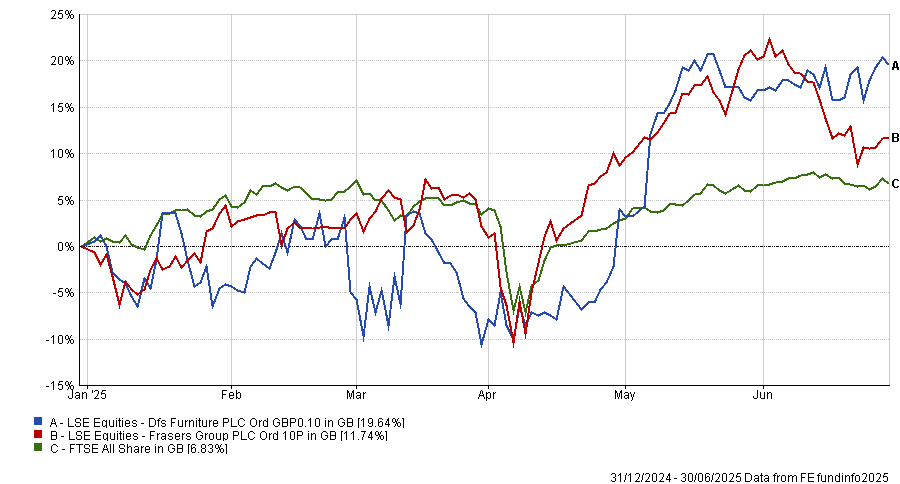
Source: FE Analytics. Share price in sterling
“These more UK domestic areas have been a theme for us this year,” Wright said. “It’s been out of value and out of favour and therefore has good valuations. We can buy into those.”
Over the past one, three, five and 10 years, Fidelity Special Situations and Fidelity Special Values have delivered top-quartile returns in the IA UK All Companies and IT UK All Companies sectors, respectively.
Performance of strategies vs sectors and index over the past 10yrs
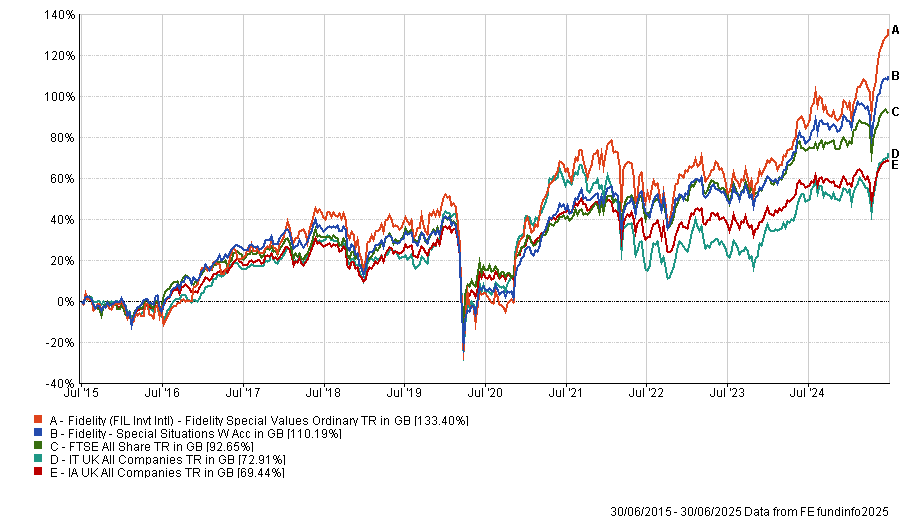
Source: FE Analytics
Fund selectors reveal which investment companies on a premium are attractive and which are not.
The number of investment trusts trading at a premium has risen since 2024, with 24 vehicles now above net asset value compared with 19 last year, according to data from AJ Bell and the Association of Investment Companies (AIC) published last week.
However, experts warned that premiums and discounts should be assessed individually, rather than seen as evidence of a broader sentiment shift or market-wide repricing. In fact, the numbers are still too small to be talking about any broad-based shift, with most premiums confined to a small list of outliers.
The outliers
The most expensive trusts right now are JPMorgan Emerging Europe, Middle East & Africa and British & American, trading at 310.8% and 72.3% premium to net asset value (NAV), respectively.
The price of the former, previously known as JP Morgan Russian Securities, is based on its NAV with the once-significant Russian exposure rebalanced to zero. According to analysts, the market is counting on those assets being written up quite heavily if or when the war in Ukraine and subsequent sanctions on Russia end.
“Whether that deserves a 300% premium is another thing,” said Daniel Lockyer, senior fund manager at Hawksmoor.
British & American is another exception: with just under £4m of assets under management, a high level of internal ownership and a 30% allocation in one underlying asset (healthcare company Geron), it remains well off the radars of most investors.
Only two other trusts have a double-digit premium. One is 3i Group (61% premium to NAV), whose premium is driven by the high demand for Action, a European supermarket chain that makes up 60% of its portfolio.
“3i is pretty much the only way to get access to Action and a lot of managers are interested in the stock right now,” Lockyer said.
However, he would prefer “a less binary exposure” through another trust, NB Private Equity.
“It has a 5% stake in Action and lots of other things as well, plus and it's trading on a 31% discount.”
Performance of fund against index and sector over 1yr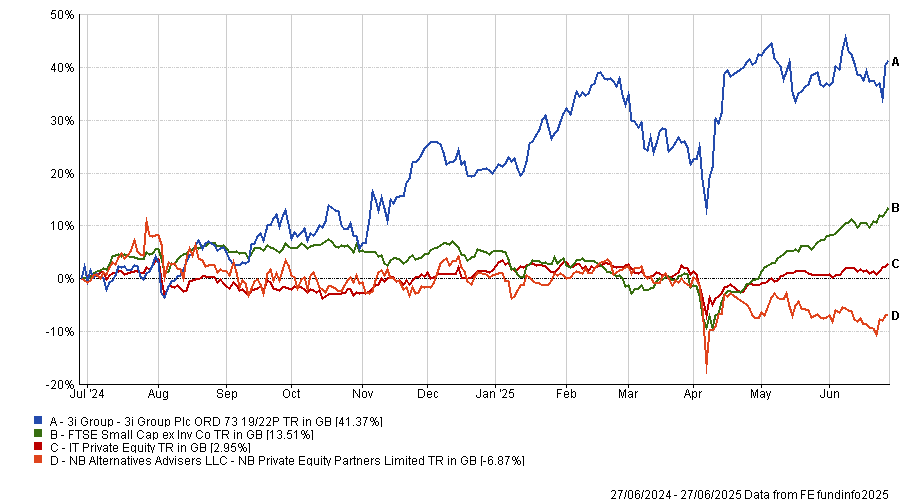
Source: FE Analytics
Finally, Doric Nimrod Air Three (19.2% premium), an aircraft leasing special-situation portfolio, is another peculiar case, linked to the opportunity of selling airplanes to the leasing company at an appraised valuation.
But Lockyer said “it's not really worth dwelling too much on this first group” as they are all extreme cases.
Darius McDermott, managing director at Chelsea Financial Services, also preferred trusts trading on discounts.
“The risk with buying at a premium is that underperformance can hit twice – through weak NAV and a reversion to discount – which can be painful. We're generally more comfortable backing quality names trading below NAV, where the margin of safety is greater,” he said.
Jim Harrison, investment director at Chancery Lane, was even blunter, saying that he “would not go anywhere near any of them”, as premiums above 5% are “almost never worth it”.
With the exception of the four above, all the remaining trusts have a premium of 4% or below.
Trusts worth paying for
There are certainly occasions where it makes sense to pay a premium, according to McDermott.
A good example are the Ashoka trusts India Equity (2% premium) and WhiteOak Emerging Markets (0.4% premium), both of which have delivered “standout performance” to justify the small premiums.
He particularly liked Ashoka India as it has “comfortably led its sector since launch” and the performance fee is tied to alpha generation, which “helps align the manager’s incentives with investors”.
Lockyer noted both vehicles have a “very good, shareholder-friendly structure” in the form of an annual redemption facility, which allows investors to exit at NAV every year and keeps their price from oscillating too much.
Performance of fund against index and sector over 1yr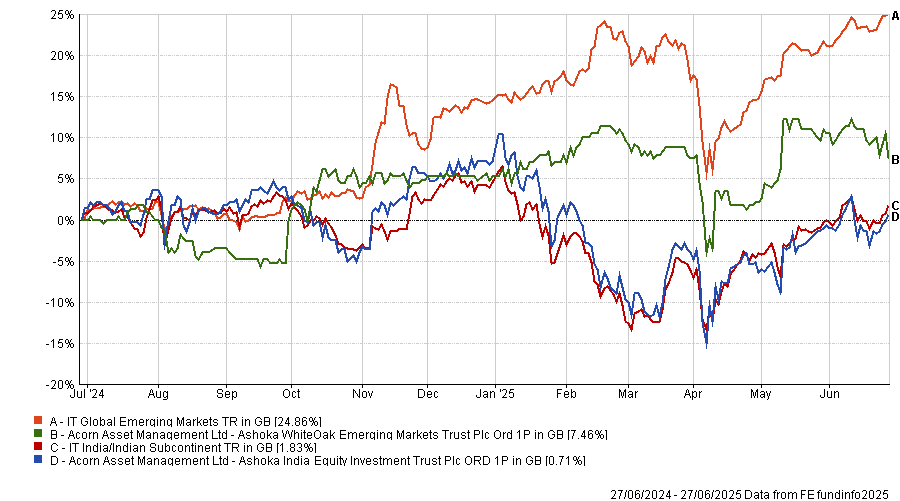
Source: FE Analytics
Rockwood Strategic (3.1% premium) has “defied the gloom around UK smaller companies to deliver outstanding performance” through a high-conviction, hands-on approach making “smart” use of the investment trust structure, McDermott said.
Lockyer agreed and added Law Debenture to the trusts he would currently own: “It has been around forever and everyone loves it”.
It has a “unique nature”, with a professional services company that “enhances the yield pays a lot of expenses as well”. “That's definitely one reason why that one's trading on premium, and it's very good,” he said.
Lockyer finished his list with the Achilles Investment Company (0.7% premium) and Onward Opportunities (0.4% premium).
Premiums not worth paying
The 24 trusts currently on a premium include many income strategies, but investors often overpay for income, according to McDermott, who noted “there are plenty of high-yielding trusts available at a discount”.
“That said, it’s easy to see why income investors gravitate toward trusts with a long history of dividend consistency,” he added.
The City of London Investment Trust (which trades at 1.3% premium to NAV) is a prime example of that, he said, having increased its dividend every year since 1966 and consistently outperformed the FTSE All Share and its sector over one, three, five and 10 years while charging just 0.37%.
Lockyer also mentioned Henderson Far East Income, which people love because of the high yield (currently 11%), “but the total return has been lower than other Asian income investment trusts that pay a lower, more sensible yield”, such as Schroder Oriental Income, he said.
Performance of fund against index and sector over 1yr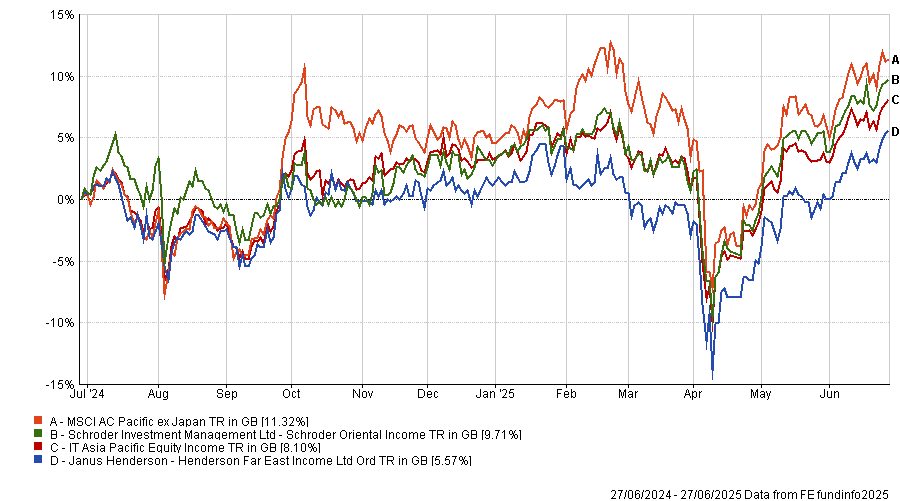
Source: FE Analytics
“You must think on a total return basis, whether you're an income manager or growth manager,” he said. “You can't sacrifice the capital at the expense of pushing for yield.”
Harrison, who uses the Henderson fund, disagreed and argued it is “very useful for people who need instant high income thanks to the sustained double-digit yield”.
However, he recognised that dividend growth is going to be “negligible” and suggested people might want to pair it with another trusts with better dividend growth potential, such as JPMorgan Claverhouse, Murray International or Law Debenture.
Artemis’ William Tamworth teaches some investment lessons from ‘Hollywood accounting’.
What do the following films have in common: Spider-Man (2002), Men in Black (1997) and Return of the Jedi (1983)?
I’ll give you a clue. Spider-Man took in $826m at the box office against a budget of $139m. Men in Black took in $589m against a budget of $90m. And Return of the Jedi took in $483m against a budget of $33m.
Have you worked it out yet? Yes, that’s right: none of these films ever made a profit. Anyway, moving on…
Royalty payments
Hang on! What’s that you say? How can I claim that none of these films ever made a profit when in each case their box-office takings dwarfed their production costs?
Well, if you don’t believe me, let’s ask some of the people whose royalty payments were dependent on these profits. In 2002, Spider-Man creator Stan Lee sued Marvel after the company claimed it received no profits from the film as defined by the terms in his contract.
In 2019, Men in Black screenwriter Ed Solomon referred to the film’s profit statement as “the greatest work of science fiction I have ever been involved with” after it claimed it was still in the red, 22 years after it was released.
And in 2009, the actor David Prowse – Darth Vader himself – told Equity magazine: “I get these occasional letters from Lucasfilm saying ‘we regret to inform you that as Return of the Jedi has never gone into profit, we've got nothing to send you’.”
So what is going on?
Welcome to the world of ‘Hollywood accounting’, where the lawyers and bookkeepers at the major studios and production companies use every trick at their disposal to avoid paying out royalties to the people involved in making their films.
But rather than go into detail about how profits can be understated to confuse actors, writers and directors, we’d rather talk about how profits can be overstated to confuse investors. Because we see it all the time.
Profits are not a statement of fact
Profits are often considered to be a statement of fact rather than a matter of opinion. This is not the case. When something is quantified, people tend to give it more credence. Compare the statements “it was 27oC” to “it was a warm day”. Most people are inclined to give greater weight to the former than the latter (clearly an opinion). Although profits are presented as a specific number, in reality they are a culmination of many opinions.
For example, if a customer has yet to pay for a service it has received, the company that provided this service is allowed to recognise the debt in its profits by reflecting the difference in working capital. When times are tough, customers may be encouraged to ‘buy now, pay later’ (which does not affect profits) rather than demand a discount (which does). Again, the difference is reflected in working capital.
Alternatively, imagine you’re a technology company employing developers to work on a new software release. As they are employees of the company, you would expect their salaries to be a ‘cost’ that hits profits. However, companies have the option to ‘capitalise’ some of these costs – put them onto the balance sheet. Then, when the software is released, they can amortise (gradually write off) the cost of these salaries against sales of the product over its lifetime, thereby deferring the hit to profits.
This can make a substantial difference to adjusted earnings and therefore P/E ratios. For advocates of EBITDA (which we are not) it’s even better – these costs never hit this metric.
Another issue is the use of ‘adjusting items’, which allow companies to ignore ‘non-recurring’ costs when reporting profits. The problem here lies with the definition of ‘non-recurring’ and often sees the day-to-day costs of running a business treated as one-offs and removed from the profit-and-loss statement. A large redundancy may be a legitimate one-off, but what if redundancies happen every year?
A focus on cashflows
So, what can investors do to protect themselves? One method of identifying the sort of practices mentioned above is to focus on cashflows – the amount of money coming in and going out of a business.
While not an exact comparison, think of the Hollywood films mentioned at the start of the article and how the difference between box-office takings and production costs didn’t translate into profits – when a company’s cashflow statement looks substantially different from its reported earnings, that immediately makes us suspicious.
Not foolproof
This technique doesn’t always work. Often there’s a credible explanation for why the numbers are different (and it’s worth noting that all the practices mentioned above are completely legitimate). In the past, focusing too heavily on cashflows has caused us to sell out of some companies we should have kept hold of and to miss other opportunities entirely.
And while it can help us steer clear of frauds, it isn’t foolproof: we didn’t pick up on what was going on at Patisserie Valerie, for example, as its profits and cashflows looked immaculate. In that case we were plain lucky – the shares looked too expensive for us, so we never invested.
But over the years, managing money in this way has repeatedly helped protect our investors from share prices falls when companies are struggling. Just as importantly, we have found that a predictable and growing cashflow that is allowed to compound over the long term is an underappreciated driver of returns, allowing us to take full advantage of the small-cap effect.
You can forget about Spider-Man, Darth Vader and everyone else in Hollywood for that matter – to us, cashflow is the real superstar.
William Tamworth is co-manager of the Artemis UK Smaller Companies fund and the Artemis UK Future Leaders investment trust. The views expressed above should not be taken as investment advice.
Nothing stops optimism in a positive month for markets.
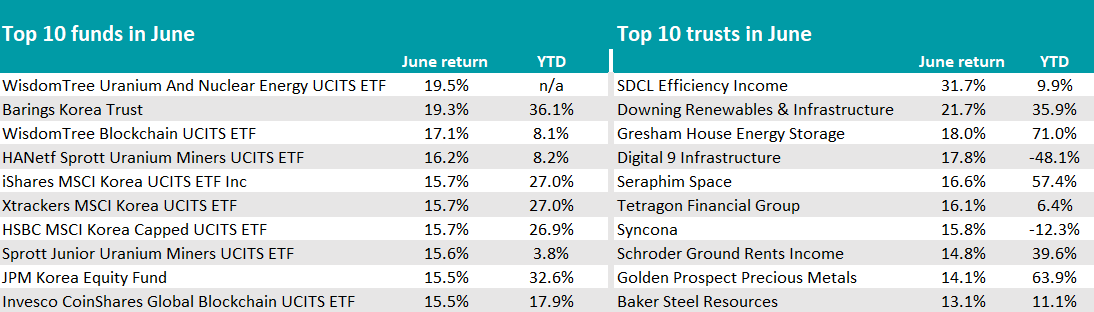
June was a positive month for investors in funds and trusts, with the majority of sectors closing the period with a positive average return.
Energy was a key theme both geopolitically (with a volatile oil price following the attacks on Iran) and in the investment world, where energy-focused investments stood out.
Grabbing centre stage was the SDCL Efficiency Income trust, with the best performance of the month (31.7%). Two more IT Renewable Energy Infrastructure strategies – Downing Renewables & Infrastructure (21.7%) and Gresham House Energy Storage (18%) – completed the top-three trusts.
A similar trend was reflected in the open-ended space by the WisdomTree Uranium And Nuclear Energy UCITS ETF, which topped the funds ranking with a 19.5% return. Exchange-traded funds (ETFs) investing in uranium miners were also high up in the list, with HANetf Sprott (16.2%) and Sprott Junior (15.6%) being the two main ones.
Source: FinXL
The other story of the month was Korea, whose equity market has delivered the strongest first-half performance in 20 years, as Fairview Investing director Ben Yearsley noted.
“The KOSPI index had a good run post the Korean election results and on hopes of an imminent US rate cut that tends to lift all of Asia and emerging markets,” he said.
With a gain of 19.34%, Barings Korea was the second-best fund overall, followed by iShares, Xtrackers and HSBC ETFs that track the country’s stocks, as well as the JPM Korea Equity fund, which returned 15.5% over the month.
The third theme this June was technology.
The third-best performance overall in the open-ended space came from the WisdomTree Blockchain UCITS ETF (17.1%), with Invesco CoinShares Global Blockchain UCITS ETF not too far off – demonstrating the prevailing sentiment was to be risk-on.
“Optimism has not been dented, but will be tested this month with the ending of the 90-day pause in US-imposed tariffs,” Yearsley warned.
There were no signs of that fear in June, with the S&P 500 and the Nasdaq both closing the month at fresh record highs. The most notable active funds in the space were Liontrust Global Technology (11.3%) and Polar Capital Global Technology (11.1%).
The whole technology sector has staged a major rebound after a challenged first quarter, but returns for UK investors were “more than wiped out” by dollar weakness, with very few hedging their equity exposure.
For Yearsley, if the trend is for a weaker US dollar, then “investment strategies might need to be rethought”.
Performance of indices over the year to date in pound sterling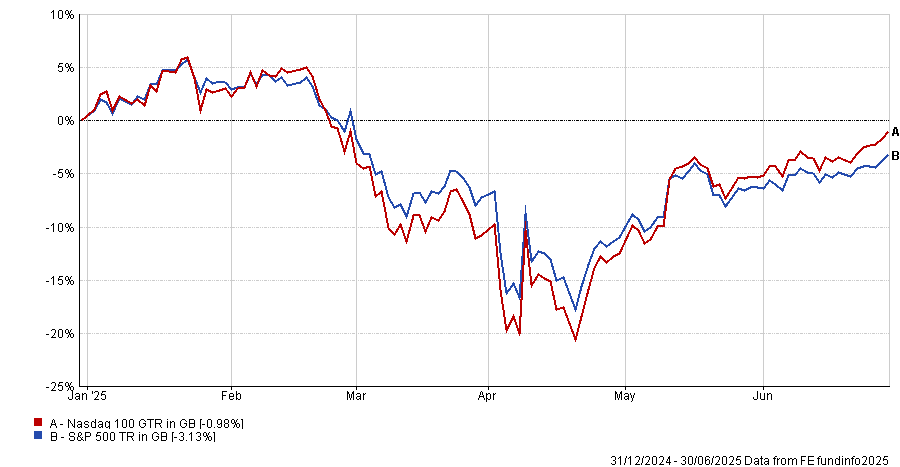
Source: FE Analytics
Commodities and natural resources funds also picked up in June, with a resurgence of names such as SVS Baker Steel Electrum and Pictet Clean Energy Transition within funds, and Golden Prospect Precious Metals and Baker Steel Resources in the investment trust universe.
At the foot of the tables last month was a cohort of funds focused on the consumer, as fears around heightened inflation due to US tariffs started to drive the narrative.
It affected European funds such as the SPDR MSCI Europe Consumer Staples UCITS ETF and IA Global funds such as the iShares S&P 500 Consumer Staples UCITS ETF, but especially US funds, as the table below shows.
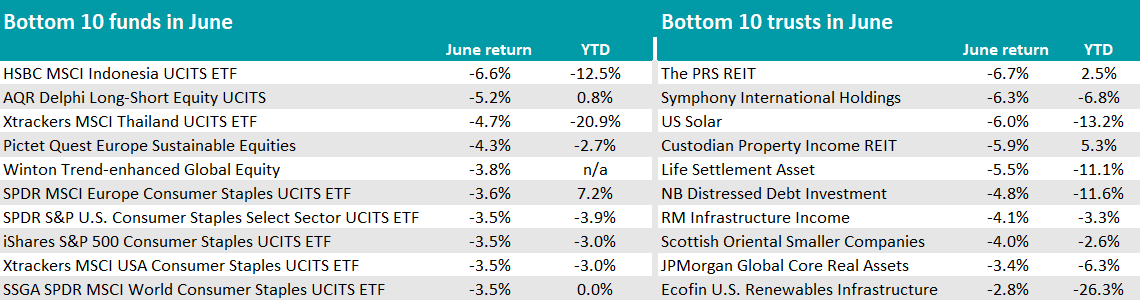
Source: FinXL
“The last six months has been one of the most fascinating yet random in the last decade,” Yearsley noted.
“AI, Trump, wars, more Trump – actually Donald Trump has impacted many areas, with AI possibly the only one he’s not been involved in. Even then, China’s resurgence in the tech space has been largely down to having to innovate without the latest US chips.”
Former M&G executive to lead asset manager's multi-asset capabilities from late 2025.
Ninety One has appointed David Knee as its new head of multi-asset. With over 30 years of experience, Knee is set to take responsibility for the firm’s multi-asset teams later this year.
Knee has managed multiple multi-asset and fixed income portfolios across South Africa and the UK – most recently serving as co-deputy chief investment officer for fixed income at M&G Investments in London. He also held the position of chief investment officer for the firm in South Africa from 2016.
Domenico Ferrini, co-chief investment officer at Ninety One, said: “Multi-asset sits at the intersection of many of our specialist capabilities.
“In addition to his co-portfolio manager responsibilities, [Knee] will focus on fostering even greater collaboration across teams and strengthening the macro research process that underpins our strategies.”
Ferrini pointed to Knee’s expertise in asset allocation and fixed income selection, noting that this will be "instrumental in driving improved investment outcomes”.
Alongside Knee’s appointment, Ninety One has promoted Rehana Khan to co-head of South Africa equity and multi-asset, working with Hannes van den Berg.
Khan, who joined the firm in 2020 and previously worked with Knee at M&G Investments Southern Africa, will work with the Global Strategic Managed portfolio management team, utilising her equity expertise.
Shift reflects persistent geopolitical risks and uncertainty.
Quilter’s WealthSelect Managed Portfolio Service (MPS) has increased its allocation to fixed income and reduced equity exposure, citing ongoing risks to growth and inflation.
WealthSelect portfolio managers Stuart Clark, Bethan Dixon and Helen Bradshaw have chosen to maintain a tactical underweight to equities relative to the strategic asset allocation, despite the fact equity markets have rallied since US president Donald Trump’s so-called ‘Liberation Day’, which saw the unveiling of a host of aggressive tariffs.
Instead, the team has notably increased the MPS’ fixed income exposure, although it is maintaining an underweight position versus the strategic asset allocation, favouring a blend of fixed income, alternatives and cash.
Bradshaw said: “While markets have rallied following Trump’s ‘Liberation Day’, we remain relatively cautious in our outlook.
“The portfolios have been rebalanced to acknowledge market momentum but also to defend against the potential volatility stemming from the ever-changing geopolitical tensions, inflationary pressures and uncertainty around global trade.”
The rebalance included the addition of the Vanguard Euro Government Bond Index fund, which has been introduced to reflect the potential for divergence between European and US economic and monetary policy.
It also aims to account for a declining appetite for US government debt, both through the Vanguard fund and the iShares Green Bond Index. The latter provides exposure to predominantly European bonds whereby the proceeds are utilised to achieve a positive environmental outcome.
Within WealthSelect’s sustainable portfolios, the team added T.Rowe Price Global Impact Credit and increased its allocation to Goldman Sachs Sovereign Green Bond.
In addition, the managers have maintained the UK overweight position – opting to increase mid-cap domestic exposure via Quilter Investors UK Equity Opportunities – while trimming European equities and redirecting slightly to emerging markets and Japan.
“In this environment, resilience and adaptability are key, and our portfolios are well positioned to deliver both,” Bradshaw said.
Strong inflows underscore investor momentum amid heightened NATO-driven defence spending.
The WisdomTree Europe Defence UCITS ETF has gathered $3bn in assets just three months after its launch in March this year.
It was the first ETF to focus solely on European defence and its rapid growth in assets under management reflects strong investor demand for exposure to the region’s military and strategic sectors.
The ETF’s growth coincides with a major shift in European defence policy, as NATO moves from symbolic benchmarks to enforceable spending goals backed by multi-year government commitments.
NATO’s updated guidance calls for 5% of GDP to be directed toward defence, including 3.5% for core capabilities and 1.5% for adjacent sectors such as cybersecurity and infrastructure.
Adrià Beso, head of distribution, Europe at WisdomTree, said: “The NATO summit has made it clearer than ever: European countries are stepping up their defence commitments, with increased spending now a top priority. For investors, this marks the next phase of a long-term shift.
“As governments channel more funds into the defence space, we see strong potential for sustained growth across the sector. Companies that support modern military capabilities and critical infrastructure are well-positioned to benefit, making European defence an increasingly important area for capital allocation.”
Legal & General’s Private Markets Access Fund has amassed more than £1bn in assets within 12 months and broadened pension client access.
Legal & General’s Private Markets Access Fund (PMAF) reached £1.3bn in assets under management by the end of June, one year after its launch in 2024.
The fund offers defined contribution (DC) scheme members diversified exposure to private markets. It invests across real estate, infrastructure, private credit and private equity, including assets such as affordable housing, clean energy and natural resources.
L&G launched the fund alongside a new target-date fund default range, the L&G Lifetime Advantage Funds, which makes use of PMAF to access private markets. Since its launch, L&G Lifetime Advantage range has seen inflows of more than £11bn from DC clients, including contributions from the firm’s own employee pension plan.
L&G is a founder signatory of the Mansion House Accord, aiming for at least 10% of DC default fund assets to be allocated to private markets by 2030, with a minimum 5% directed into UK-based private market investments.
Responding to pension scheme demand, L&G has also opened PMAF to defined benefit (DB) clients. The offering features a weekly-dealing structure designed to help manage pension scheme liquidity and allow prudent extraction of surplus capital under the new Pensions Bill.
Eric Adler, chief executive of asset management at L&G, said: “We are pleased to have been an early adopter in designing a solution that enables default schemes with flexible liquidity requirements to access private markets opportunities.
“As private markets continue to open up to new DC and DB members, we expect a continued focus on private markets strategies that can offer income and growth together with positive societal benefits.”
L&G has expanded its private market platform and client offering in recent years, including launches of a £500m affordable housing fund, a €600m clean power fund and a $235m nature and social outcomes strategy.
HANetf’s new defence ETF will target Indo-Pacific-listed companies, amid a regional rearmament push.
HANetf will expand its regional defence fund offerings with a new Indo-Pacific ex-China ETF set to launch in July 2025.
The ETF will provide targeted exposure to Indo-Pacific-listed firms in the defence, aerospace and security sectors. It joins the firm’s existing defence range, including the $2.6bn HANetf Future of Defence UCITS ETF and the €130m HANetf Future of European Defence UCITS ETF.
The launch comes amid rising defence spending and greater focus on military industrial policies across the Indo-Pacific. Countries such as India, Japan, South Korea and Taiwan are increasing their defence budgets and seeking greater self-reliance in arms production.
The new ETF will track the VettaFi Future of Defence Indo-Pac ex-China index, which focuses on companies domiciled in the Indo-Pacific with significant defence revenues. Top constituents include Singapore Technologies Engineering, Kawasaki Heavy Industries and Mitsubishi Heavy Industries, with the biggest geographical allocations being South Korea (45.3%), India (28.9%) and Japan (9.6%).
At the Shangri-La Dialogue in Singapore, US defence secretary Pete Hegseth encouraged Asian allies to follow Europe’s lead, citing NATO members pledging 5% of GDP to defence spending.
Among the regional defence drivers highlighted by HANetf are Japan initiating its largest military build-up since the 1950s, India directing three-quarters of its defence capital budget to domestic manufacturers and South Korea expanding its defence exports with the aim of taking 5% of the global arms market by 2027.
Hector McNeil, co-founder and co-CEO of HANetf, said: “The Indo-Pacific is fast becoming the geopolitical centre of gravity for the 21st century. From Taiwan to the Indian Ocean, rising tensions and a shift toward defence self-reliance are driving a historic rearmament cycle.
"Just as our NATO and European Defence ETFs have helped investors access the new realities of global security, this strategy offers targeted exposure to companies within the Indo-Pacific region.”
Small differences between indices can have big consequences for a portfolio if investors aren't aware of them.
Simply combining multiple index trackers in a portfolio can carry a “hidden risk” that increases volatility and impacts returns, according to Vanguard.
Blending index funds or exchange-traded funds (ETFs) is a commonly adopted strategy to build low-cost portfolios but analysis by the passive giant has identified how differences in index construction can result in material deviations in portfolio performance.
Although trackers may look the same on the surface, the ways in which index providers define and track value, growth or market capitalisation can vary significantly, Vanguard said, warning that this can lead to significant deviations from benchmark exposures – inadvertently driving up portfolio volatility and affecting returns.
Vanguard’s Andrey Kotlyarenko, equity index senior investment product manager, and William Coleman, head of the US ETF capital markets team, said: “These problems are often invisible until market volatility occurs.
“When turbulence hits, investors can start to see that their portfolios are riskier than the market or than they intended.”
CJ Cowan, portfolio manager on Quilter Investors’ Cirilium range, agreed with the broad point of the research, though he added a note of caution about tone: “While the summary is perhaps more simplistic than we might wish it to be and has more negative connotations than we would want to imply, overall, yes. If you use different index providers, it can lead to increased risk if not managed properly.”
For example, S&P, Russell and CRSP all apply different sets of financial metrics to determine whether a stock is ‘value’ or ‘growth’, Vanguard noted. While they all use price-to-book ratios to assess a company’s value factor, their models promptly diverge, with CRSP using 10 total factors, S&P six and Russell three.
As a result, the three providers categorise the style of 46% of large-cap stocks differently.
Russell and S&P also allow overlap – so the same stock could be in both a growth and a value index. CRSP will allocate each stock exclusively to one style.
The same inconsistency applies to market cap, the Vanguard research noted.
Market cap split across S&P, Russell and CRSP
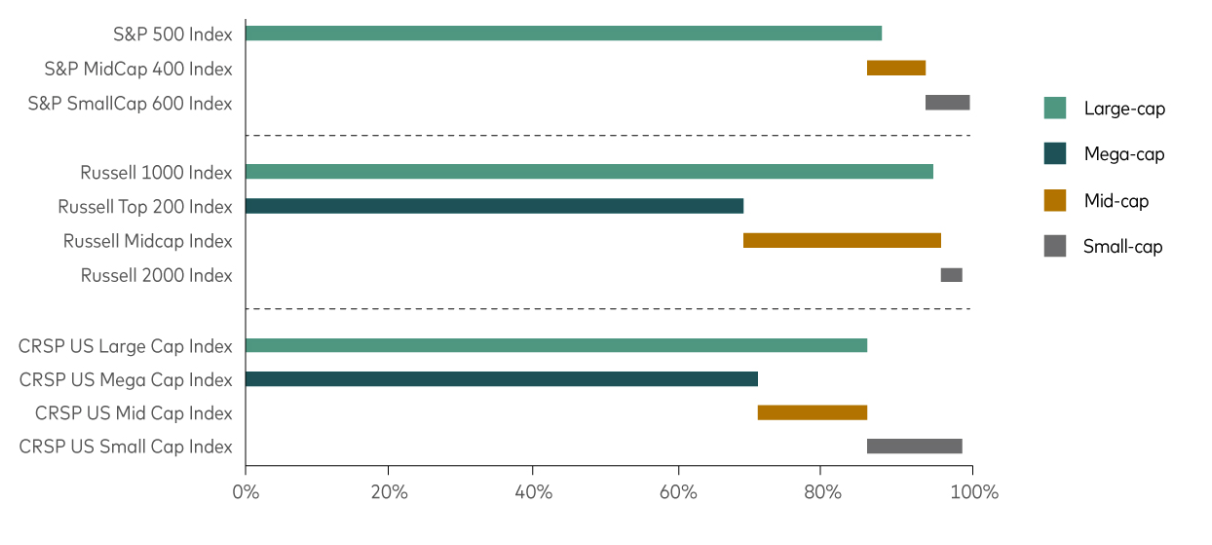
Source: Vanguard calculations using FactSet data as at 1 Mar 2025
Russell and S&P use static stock counts to classify equities based on size, with the Russell 1000 covering 94% of total market capitalisation and the S&P 500 covering 87.5%. The latter also applies a profitability screen which excludes companies and depends on a committee to have the final say as to whether a company merits inclusion.
Meanwhile, CRSP defines large-cap as the top 85% of the market by capitalisation.
Although Quilter’s Cirilium passive range does not use style or market cap ETFs, the firm has found that the index divergence displayed above also spills into regional classifications, particularly in emerging markets, according to Cowan.
“MSCI includes South Korea in its emerging market equity index, FTSE does not, which has led to a noticeable performance difference,” he said. “In this instance we would want to make sure we hold an exact match and indeed this is a change we recently made in our own funds in buying the Amundi MSCI Emerging Markets II ETF.”
While the FTSE Emerging index has zero exposure to South Korean companies, the MSCI Emerging Markets index has a 9.6% weighting to the country with Samsung Electronics being the fourth largest constituent.
Performance of indices over 5yrs
Source: FE Analytics
FE Analytics shows the FTSE Emerging index has outperformed the MSCI Emerging Markets index by almost five percentage points over the past five years, albeit with more volatility and a higher maximum drawdown.
The impact of any of the above variations means picking two index funds with similar names may result in an investor inadvertently doubling up on certain holdings or introducing style drift into the portfolio. This, in turn, may also heighten risk and impact the portfolio’s performance.
Looking under the bonnet
This doesn’t mean mixing funds is a bad idea – only that it requires advisers and investors to review the underlying index methodologies in close detail.
Vanguard's Kotlyarenko and Coleman said: “Understanding the nuances of index construction methodologies and how well funds align with each other can help reduce unintended active risk.
“The fund name or classification is only the start of the story. A small-cap fund following one index provider may include a surprising number of companies that a different provider considers to be large-cap.”
One potential solution may be to stick with a single index provider where possible, Vanguard suggested – a move which would keep exposures consistent, simplify rebalancing and reduce the chance of overlap or misalignment.
Cowan agreed that “within an asset class you should use the same index provider for your strategic asset allocation” to avoid doubling up or missing out on exposures.
However, within actively managed portfolios, there can be benefits to working with multiple index providers, according to Tom Buffham, portfolio manager at RBC Brewin Dolphin.
“The main advantage of using multiple providers is being able to reduce the cost to clients by choosing the provider that is most competitive in any specific asset class or region,” he said.
“Additionally, there may be more targeted strategies, such as small-caps, that we want to incorporate in portfolios.”
The dual-purpose savings scheme is leading savers to make poor financial decisions and squandering billions in public money.
The Lifetime ISA (LISA) has come under fire from MPs, with a Treasury Select Committee report warning that the product’s design may be leading consumers to make poor financial decisions.
The LISA was introduced in 2017 and allows under-40s to save up to £4,000 per year towards their first home or retirement, receiving a 25% government bonus on contributions.
The dual-purpose product has been criticised by MPs for instead potentially diverting savers from more suitable products.
For example, the committee said that cash LISAs may benefit first-time buyers but are ill-suited for retirement saving, as they are unable to invest in higher-risk but potentially higher-return products such as bonds and equities.
In addition, the report warned that the LISA may have been mis-sold to benefit claimants, as funds held in these products can reduce an individual’s eligibility for Universal Credit or Housing Benefit. As such, the committee has asked the Treasury to measure and publish how people on different income brackets are using the product.
The LISA’s 25% withdrawal penalty also came under fire. The charge not only claws back the government-issued bonus but also takes 6.25% of the saver’s own money – meaning they are worse off when making an unplanned withdrawal.
According to the committee, there were nearly twice as many unauthorised withdrawals in 2023-24 (99,650) as home purchases (56,900).
Public spend is also of concern to MPs, with the Office for Budget Responsibility estimating the LISA will cost the Treasury around £3bn over the next five years for 1.3 million open accounts.
Dame Meg Hillier, chair of the Treasury Select Committee, said: “The committee is firmly behind the objectives of the Lifetime ISA, which are to help those who need it onto the property ladder and to help people save for retirement from an early age. The question is whether the Lifetime ISA is the best way to spend billions of pounds over several years to achieve those goals.”
Time for a change?
The report has prompted a wave of reaction from the industry, with advisers and policy experts calling for urgent reform.
Tom Selby, director of public policy at AJ Bell, said the LISA is a “fantastic” savings and investment product when used correctly, but added that it features design flaws which “need to be ironed out”.
He said: “Even the best-laid plans often go awry and it is unfair to punish people with an exit charge that goes beyond simply recovering the government-funded bonus.”
Selby suggested reverting to the system in use during the pandemic, when the penalty only matched the original bonus received on the amount.
Rachael Griffin, tax and financial planning expert at Quilter, pointed out that the LISA’s £450,000 property price cap no longer reflects the reality of the UK housing market.
“Many who have saved diligently find they cannot use their LISA for the property they need without facing a financial penalty,” she said. “This undermines confidence in the product and adds to its complexity.”
The ISA framework more broadly needs to be reformed and simplified to encourage more of a “culture of investment”, according to Richard Stone, chief executive of the Association of Investment Companies (AIC).
“This is vital to help ensure increased financial resilience and wealth, as well as making sure the regime delivers value for money for taxpayers,” he said.
“We share many of the concerns raised in the Treasury committee’s report and agree that the dual purpose of the LISA could lead consumers to make poor asset allocation decisions.”
Redwheel’s Ian Lance explains how the growth of multi-manager hedge funds is reshaping market dynamics.
The gap between the cheapest and most expensive stocks is close to its widest level for fifty years (see Chart 1). While passive investing has played a role in this market distortion, there is another force reshaping markets that receives far less attention: the growth of multi-manager hedge funds, commonly known as ‘pod shops’.
Chart 1: MSCI World value vs growth, average valuation premium

Source: Morgan Stanley, 30 Apr 2025. Past performance is not a guide to the future.
These pod shops operate as platforms that allocate capital to many independent portfolio managers, each running their own strategies with a sector or event-driven focus. The parent fund enforces strict risk controls such as tight stop-loss limits and intraday monitoring, while maintaining market neutrality to allow the parent fund to gear up the strategies.
This structure is designed to deliver consistent, low volatility returns regardless of broader market moves, making pod shops especially attractive to institutional investors seeking stable performance in a low-return world.
Their scale is unprecedented. Citadel and Millenium, the two largest firms, manage $65bn and $73bn1, respectively. Citadel employs around 3,000 employees, less than half of which are investment professionals, whilst Millennium has over 6,000 employees, around half of which are investment professionals2. The collective headcount of pod shops has tripled since 2015, underscoring their meteoric rise3.
But it is their leverage that magnifies their influence beyond what their AUM suggest. Data from the Office of Financial Research (OFR) illustrates that the gross leverage of multi-strategy funds including pod shops has risen from 4x a decade ago to 12x today, while their net leverage has risen from 2x to around 4.5x today4. Combined with high turnover and tight risk controls, pod shops now account for over 30% of US equity trading volume5. They have become the marginal price-setters in the stocks they trade, their flows and reactions shaping intraday and event-driven volatility.
Impact on valuations
Here is where it gets interesting for long term investors: Pod shops operate on short-term horizons. Many penalise managers for holding positions longer than a set period (often 30 days), pushing towards rapid turnover and event-driven trading. This creates a powerful incentive to focus on catalyst events – earnings releases, guidance updates, analyst estimate revisions and regulatory news – that move prices immediately.
Valuation becomes almost completely irrelevant. Their focus is momentum and trend, not whether a company is cheap or expensive relative to intrinsic worth. We can see this trend in action when a pod starts shorting a high-quality company on the basis that the next quarter will disappoint.
The earnings frenzy
Pod shops respond to corporate events within minutes of news releases. Their structure of multiple independent teams, each armed with sophisticated data and analytics, allows instant repositioning. Risk controls further incentivise rapid moves as pods that are slow to react risk underperforming and losing capital allocations.
This has created a market where responses to earnings surprises are both faster and more violent than in the past. Stocks beating expectations see immediate, sharp rallies as pods pile in, while disappointments trigger precipitous drops as pods race to exit or short positions. The effect is most pronounced in the most liquid, widely followed stocks where pod shop activity is most concentrated.
For long-term investors, this creates both frustration and opportunity. It can be alarming to watch companies plummet on a small quarterly earnings miss despite already trading at very low valuations. This sense of frustration was echoed by US value investor Harris Kupperman6 in a recent blog: “I’m genuinely amazed at how these pods will short high-quality, rapidly growing businesses … just because the next quarter will be weak.”
The value investor’s opportunity
If you believe that share prices will eventually be driven by fundamentals and move towards intrinsic value, pod shop influence creates an opportunity. As prices are driven further from intrinsic value, future return potential for valuation-driven investors increases.
The momentum oriented, valuation-agnostic approach provides us with an opportunity to buy quality companies at very low valuations – the very essence of value investing. Recent takeovers and the surge in share buybacks suggests that we may have reached valuation floors, prompting other market participants to step in and exploit these anomalies. This dynamic may presage a better environment for value investing generally.
The rise of pod shops represents a fundamental shift in markets. When combined with passive investing's growth, we're witnessing unprecedented concentration of capital in strategies completely indifferent to valuation.
While valuation may no longer matter to the market's biggest hedge funds, it still matters for long-term wealth creation. For patient investors willing to buy quality businesses at reasonable prices, the current environment may prove rewarding.
Ian Lance is a partner and fund manager in the Redwheel value & income team. The views expressed above should not be taken an investment advice.
1 Source: corporate websites. April, 2025
2 Source: Rupak’s Substack. April, 2025
3 Source: GSAM. April, 2024
4 Source: Rupak’s Substack. April, 2025
5 Source: NSPGroup. March, 2024
6 Harris Kupperman is the founder of Praetorian Capital Management LLC, an investment manager focused on using inflecting trends to guide stock selection and event-driven strategies. Mr. Kupperman is also the author of Praetorian Capital’s public blog, Kuppy’s Korner
With US dominance fading, 2025's second half may reward portfolios that embrace alternatives and local exposures, asset managers say.
The second half of 2025 is about to test the resilience of investment portfolios. After a volatile start to the year marked by tariff shocks, uneven growth and policy uncertainty, leading asset managers are calling time on the old investment playbook.
HSBC Asset Management, Fidelity and Goldman Sachs Asset Management all foresee an investment environment defined by fragmentation, fading US exceptionalism and the growing need to diversify.
For Xavier Baraton, global chief investment officer at HSBC AM, investment conditions are changing “in fundamental ways”, with volatility becoming “a defining feature of the current macro regime”.
“We are moving from a world of unipolar economic leadership to an environment where no single nation holds sway over the global order. Investors must be prepared to adapt tactically and lean into diversification to drive returns and manage risk,” he said.
Fidelity International echoed that theme and Henk-Jan Rikkerink, global head of multi-asset, real estate and systematic, urged investors to “actively rewire their allocations in line with structural moves”, as traditional safe havens such as US equities and treasuries “can no longer shoulder global portfolios alone”.
A combination of policy unpredictability, high valuations, weakening growth and shifting capital flows is challenging the longstanding assumption that US assets offer both safety and superior returns.
Fidelity expects US GDP growth to fall to around 1% this year, as tariffs push inflation up to an estimated 3.5%. This stagflationary risk, where prices rise even as growth slows, is seen as a particular threat to the appeal of US equities and treasuries.
“The first six months of this year have shown us how quickly narratives can change,” said Rikkerink, who added that the US dollar’s role as a global hedge is also starting to erode.
Goldman Sachs and Fidelity highlighted rising concerns around the US fiscal position and, although the region still offers depth and innovation (particularly in artificial intelligence and technology), the case for broadening out is growing stronger.
Regional shifts
One of the main regions that deserves attention, according to all three managers, is Europe (the region was already highlighted as an unintended beneficiary of US policies).
Goldman Sachs AM pointed to the increased fund flows into European equities in the first half of the year, which were driven by more than just US pessimism.
Performance of indices in the past six months
Source: Goldman Sachs, Bloomberg.
Positive drivers include stronger fiscal policy, especially in defence and infrastructure, as well as better valuations and lower concentration risk. Information asymmetry in European markets – due to lower analyst coverage and slower news diffusion – was also seen as a potential advantage for active managers.
However, as the US “catches down” to other developed markets, “the most dynamic opportunities are increasingly found in Asia and emerging markets”, according to HSBC AM’s Baraton.
In particular, China’s advance in artificial intelligence was highlighted as one of the key forces propelling the rest of the region (indeed, emerging markets managers have been waking up to the opportunity in China, as Trustnet recently reported).
But it’s not just equities. Fidelity noted that hard and local currency emerging market bonds (particularly in Brazil and Mexico) offer high yields and “have become more attractive as the dollar depreciates”. A number of managers, including Fidelity’s Mike Riddell, have been vocal about this opportunity since as early as April.
Asset class adjustments
Beyond geographies, fund managers are rethinking the asset classes traditionally used for diversification. HSBC AM and Fidelity both flagged the diminishing appeal of US treasuries as a hedge, citing high issuance, rate volatility and fiscal concerns. The response has been a turn toward European duration, higher-quality corporate credit and hard currency emerging market debt.
Alternatives are also moving closer to the core of portfolio construction. HSBC AM recommends infrastructure and private credit as sources of stable income and diversification. Goldman Sachs AM believes private markets will continue to benefit from investor demand and sees further opportunity in secondary market innovations that provide liquidity and rebalancing flexibility. Hedge funds are also back in favour as potential beneficiaries of volatility and uncorrelated alpha.
Private assets including real estate offer further diversification potential, according to Fidelity, as Rikkerink singled out European real estate as one underappreciated option.
“Investors may find alternative opportunities in real estate, especially through higher-income-yielding European markets which can protect against inflation and through the value-add of 'greening' previously unsustainable buildings,” he said.
A less central US
While agreeing US centrality in global portfolios is no longer guaranteed, all three houses are all still invested in the US, particularly in high-quality businesses with strong margins and balance sheets.
“There is no wholesale rejection of US assets,” the Goldman Sachs AM outlook read. But “improving prospects in other regions, coupled with concerns about US trade policy, fiscal trajectory and institutional integrity, are prompting investors to diversify”.
As Fidelity noted, decades of rising exposure to US assets have created portfolio concentrations that may no longer be justified. Rewiring those allocations – whether through geography, asset class or currency – has now become a priority.
“Diversification has always been important but now it is imperative for portfolios that have become increasingly reliant on US assets over the past 25 years,” Rikkerink concluded.
“Capital outflows and a dollar depreciation mean index weightings will look very different in the future. Those who get ahead of these structural trends may stand to benefit as portfolios rebalance.”
Ninety One’s Alessandro Dicorrado explains why people are missing the point by waiting for international investors to return to the UK.
The UK market does not need global investors to return to be an attractive investment opportunity as it has many unrecognised strengths already, according to Alessandro Dicorrado, manager of the Ninety One UK Special Situations fund.
The UK market is rallying this year, with the FTSE 100 hitting record highs and the FTSE All Share outpacing the US and many other developed markets, as seen in the chart below.
Dan Coatsworth, investment analyst at AJ Bell, said this is “exactly what’s needed to raise the UK market's profile among international investors”.
Performance of developed equity markets in 2025
Source: FE Analytics. Total return in pounds sterling
But for Dicorrado, hoping that international investors will come back is missing the point. “Do I want a revival in the UK? Not really. I don’t think you need anyone to come back”, he said.
Domestic investors have been turning away from the UK for some time. UK equity funds have shed £8bn in net outflows over the past year, according to data from the Investment Association, continuing a trend that has been in play since 2016.
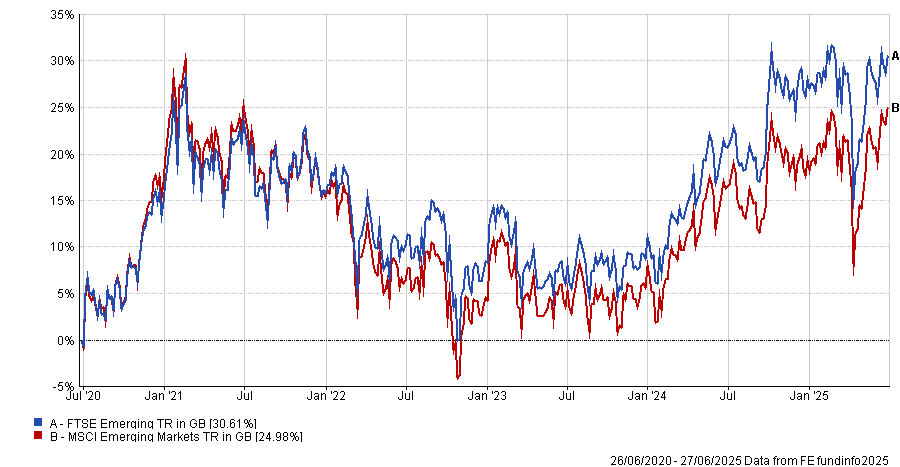
Over the past five years, the FTSE All Share is up 39.4% in price performance terms, underperforming the S&P 500’s 83% rise. However, these indices track the capital value of the stock markets, not the total return they generate, which makes the UK look worse than it is.
When dividends are included, things become a lot different, he said. FE Analytics shows the total return of the FTSE All Share was 66.9%, which is much closer to the S&P 500’s 93%.
“One thing I think people don’t quite appreciate is how big of a component dividends are in your total returns,” Dicorrado said.
Since 2020, the average payout yield on the FTSE All Share has risen to around 6%, outpacing the S&P 500, as demonstrated by the chart below.
Total payout yield of major equity markets since 2020.
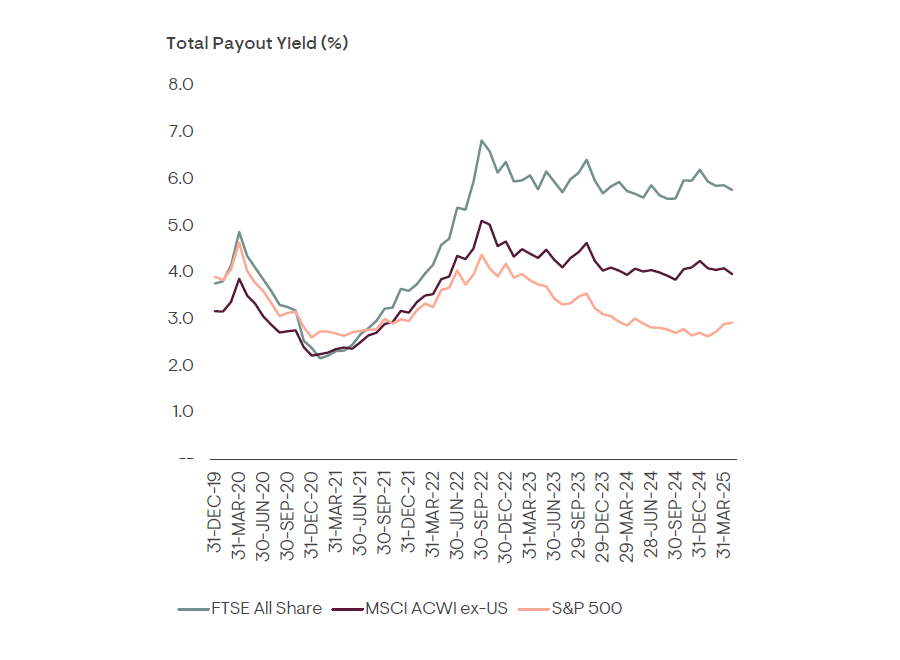
Source: Ninety One
Starting with 6% dividend yield gives UK investors a head start over many other equity markets, he explained. While the FTSE All Share may have grown less impressively than the S&P 500, the high starting yield means UK companies have “far less work to do” to achieve comparable total returns.
“You have to think about buying a stock over the long term. Some of your returns will be from growth, but in the UK, most of it will come from the dividend,” he added.
He is not the only investor to draw attention to this. Recent research from Fidelity International indicated that an investor who put a lump sum of £100 in the FTSE 250 25 years ago would have outperformed someone doing the same in the S&P 500, due to the influence of dividends.
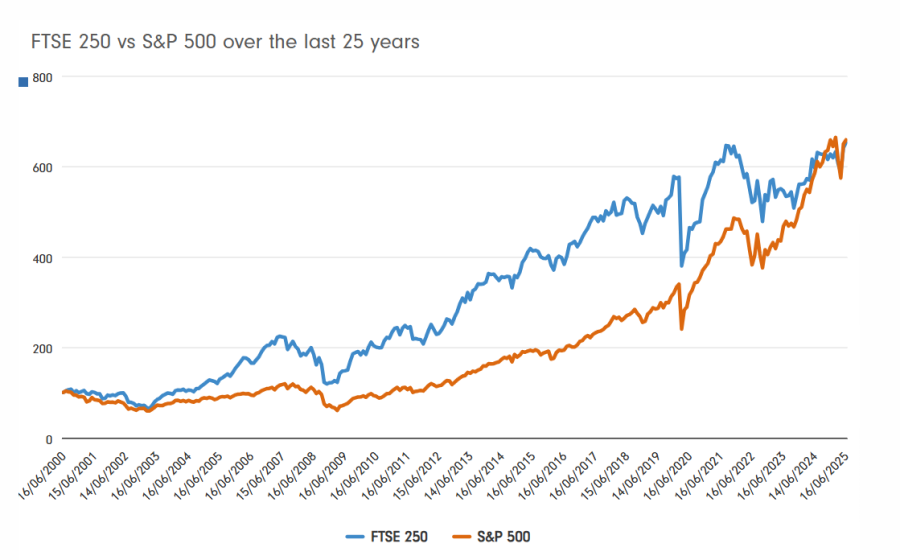
Source: Fidelity International
Dicorrado said: “If the strong, good companies on the market continue to do even just okay, you’ll see it in earnings growth, you'll see it in payouts and you’ll see it in your return.”
This is part of the reason why the UK did not need a revival: the returns are already attractive and, by waiting for international interest, investors are missing out, he argued.
Additionally, interest from global investors would narrow the valuation gap between the UK and its competitors, creating a new set of challenges.
This is because cheap stocks encourage share buybacks, he said. While the UK has always been a high dividend-paying market, historically it was not big on share buybacks and UK businesses used to “waste a lot of money” before the pandemic.
Nowadays, UK businesses are much more careful with capital than they used to be. Instead of sitting on excess capital or buying other companies, more UK businesses are considering buying back their stocks and investing internally, with the buyback yield on the average FTSE All Share company rising to around 2.5% over the past five years.
Share buyback yield of developed markets since 2020
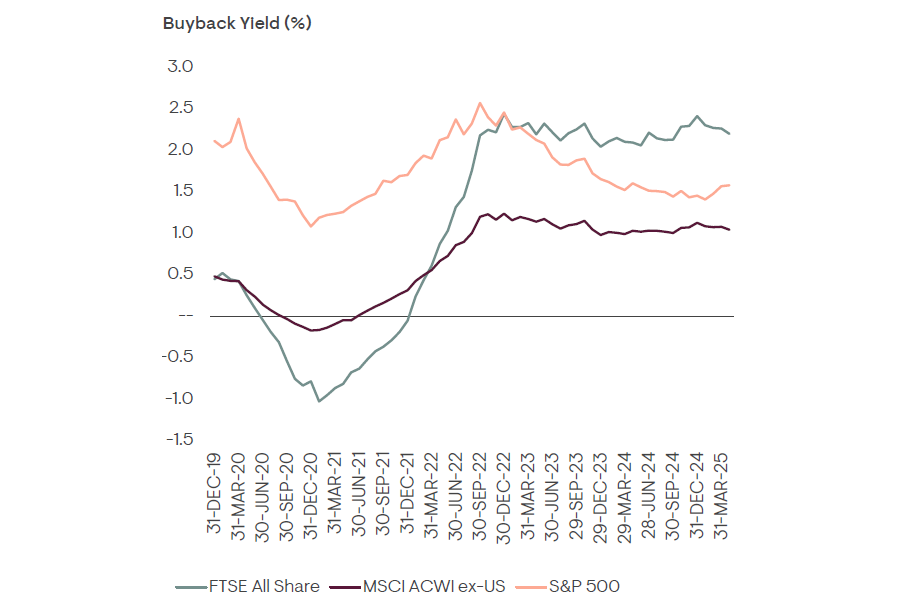
Source: Ninety One
This process of share buybacks is primarily a “function of valuation”, he explained.
“If you buy back stock at a cheap valuation, you're compounding the per-share earnings of whatever investor remains. It’s like the end investor buying more of the stock, except the business is doing it for them.”
Internal investment has also made UK businesses much stronger and tightly run, with the return on investor capital (ROIC) of the FTSE All Share doubling in the past decade.
FTSE All Share ROIC since 2015.
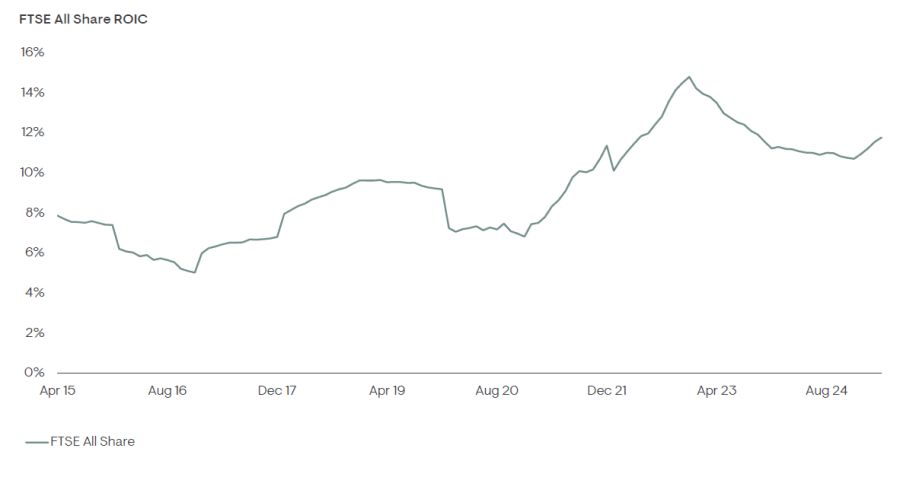
Source: Ninety One.
“We got consumer staples in the UK that are cheaper than consumer staples in the US and we’ve got industrials and capital goods that are cheaper than in Europe.”
If international investors do come back, he explained, these stocks will likely rerate upwards, which would boost returns, but it would also make share buybacks far less compelling.
“We don’t want the market to die, of course, but we want it to remain cheap,” Dicorrado said. “So I don’t think you need that [international interest] to make the call to invest in the UK.”
Performance of fund vs sector and benchmark over past 10yrs
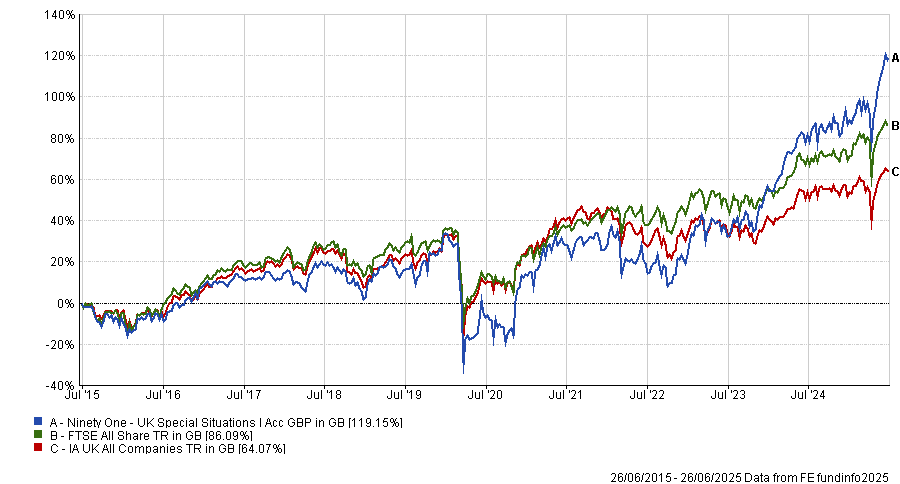
Source: FE Analytics. Total return in pounds sterling
Ninety One UK Special Situations has delivered top-quartile returns in the IA UK All Companies sector over the past one, three, five and 10 years, while outperforming the FTSE All Share over all these periods.
Trustnet finds five global investment trusts with strong risk-adjusted returns year in, year out.
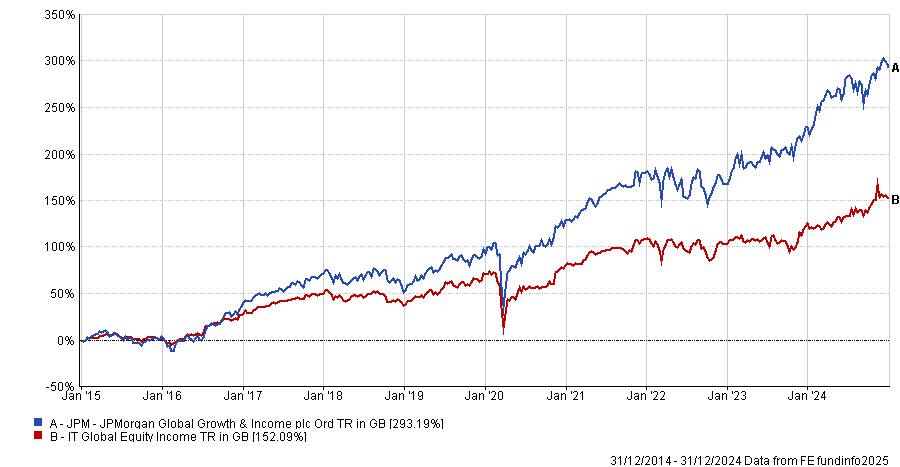
JPMorgan Global Growth & Income and Brunner Investment Trust are some of the global investment trusts with some of the highest Sharpe ratios of their sectors over the past decade, Trustnet research shows.
The Sharpe ratio – which calculates the excess return earned per unit of volatility – can be used by investors to assess whether an investment’s returns are worth the level of risk. A higher Sharpe ratio means an investment has a higher return for each unit of risk.
In this article, Trustnet examines the IT Global, IT Global Equity Income and IT Global Emerging Markets sectors for investment trusts that have made a top-quartile Sharpe ratio in at least five of the full calendar years of the past decade.
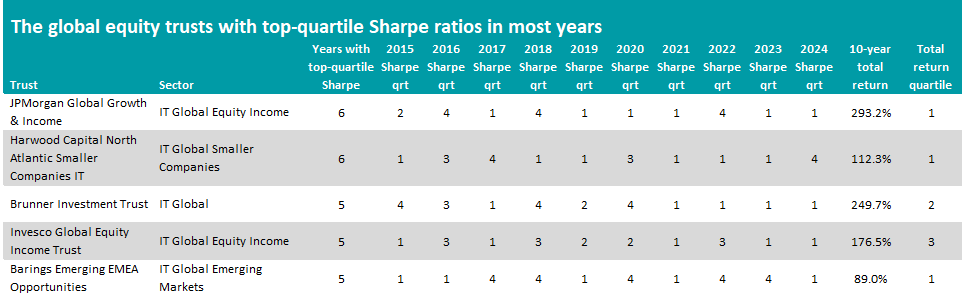
Source: FE Analytics. Total return in sterling between 1 Jan 2015 and 31 Dec 2024.
JPMorgan Global Growth & Income is at the top of the table as it has generated a first-quartile Sharpe ratio in six of the past 10 full calendar years. It also made a 293.2% total return over this time, putting it in the top quartile of the IT Global Equity Income sector.
Managed by Helge Skibeli, Timothy Woodhouse and James Cook, the trust is designed to be a core holding that provides exposure to companies with superior quality of earnings and faster growth, without being expensive.
At present, the portfolio is split between ‘high-growth cyclicals’, such as tech stocks with exposure to the artificial intelligence theme, and ‘low-growth defensives’, which includes overlooked areas such as defensive infrastructure, healthcare and defensive consumer.
Analysts at Kepler said: “In our view, JPMorgan Global Growth & Income’s outperformance of its benchmark, the MSCI ACWI index, in every calendar year since 2019 is particularly impressive, given the varying market environments over this period.
“We think it is worth noting that this outperformance was driven by stock selection rather than sector or country allocation, highlighting the managers’ stock-picking skills.”
Performance of JPMorgan Global Growth & Income vs sector over 10yrs to end of 2024
Source: FE Analytics. Total return in sterling between 1 Jan 2015 and 31 Dec 2024.
JPMorgan Global Growth & Income has absorbed three investment trusts since 2022 and is expected to combine with Henderson International Income Trust in July 2025. The managers and strategy will remain unchanged.
Harwood Capital's North Atlantic Smaller Companies is the only other trust to make a top-quartile Sharpe ratio in six of the past 10 full calendar years. This came with a total return of 112.3% over the decade in question.
It resides in the IT Global Smaller Companies sector but, as its name suggests, invests in businesses based in countries bordering the North Atlantic Ocean.
Manager Christopher Mills can invest in both quoted and unquoted companies, with the sustainability and growth of long-term cash flow being key considerations for any investment.
Last month, Mills said: “The trust has for a number of years maintained substantial cash balances. However, given the collapse in the value of UK equities due to mass redemptions and the panic that is spreading across equity markets courtesy of president Trump, I believe now is the right time to start to deploy our liquidity into companies where we either understand the financial impact of a potential global trade war or where there is little or no impact.
“Obviously, calling a bottom in markets is never easy and we will cautiously deploy our liquid reserves.”
Brunner Investment Trust is in third place with a top-quartile Sharpe ratio in five of the 10 years and a first-quartile total return of 249.7%. Residing in the IT Global sector, it is managed by Allianz’s Christian Schneider.
The trust aims to “thrive in all market conditions” by balancing quality, value and growth when seeking best-in-class businesses. Key to the approach is buying and selling at the right valuations; the management team try to invest before a stock reaches its full potential but sell before it looks overdone.
Kepler said: “Brunner looks well placed to navigate varying market environments, thanks to its strategy of balancing quality, growth and value factors, resulting in a versatile portfolio.
“This adaptability is underpinned by a strong track record, with Brunner being one of the best-performing strategies in the AIC Global sector over the past five years.”
Analysts added that this strong performance is not solely down to the diversification across factors, as stocks added in the past 12 months have been strong contributors and also demonstrate successful stock selection.
Invesco Global Equity Income is the only other trust on the shortlist to make a return of more than 150% over the 10 years examined in this research.
Managers Stephen Anness and Joe Dowling invest in high-quality companies trading at attractive valuations and often buy them following a period of weakness.
They also divide the portfolio into three buckets: companies that can grow their dividend over time, those with low yields but strong growth potential and those with short-term challenges but a chance to restore their dividend.
In a recent update, the managers highlighted how they attempt to build an ‘all-weather’ portfolio, rather than one that bets on specific economic or market outcomes.
“We choose not to second guess these outcomes, rather focusing our time and energy on building a diversified portfolio of high-quality businesses, trading at attractive valuations from the bottom-up,” they said.
“Diversification is key in this market as we can’t rely on one definitive economic outcome. We will continue to work through the economic implications at an individual business level, but with the focus entirely on building a robust portfolio that can perform through different environments.”
JPM US specialist Katie Magee explains why recent trends in US mega caps are unlikely to repeat.
The US has been a hard place to be, but investors should not be too quick in writing the market off entirely – although they might have to look outside of current darlings like tech stocks.
The extreme policy volatility has caused the S&P 500 to fall by as much as 15.3% in dollar terms during April, with some investors beginning to reconsider their allocations in favour of other regions, such as Europe and the UK.
Nevertheless, letting recent volatility distract them from the long-term potential of the US market is a mistake, according to Katie Magee, US equity specialist at JP Morgan Asset Management.
The US can generally rally from a downturn, and while April’s volatility was dramatic, the S&P 500 recovered most of the ‘Liberation Day’ losses within a month, as demonstrated by the chart below.
Performance of the S&P 500 year to date
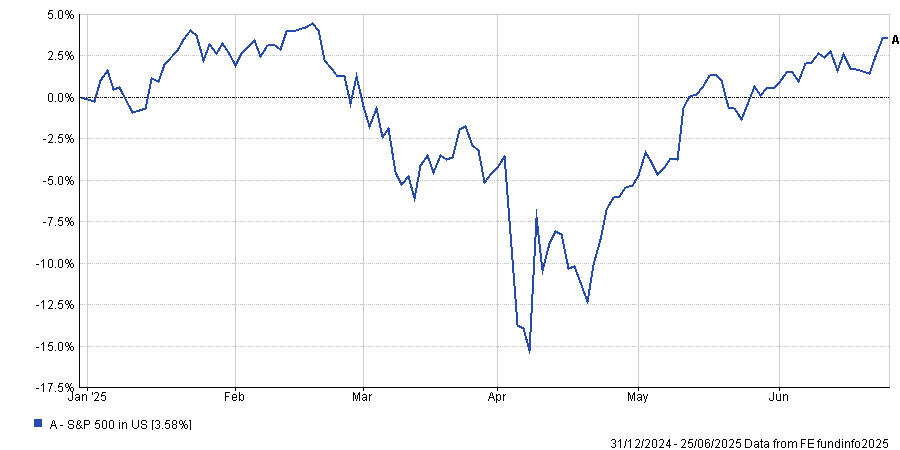
Source: FE Analytics. Data in US dollars.
As analysts from Brewin Dolphin noted earlier this week, underperformance does not mean the US is no longer attractive.
However, recent volatility does mean the opportunity set is changing, according to Magee.
While artificial intelligence (AI) is still a transformational development, AI companies will struggle to generate the returns they used to. This trend is already starting, with four of the ‘Magnificent Seven’ (Apple, Nvidia, Microsoft, Tesla, Meta, Alphabet and Amazon), down so far this year.
Performance of the Magnificent Seven year to date
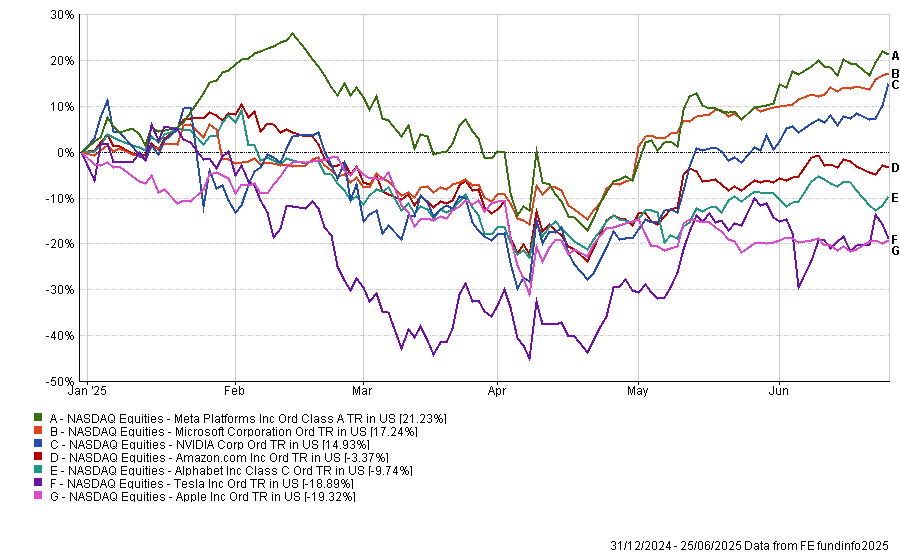
Source: FE Analytics. Data in US dollars
“I don’t think the dynamics we’ve seen over the last couple of years are going to repeat themselves.”
Instead of these handful of mega-cap tech stocks being the main driver of performance, investors should expect the market to broaden out and earnings growth to moderate, she said.
For example, Magee is a strategist on the JPM America Equity and JPM US Select Equity Plus funds, which posted top-quartile returns in the IA North America sector over the past five years due to stock selection across multiple sectors, including technology. However, the funds have struggled to maintain these strong returns this year as market have been volatile, with both sliding into the bottom quartile of the peer group.
Magee explained that as part of their active approach, they have been gradually reducing their tech allocation taking profits from stocks that have performed well, and redistributing this capital to other areas within the portfolio, such as financials.
JPM US Select Equity Plus has US bank Wells Fargo as the ninth largest position and it is performing well. So far this year, Wells Fargo is up 13.8%, a 10-percentage-point outperformance compared to the S&P 500. This follows earnings reports coming in above expectations and the Federal Reserve ending a cap on its assets, which has been in place since 2018.
Performance of stock vs the S&P 500 YTD
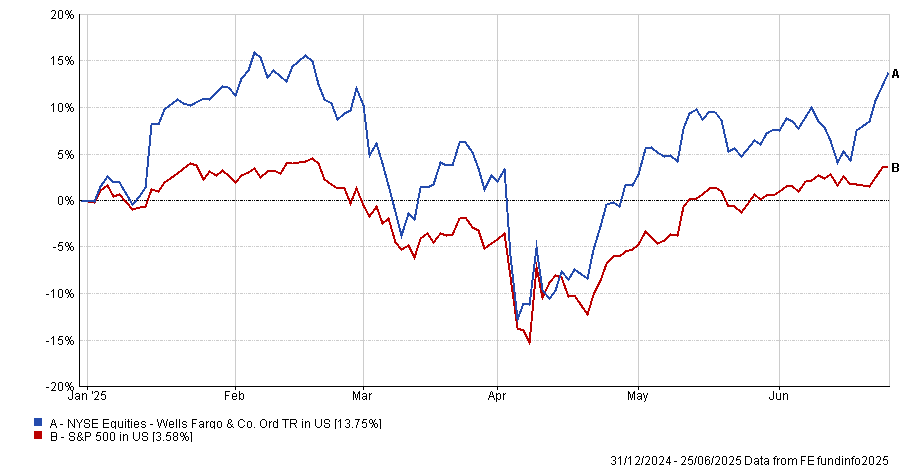
Source: FE Analytics. Data in US dollars
However, banks in general are looking more appealing, Magee said. Larger banks are benefitting from a wave of structural change, including the push for deregulation and an interest rate environment that, while still unclear, looked more broadly supportive.
Elsewhere in financials, “as payments move away from being cash-based,” insurance and digital payment companies looked appealing. MasterCard and Capital One are good examples, which are already in their portfolios and have outperformed the S&P 500 so far this year.
Performance of stocks vs the S&P 500
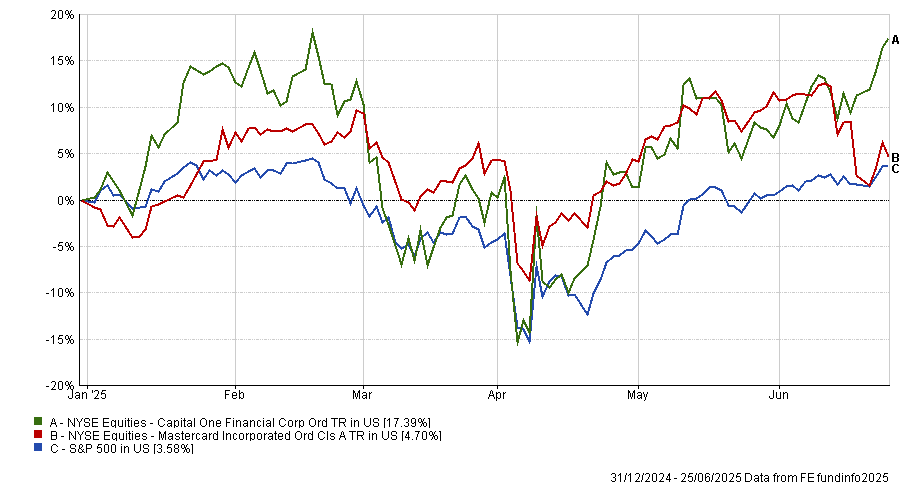
Source: FE Analytics. Data in US dollars
Other recent opportunities that have caught the team's eye include the consumer space, with “off-price retailers and affordable restaurants” standing out.
She argued that these will be “less affected by tariffs” than some other US businesses and consumers have more emphasis on value for money, which is broadly supportive of higher spending.
Additionally, the US consumer was in a strong position and still drove most of the US gross domestic product (GDP), she argued. “We’d seen real wage growth be pretty reasonable for the US, consumer inflation had dropped from its peaks and unemployment rates were low. From our perspective, those themes remain in place,” she concluded.
“It’s not just been mega-cap tech driving performance this year and that’s been good. There are opportunities to be found across the board.”
New fund targets premium yield and long-term growth for income investors.
Aegon Asset Management has launched the UK-domiciled Aegon Global Income fund to invest in a high-conviction portfolio of companies expected to sustainably grow their dividends over time.
Managers Mark Peden, Douglas Scott and Robin Black will mirror the strategy of their $1bn Irish-domiciled Aegon Global Equity Income fund. The UK version aims to provide an income equivalent to 130% of the yield of the MSCI AC World index over a seven-year period.
“The launch of the Aegon Global Income fund is a direct response to client demand for a UK-domiciled version of our successful global equity income strategy,” said Peden.
It will target companies with strong cash flows, stable balance sheets and consistent earnings, capable of growing dividends sustainably, while avoiding areas of the market where high yields are judged to come with significant risks.
“With global dividends reaching record highs for four consecutive years and the dividend universe expanding to include global tech giants and other non-traditional players, we believe this is a golden age for income investing and our disciplined, time-tested process is well-positioned to deliver both premium yield and long-term growth,” said Peden.
ESG factors are also integrated into the investment process.
Trustnet’s Gary Jackson asks if the market has got too used to Donald Trump backing down.
TACO, or Trump Always Chickens Out, is the kind of acronym that markets shouldn’t take seriously but have been in 2025. With the 90-day tariff pause from Liberation Day set to expire on 8 July, the question now might not be whether Trump will make another threat but whether this time he might actually follow through.
Coined by FT columnist Robert Armstrong, TACO has become a shorthand for a trading pattern that’s shaped much of this year: a Trump policy threat sparks fear, markets tumble, the US president pulls back and then markets rebound. The Nasdaq 100 has become the main stage for this drama.
Mobeen Tahir, director of macroeconomic research & tactical solutions at WisdomTree, said: “It describes president Trump’s pattern of making bold policy announcements, like imposing tariffs or threatening the US Federal Reserve, only to retract and soften later. This, of course, has resulted in significant market volatility.
“For investors in the Nasdaq 100, TACO has created a rollercoaster ride. For those inclined to trade tactically around these sharp market fluctuations, there have been plenty of opportunities to take views in either direction.”
The rhythm has been pretty consistent, almost to the point of a policy threat on Monday, a softening on Wednesday and a rally by Friday. Tahir explained that a typical reaction of the Nasdaq 100 to the US administration’s announcements has been “negative in response to the hawkish announcements and positive following the subsequent retreats.”
The Nasdaq and the TACO trade
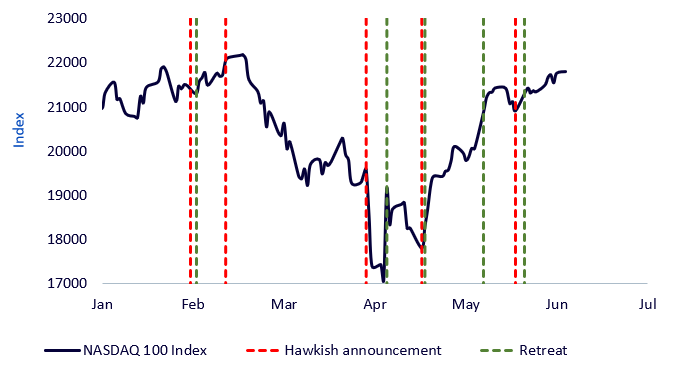
Source: WisdomTree, PBS News, ABC News, Bloomberg, as of 10 Jun 2025
There’s no shortage of examples. In February, Trump signed an executive order slapping tariffs on Mexico, Canada and China. The Nasdaq 100 dropped. Two days later, he paused tariffs on Mexico and Canada. Markets bounced.
In April, he revived reciprocal tariffs – his Liberation Day – and the index sold off again. A week later, a 90-day pause was announced. Cue the rally.
May brought threats against the EU and Apple, and once again, markets whipsawed before those threats were delayed.
US policy announcements and Nasdaq reaction
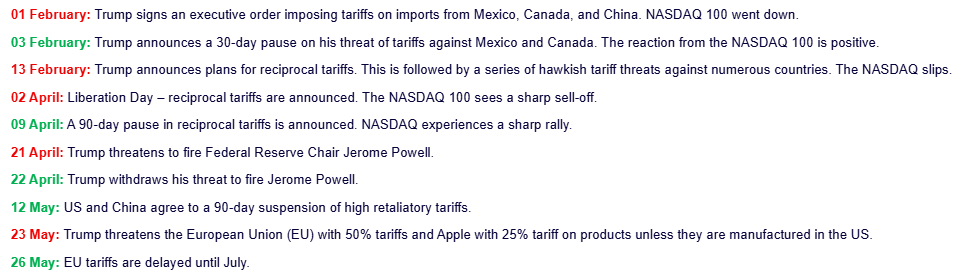
Source: WisdomTree
Of course, it’s worth asking: is this really Trump backing down or was there never a real intention to follow through? Maybe these aren’t policy reversals, but strategic bluffs or strongarm negotiating tactics.
Regardless if it’s chickening out or The Art of the Deal, the market has learned to trade them like clockwork. And that’s where the risk lies.
“One hypothesis is that the TACO trade may be over because markets have become immune to new hawkish announcements from president Trump, knowing they will eventually be reversed or at least dialled down,” Tahir said.
“If markets anticipate this pattern, new tariff threats no longer deliver a shock effect.”
The danger, though, is that this perceived ‘immunity’ is not genuine resilience. Rather, it could just be a new habit. Markets are no longer pricing the threat but a pattern, and if that pattern breaks, the fallout could be significant.
So the question now isn’t whether Trump has bluffed before or backed down, because he has. The question is what happens when he doesn’t. What if one of these threats sticks? What if a 50% tariff on EU goods actually goes into effect?
Or if he acts on his past threat to fire Jerome Powell as Fed chair? What if companies like Apple, already walking a tightrope on global supply chains, face punitive tariffs for failing to move manufacturing back to the US?
Tahir summed it up: “What if president Trump announces a hawkish measure and does not retreat? What if he delivers a surprise that truly catches markets off guard?”
The scenarios might seem outlandish, but they’re just past threats that didn’t materialise. That’s what makes them dangerous: they’ve been seen as noise, not risk.
The Nasdaq 100, in particular, has become the lightning rod for this behaviour. Its high concentration of growth stocks, global revenue exposure and sensitivity to rate expectations make it vulnerable to shocks that challenge the TACO assumption of policy reversals.
None of this means that Trump will follow through next time. He may well continue to use threats as leverage without enacting them. But markets might not be properly hedging the possibility that he won’t. And when everyone’s on the same side of a bet, being wrong is rarely a trivial matter.
The TACO trade has worked because it’s been predictable. But when patterns become too predictable, markets stop preparing for the alternative. If 8 July arrives without a walk-back – if the tariff suspension expires and the bluff turns real – it won’t be just another dip to buy. It will be a lesson in just how fragile those expectations really were.
Gary Jackson is head of editorial at FE fundinfo. The views expressed above should not be taken as investment advice.
Chelsea’s Darius McDermott selects a defensive portfolio for uncertain times.
Excitement has its place in investing but perhaps not when markets are as unpredictable as they are today. With wars ongoing, chaotic tariff policies and artificial intelligence (AI) upending industries, many investors are ditching risk in favour of reliability.
“Appetite is growing for boring, predictable funds that can weather the storm,” said Darius McDermott, managing director at Chelsea Financial Services. “They are not built to shoot the lights out – their goal is to deliver consistent, incremental returns.”
For defensive investors and for those that have an investment horizon of five years or less, McDermott believes a carefully constructed, lower-volatility portfolio is the answer. Below, he put one together that can serve as an example, focusing on multi-asset, absolute return and fixed income strategies designed to smooth the ride through market turmoil.
His first port of call was multi-asset funds that “bring genuine diversification”, such as BNY Mellon Multi-Asset Income and VT Momentum Diversified Income – a split of the two should make up 40% of the portfolio.
Performance of fund against index and sector over 1yr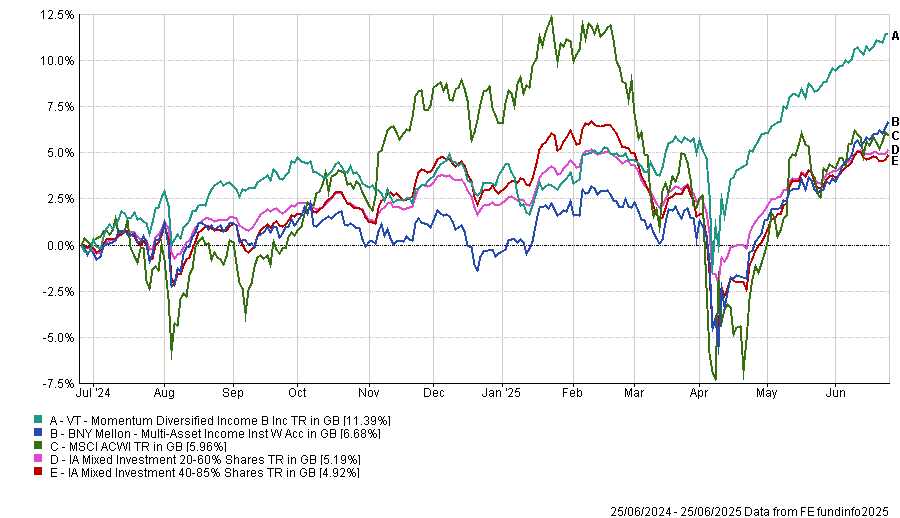
Source: FE Analytics
The BNY Mellon strategy draws on Newton’s global research to deliver “a stable and growing income” alongside long-term capital growth.
The managing team (with Paul Flood as lead manager and Bhavin Shah as deputy) invests without any benchmark restrictions and are rated by RSMR and Square Mile analysts.
McDermott highlighted the fund’s strong performance record since its launch in 2015 – to today, the fund has outperformed the IA Mixed Investment 40-85% Shares sector average by 24 percentage points.
VT Momentum Diversified Income is also a “well-diversified” global fund focussing on income though a “common-sense approach that has helped it deliver better returns and lower volatility relative to peers”, according to the fund picker.
Next up was absolute return, which was given 15% of the overall allocation. Here, the choice was SVS RM Defensive Capital, an all-weather strategy with a focus on lower volatility and minimising downside risk.
Performance of fund against index and sector over 1yr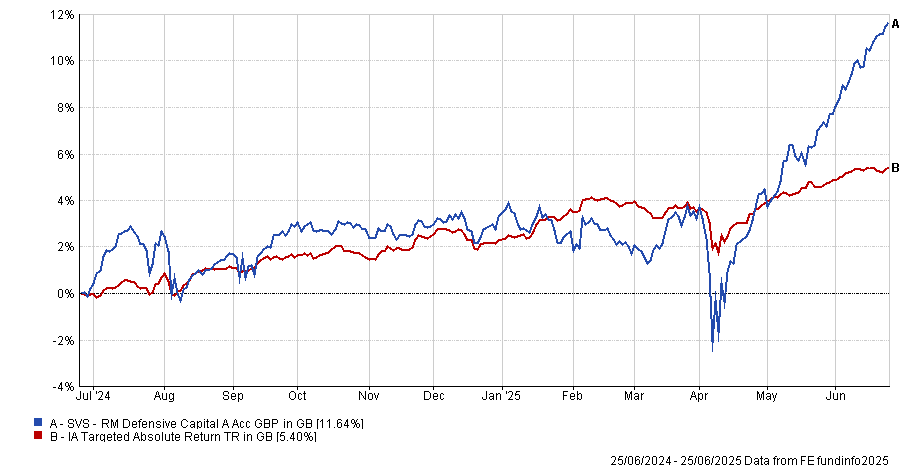
Source: FE Analytics
Managed by Niall O’Connor, the portfolio combines bonds, equities and commodities and tends to have a value bias by avoiding expensive areas of the market, which makes it “another dull but more predictable option,” according to McDermott.
The rest of the portfolio was dedicated to fixed income, with the managing director first including a corporate-bond fund, BlackRock Corporate Bond, which should make up 15% of the overall portfolio.
He praised its flexibility and “proven ability to exploit inefficiencies in fixed income”.
Since Ben Edwards has been in charge from 2015, the strategy has delivered “excellent returns”, with its 30% upside over the past 10 years putting it in the first quartile of performance against the IA Sterling Corporate Bond average of 27.5% – all the while taking “significantly less risk than the rest of the sector”, McDermott noted.
This result hasn’t been achieved over more recent times frames, however, with the vehicle dropping to the third quartile of performance over the past five and three years, and to the last over the past 12 months, as shown in the chart below.
Performance of fund against index and sector over 1yr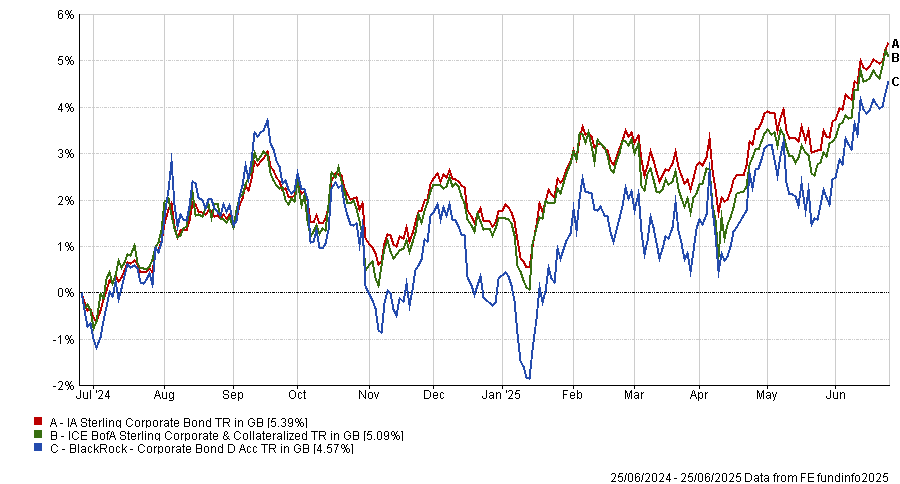
Source: FE Analytics
To continue in the same area, TwentyFour Corporate Bond also deserved a place and another 15% of the budget.
For McDermott, manager Chris Bowie has built “one of the most dependable funds in the space”, aiming to deliver high income with minimal volatility. It is currently in the IA Sterling Corporate Bond's first or second quartile over one, three, five and 10 years, making a top-quartile 31% total return over the past decade.
Square Mile analysts appreciate its approach of mixing “a healthy degree of interest rate risk, which could prove to be an attractive diversifier in a balanced portfolio, as well as exposing investors to credit risk and the extra returns above government bonds which this should generate over time”.
Performance of fund against index and sector over 1yr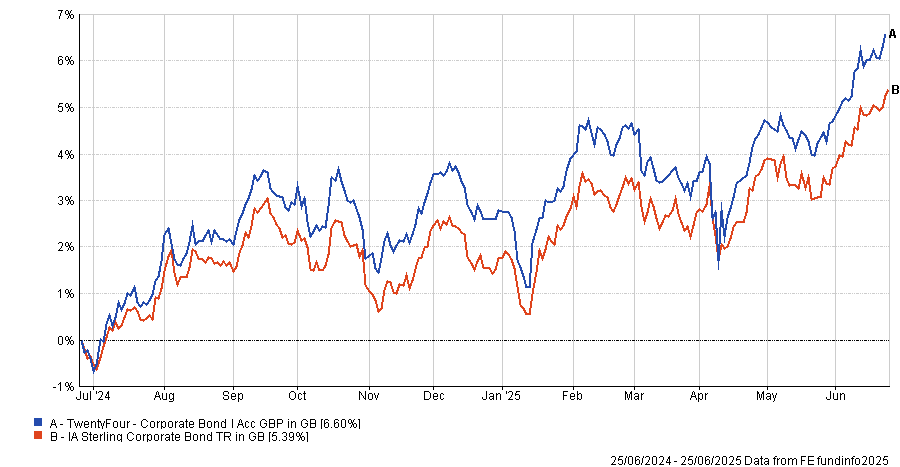
Source: FE Analytics
Finally, while it carries slightly more risk, GAM Star Credit Opportunities was McDermott’s last pick, which offers “an attractive option for income seekers” and accounts for the final 15% the portfolio.
“By focusing on the strongest companies further down the capital structure, the fund generates a high yield while maintaining quality,” he said.
It is co-run by FE fundinfo Alpha Manager Anthony Smouha, who follows the philosophy that investment-grade companies rarely default and by extension their higher-yielding junior debt rarely defaults.
Performance of fund against index and sector over 1yr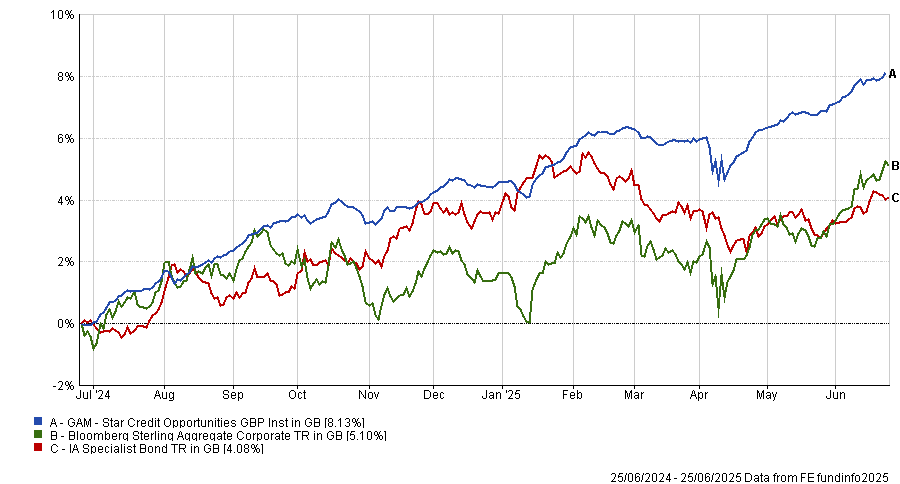
Source: FE Analytics
The fund has a strong bias towards financials such as banks and insurers. For RSMR analysts, its low sensitivity to changing interest rates is compelling.
They said: “The simple approach of investing in quality companies via junior credit and using the capital structure to derive higher returns has been a cornerstone of the investment approach for a long time and has led to attractive returns for investors willing to tolerate some volatility at times of market stress.”
Despite the slightly higher volatility, the fund achieved a first-quartile performance against its IA Specialist Bond peers across all main timeframes.

Source: FE Analytics
The information contained within this website is provided by Allfunds Digital, S.L.U. acting through its business division Digital Look Ltd unless otherwise stated. The information is not intended to be advice or a recommendation to buy, sell or hold any of the shares, companies or investment vehicles mentioned, nor is it information meant to be a research recommendation. This is a solution powered by Allfunds Digital, S.L.U. acting through its business division Digital Look Ltd incorporating their prices, data news, charts, fundamentals and investor tools on this site. Terms and conditions apply. Prices and trades are provided by Allfunds Digital, S.L.U. acting through its business division Digital Look Ltd and are delayed by at least 15 minutes.
© 2025 Refinitiv, an LSEG business. All rights reserved.
 Please wait...
Barclays Investment Solutions Limited provides wealth and investment products and services (including the Smart Investor investment services) and is authorised and regulated by the Financial Conduct Authority and is a member of the London Stock Exchange and NEX. Registered in England. Registered No. 2752982. Registered Office: 1 Churchill Place, London E14 5HP.
Barclays Bank UK PLC provides banking services to its customers and is authorised by the Prudential Regulation Authority and regulated by the Financial Conduct Authority and the Prudential Regulation Authority (Financial Services Register No. 759676). Registered in England. Registered No. 9740322. Registered Office: 1 Churchill Place, London E14 5HP.