JPM US specialist Katie Magee explains why recent trends in US mega caps are unlikely to repeat.
The US has been a hard place to be, but investors should not be too quick in writing the market off entirely – although they might have to look outside of current darlings like tech stocks.
The extreme policy volatility has caused the S&P 500 to fall by as much as 15.3% in dollar terms during April, with some investors beginning to reconsider their allocations in favour of other regions, such as Europe and the UK.
Nevertheless, letting recent volatility distract them from the long-term potential of the US market is a mistake, according to Katie Magee, US equity specialist at JP Morgan Asset Management.
The US can generally rally from a downturn, and while April’s volatility was dramatic, the S&P 500 recovered most of the ‘Liberation Day’ losses within a month, as demonstrated by the chart below.
Performance of the S&P 500 year to date
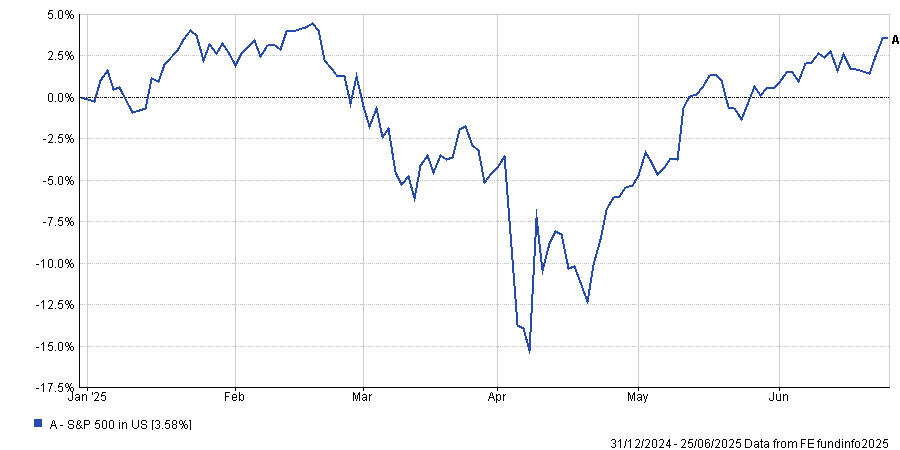
Source: FE Analytics. Data in US dollars.
As analysts from Brewin Dolphin noted earlier this week, underperformance does not mean the US is no longer attractive.
However, recent volatility does mean the opportunity set is changing, according to Magee.
While artificial intelligence (AI) is still a transformational development, AI companies will struggle to generate the returns they used to. This trend is already starting, with four of the ‘Magnificent Seven’ (Apple, Nvidia, Microsoft, Tesla, Meta, Alphabet and Amazon), down so far this year.
Performance of the Magnificent Seven year to date
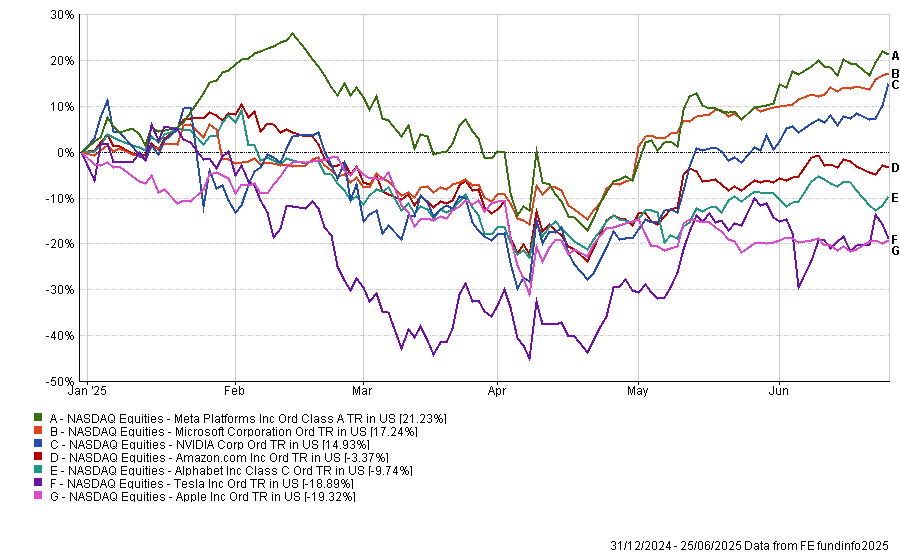
Source: FE Analytics. Data in US dollars
“I don’t think the dynamics we’ve seen over the last couple of years are going to repeat themselves.”
Instead of these handful of mega-cap tech stocks being the main driver of performance, investors should expect the market to broaden out and earnings growth to moderate, she said.
For example, Magee is a strategist on the JPM America Equity and JPM US Select Equity Plus funds, which posted top-quartile returns in the IA North America sector over the past five years due to stock selection across multiple sectors, including technology. However, the funds have struggled to maintain these strong returns this year as market have been volatile, with both sliding into the bottom quartile of the peer group.
Magee explained that as part of their active approach, they have been gradually reducing their tech allocation taking profits from stocks that have performed well, and redistributing this capital to other areas within the portfolio, such as financials.
JPM US Select Equity Plus has US bank Wells Fargo as the ninth largest position and it is performing well. So far this year, Wells Fargo is up 13.8%, a 10-percentage-point outperformance compared to the S&P 500. This follows earnings reports coming in above expectations and the Federal Reserve ending a cap on its assets, which has been in place since 2018.
Performance of stock vs the S&P 500 YTD
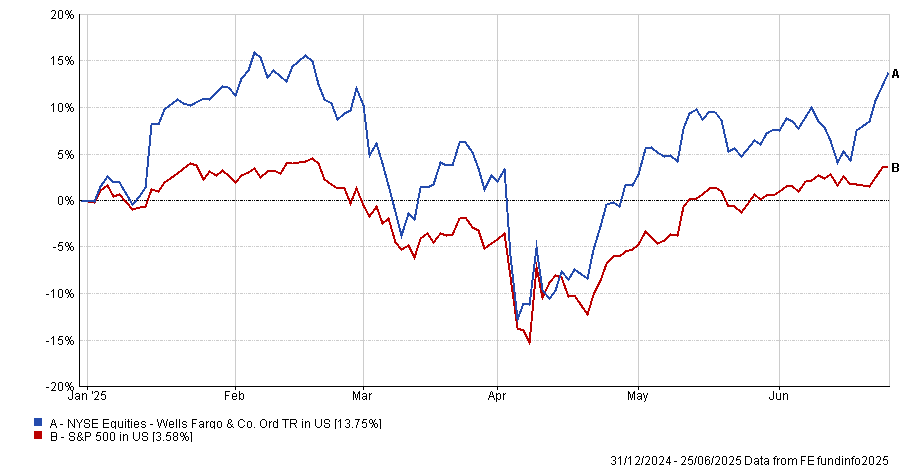
Source: FE Analytics. Data in US dollars
However, banks in general are looking more appealing, Magee said. Larger banks are benefitting from a wave of structural change, including the push for deregulation and an interest rate environment that, while still unclear, looked more broadly supportive.
Elsewhere in financials, “as payments move away from being cash-based,” insurance and digital payment companies looked appealing. MasterCard and Capital One are good examples, which are already in their portfolios and have outperformed the S&P 500 so far this year.
Performance of stocks vs the S&P 500
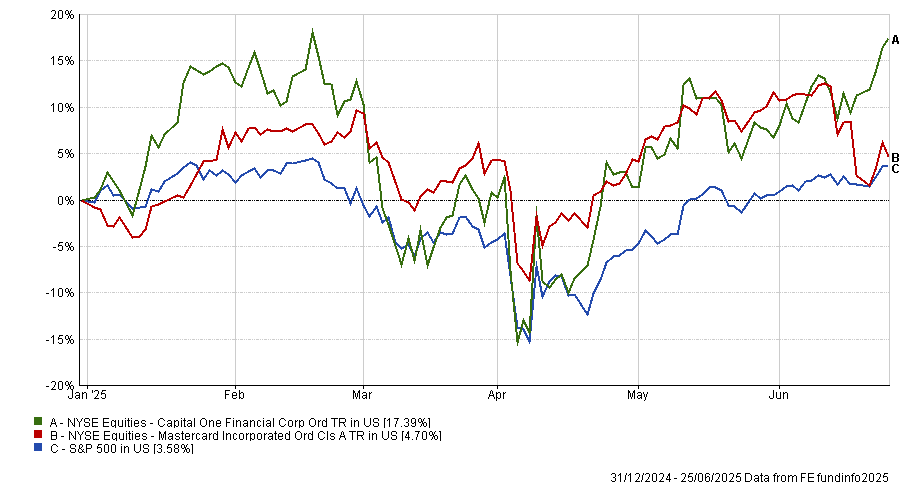
Source: FE Analytics. Data in US dollars
Other recent opportunities that have caught the team's eye include the consumer space, with “off-price retailers and affordable restaurants” standing out.
She argued that these will be “less affected by tariffs” than some other US businesses and consumers have more emphasis on value for money, which is broadly supportive of higher spending.
Additionally, the US consumer was in a strong position and still drove most of the US gross domestic product (GDP), she argued. “We’d seen real wage growth be pretty reasonable for the US, consumer inflation had dropped from its peaks and unemployment rates were low. From our perspective, those themes remain in place,” she concluded.
“It’s not just been mega-cap tech driving performance this year and that’s been good. There are opportunities to be found across the board.”
New fund targets premium yield and long-term growth for income investors.
Aegon Asset Management has launched the UK-domiciled Aegon Global Income fund to invest in a high-conviction portfolio of companies expected to sustainably grow their dividends over time.
Managers Mark Peden, Douglas Scott and Robin Black will mirror the strategy of their $1bn Irish-domiciled Aegon Global Equity Income fund. The UK version aims to provide an income equivalent to 130% of the yield of the MSCI AC World index over a seven-year period.
“The launch of the Aegon Global Income fund is a direct response to client demand for a UK-domiciled version of our successful global equity income strategy,” said Peden.
It will target companies with strong cash flows, stable balance sheets and consistent earnings, capable of growing dividends sustainably, while avoiding areas of the market where high yields are judged to come with significant risks.
“With global dividends reaching record highs for four consecutive years and the dividend universe expanding to include global tech giants and other non-traditional players, we believe this is a golden age for income investing and our disciplined, time-tested process is well-positioned to deliver both premium yield and long-term growth,” said Peden.
ESG factors are also integrated into the investment process.
Trustnet’s Gary Jackson asks if the market has got too used to Donald Trump backing down.
TACO, or Trump Always Chickens Out, is the kind of acronym that markets shouldn’t take seriously but have been in 2025. With the 90-day tariff pause from Liberation Day set to expire on 8 July, the question now might not be whether Trump will make another threat but whether this time he might actually follow through.
Coined by FT columnist Robert Armstrong, TACO has become a shorthand for a trading pattern that’s shaped much of this year: a Trump policy threat sparks fear, markets tumble, the US president pulls back and then markets rebound. The Nasdaq 100 has become the main stage for this drama.
Mobeen Tahir, director of macroeconomic research & tactical solutions at WisdomTree, said: “It describes president Trump’s pattern of making bold policy announcements, like imposing tariffs or threatening the US Federal Reserve, only to retract and soften later. This, of course, has resulted in significant market volatility.
“For investors in the Nasdaq 100, TACO has created a rollercoaster ride. For those inclined to trade tactically around these sharp market fluctuations, there have been plenty of opportunities to take views in either direction.”
The rhythm has been pretty consistent, almost to the point of a policy threat on Monday, a softening on Wednesday and a rally by Friday. Tahir explained that a typical reaction of the Nasdaq 100 to the US administration’s announcements has been “negative in response to the hawkish announcements and positive following the subsequent retreats.”
The Nasdaq and the TACO trade
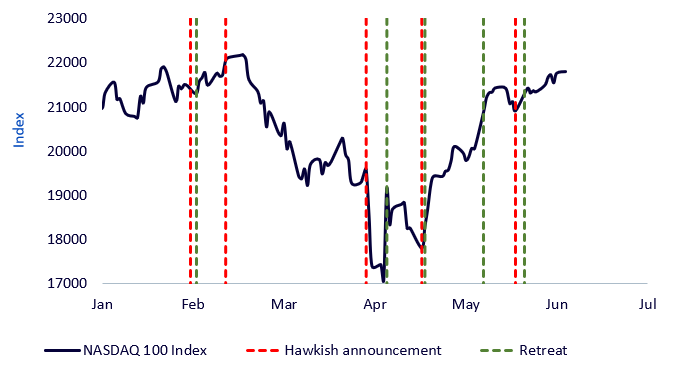
Source: WisdomTree, PBS News, ABC News, Bloomberg, as of 10 Jun 2025
There’s no shortage of examples. In February, Trump signed an executive order slapping tariffs on Mexico, Canada and China. The Nasdaq 100 dropped. Two days later, he paused tariffs on Mexico and Canada. Markets bounced.
In April, he revived reciprocal tariffs – his Liberation Day – and the index sold off again. A week later, a 90-day pause was announced. Cue the rally.
May brought threats against the EU and Apple, and once again, markets whipsawed before those threats were delayed.
US policy announcements and Nasdaq reaction
Source: WisdomTree
Of course, it’s worth asking: is this really Trump backing down or was there never a real intention to follow through? Maybe these aren’t policy reversals, but strategic bluffs or strongarm negotiating tactics.
Regardless if it’s chickening out or The Art of the Deal, the market has learned to trade them like clockwork. And that’s where the risk lies.
“One hypothesis is that the TACO trade may be over because markets have become immune to new hawkish announcements from president Trump, knowing they will eventually be reversed or at least dialled down,” Tahir said.
“If markets anticipate this pattern, new tariff threats no longer deliver a shock effect.”
The danger, though, is that this perceived ‘immunity’ is not genuine resilience. Rather, it could just be a new habit. Markets are no longer pricing the threat but a pattern, and if that pattern breaks, the fallout could be significant.
So the question now isn’t whether Trump has bluffed before or backed down, because he has. The question is what happens when he doesn’t. What if one of these threats sticks? What if a 50% tariff on EU goods actually goes into effect?
Or if he acts on his past threat to fire Jerome Powell as Fed chair? What if companies like Apple, already walking a tightrope on global supply chains, face punitive tariffs for failing to move manufacturing back to the US?
Tahir summed it up: “What if president Trump announces a hawkish measure and does not retreat? What if he delivers a surprise that truly catches markets off guard?”
The scenarios might seem outlandish, but they’re just past threats that didn’t materialise. That’s what makes them dangerous: they’ve been seen as noise, not risk.
The Nasdaq 100, in particular, has become the lightning rod for this behaviour. Its high concentration of growth stocks, global revenue exposure and sensitivity to rate expectations make it vulnerable to shocks that challenge the TACO assumption of policy reversals.
None of this means that Trump will follow through next time. He may well continue to use threats as leverage without enacting them. But markets might not be properly hedging the possibility that he won’t. And when everyone’s on the same side of a bet, being wrong is rarely a trivial matter.
The TACO trade has worked because it’s been predictable. But when patterns become too predictable, markets stop preparing for the alternative. If 8 July arrives without a walk-back – if the tariff suspension expires and the bluff turns real – it won’t be just another dip to buy. It will be a lesson in just how fragile those expectations really were.
Gary Jackson is head of editorial at FE fundinfo. The views expressed above should not be taken as investment advice.
Chelsea’s Darius McDermott selects a defensive portfolio for uncertain times.
Excitement has its place in investing but perhaps not when markets are as unpredictable as they are today. With wars ongoing, chaotic tariff policies and artificial intelligence (AI) upending industries, many investors are ditching risk in favour of reliability.
“Appetite is growing for boring, predictable funds that can weather the storm,” said Darius McDermott, managing director at Chelsea Financial Services. “They are not built to shoot the lights out – their goal is to deliver consistent, incremental returns.”
For defensive investors and for those that have an investment horizon of five years or less, McDermott believes a carefully constructed, lower-volatility portfolio is the answer. Below, he put one together that can serve as an example, focusing on multi-asset, absolute return and fixed income strategies designed to smooth the ride through market turmoil.
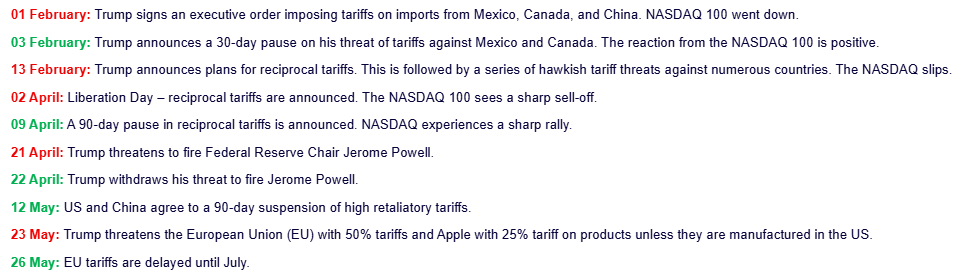
His first port of call was multi-asset funds that “bring genuine diversification”, such as BNY Mellon Multi-Asset Income and VT Momentum Diversified Income – a split of the two should make up 40% of the portfolio.
Performance of fund against index and sector over 1yr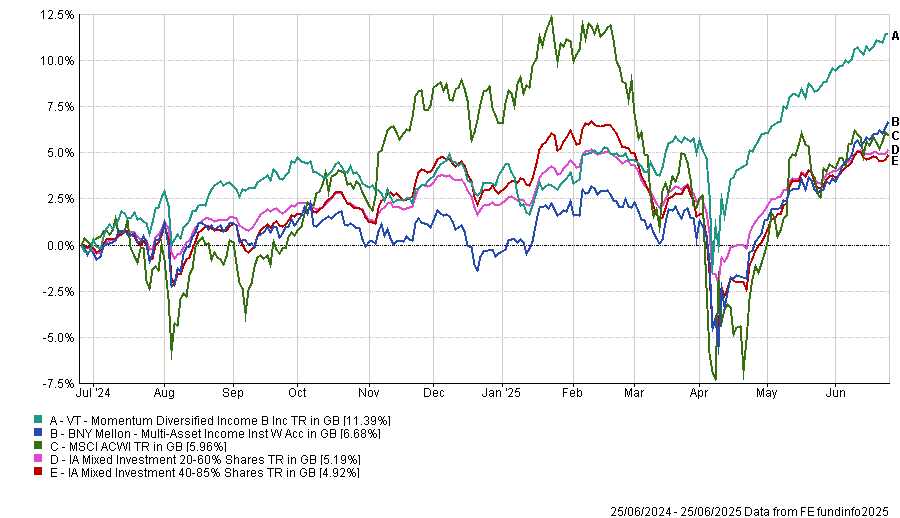
Source: FE Analytics
The BNY Mellon strategy draws on Newton’s global research to deliver “a stable and growing income” alongside long-term capital growth.
The managing team (with Paul Flood as lead manager and Bhavin Shah as deputy) invests without any benchmark restrictions and are rated by RSMR and Square Mile analysts.
McDermott highlighted the fund’s strong performance record since its launch in 2015 – to today, the fund has outperformed the IA Mixed Investment 40-85% Shares sector average by 24 percentage points.
VT Momentum Diversified Income is also a “well-diversified” global fund focussing on income though a “common-sense approach that has helped it deliver better returns and lower volatility relative to peers”, according to the fund picker.
Next up was absolute return, which was given 15% of the overall allocation. Here, the choice was SVS RM Defensive Capital, an all-weather strategy with a focus on lower volatility and minimising downside risk.
Performance of fund against index and sector over 1yr
Source: FE Analytics
Managed by Niall O’Connor, the portfolio combines bonds, equities and commodities and tends to have a value bias by avoiding expensive areas of the market, which makes it “another dull but more predictable option,” according to McDermott.
The rest of the portfolio was dedicated to fixed income, with the managing director first including a corporate-bond fund, BlackRock Corporate Bond, which should make up 15% of the overall portfolio.
He praised its flexibility and “proven ability to exploit inefficiencies in fixed income”.
Since Ben Edwards has been in charge from 2015, the strategy has delivered “excellent returns”, with its 30% upside over the past 10 years putting it in the first quartile of performance against the IA Sterling Corporate Bond average of 27.5% – all the while taking “significantly less risk than the rest of the sector”, McDermott noted.
This result hasn’t been achieved over more recent times frames, however, with the vehicle dropping to the third quartile of performance over the past five and three years, and to the last over the past 12 months, as shown in the chart below.
Performance of fund against index and sector over 1yr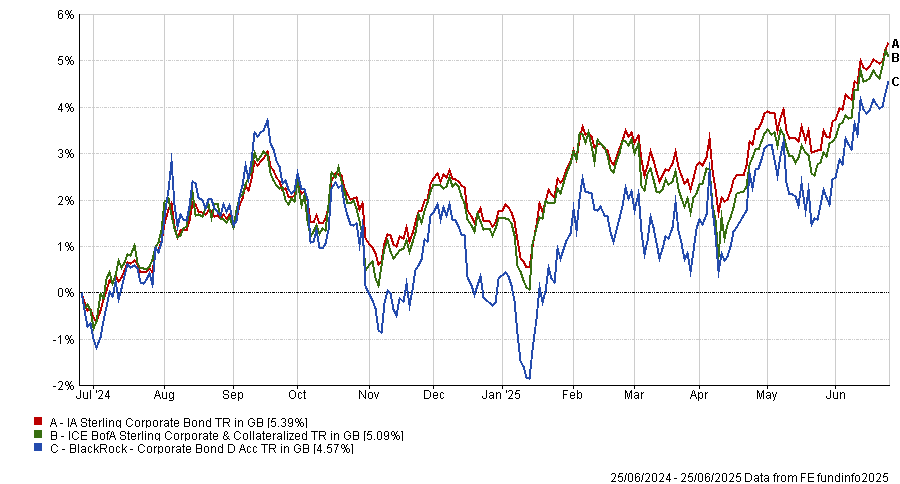
Source: FE Analytics
To continue in the same area, TwentyFour Corporate Bond also deserved a place and another 15% of the budget.
For McDermott, manager Chris Bowie has built “one of the most dependable funds in the space”, aiming to deliver high income with minimal volatility. It is currently in the IA Sterling Corporate Bond's first or second quartile over one, three, five and 10 years, making a top-quartile 31% total return over the past decade.
Square Mile analysts appreciate its approach of mixing “a healthy degree of interest rate risk, which could prove to be an attractive diversifier in a balanced portfolio, as well as exposing investors to credit risk and the extra returns above government bonds which this should generate over time”.
Performance of fund against index and sector over 1yr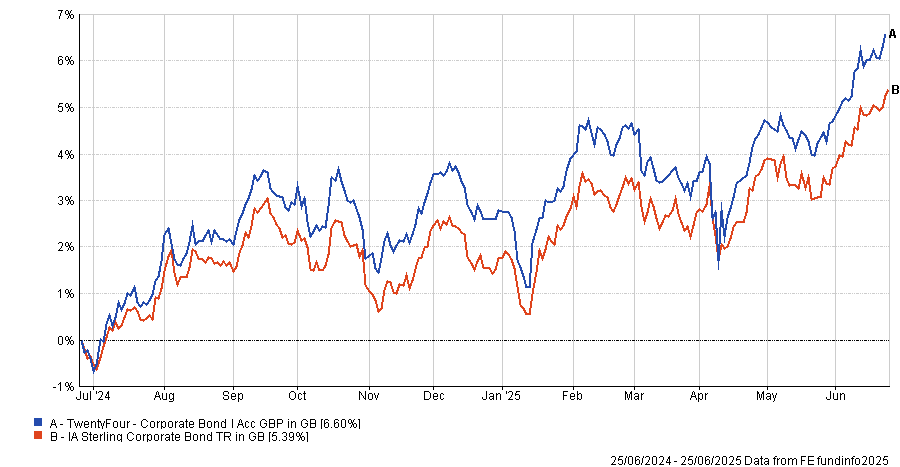
Source: FE Analytics
Finally, while it carries slightly more risk, GAM Star Credit Opportunities was McDermott’s last pick, which offers “an attractive option for income seekers” and accounts for the final 15% the portfolio.
“By focusing on the strongest companies further down the capital structure, the fund generates a high yield while maintaining quality,” he said.
It is co-run by FE fundinfo Alpha Manager Anthony Smouha, who follows the philosophy that investment-grade companies rarely default and by extension their higher-yielding junior debt rarely defaults.
Performance of fund against index and sector over 1yr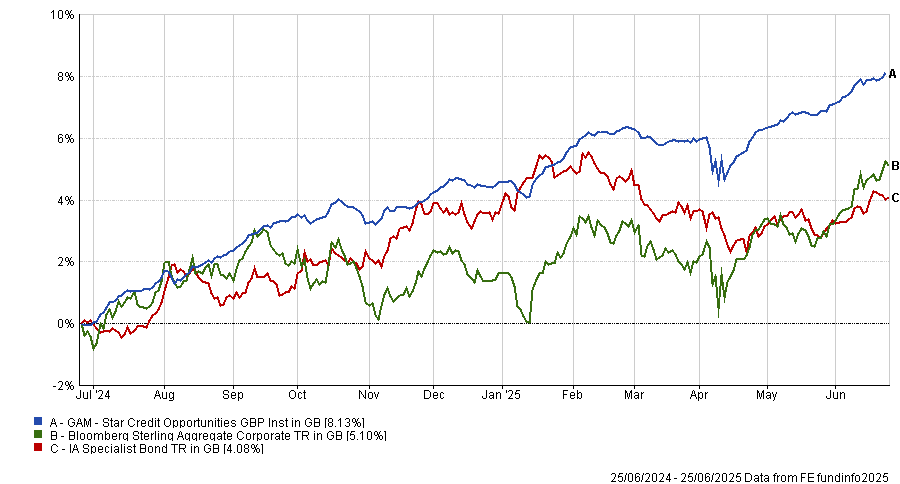
Source: FE Analytics
The fund has a strong bias towards financials such as banks and insurers. For RSMR analysts, its low sensitivity to changing interest rates is compelling.
They said: “The simple approach of investing in quality companies via junior credit and using the capital structure to derive higher returns has been a cornerstone of the investment approach for a long time and has led to attractive returns for investors willing to tolerate some volatility at times of market stress.”
Despite the slightly higher volatility, the fund achieved a first-quartile performance against its IA Specialist Bond peers across all main timeframes.

Source: FE Analytics
AJ Bell’s James Flintoft assess both the opportunities and the risks of investing in China.
A decade ago, China launched an industrial strategy to upgrade to a high-tech industrial base called ‘Made in China 2025.’ Little did they know it would be finalised in a year when their main economic rival would attempt to definitively pivot towards protectionism.
It could be that the authorities anticipated the struggles they would experience in shifting economic growth from a reliance on the property sector and the uncomfortable comparisons that would bring with Japan’s lost decades.
For equity investors, the reforms to the property sector have had a profound impact, compounded by the first trade war and a crackdown on the freedom of technology companies.
The main Chinese equity indices are lower over the past five years to the end of May. Onshore/offshore, A, B and H share indices have at times lost more than 40% of their value in sterling terms, and some over 55%.
Amid so much negative sentiment in early 2024, index valuations, as measured by the forward P/E, dropped to 20-30% of their post-global financial crisis (GFC) averages¹.
In the second half of the year, government initiatives unleashed an almighty rebound, with some indices rising over 30% in a matter of days. Expectations of earnings upgrades compounded upon the low starting valuation. The rally cooled as the year end approached, however 2025 has seen a similarly dramatic performance, albeit this time with differentiation.
January’s release of the DeepSeek R1 AI model was a defining moment, challenging the prevailing wisdom that US companies would dominate in AI. This set in motion another ferocious rise in large cap H shares.
In times of divergence in markets, strategic asset allocation decisions, such as benchmark selection, can show up in unexpected ways for those unaware of the nuances.
Any equity region has several indices available. At its most obvious, this can be the intended coverage of the index in terms of region, think pan-European versus Europe ex-UK. However, the difference often lies within the index provider methodology, where free-float adjustment, inclusion criteria and country classification can have an impact on the profile of the index.
China and the wider region have important and often ignored issues here. The broadest definition of China (Greater China) includes Hong Kong and Taiwan. Over the past three years it has paid to invest in the MSCI Greater China index, or strategies that manage around it, because it has a large allocation to TSMC and hence rode the dominant tech/AI theme in wider markets.
If on the other hand you specifically targeted A shares, you missed out on this trend and the 2025 H share rally too.
The MSCI Greater China index meanwhile has had the H share gains this year eroded by exposure to the wider tech sector, namely TSMC and its close association with the US AI champions.
That is where slightly broader China indices come in handy, such as MSCI China. This index does not include Hong Kong and Taiwan, but does target an A share component, alongside H shares, P chips and Red chips. A shares are capped by index inclusion criteria and inclusion ratios.
Failing to assess the underlying positions of a passive or active holding with respect to these differences may have seen a few investors surprised with how their portfolios have performed this year.
Turning to where we stand today, there has been a re-rating, meaning valuations across China equity indices sit much closer to the post-GFC averages. In other words, the easy money has been made, especially when you consider the relative performance to US equities.
China is still on the cheap end of the spectrum when looking across other regions. The shift in narrative around AI and the benefits of Made in China 2025, which now means manufacturing in China is not all about cost, could be felt for some time.
Of course, other factors explain some of the valuation discount. The elephant in the room is Taiwan. Most are aware of the invasion risk, but it is unpredictable.
There are different approaches to these types of risk. Perma-bears can be very well appraised of the minutiae of risks but can frustratingly miss out on opportunities whilst holding the intellectual high ground. Others, meanwhile, may continue investing without fully appreciating their exposure, until it matters.
We prefer a more nuanced approach: recognising both the opportunities in China and the risks that may require careful management. That’s why in 2025 we moved our asset allocation to an Emerging Markets ex-China model, with dedicated allocations to China that allow quick and efficient changes to exposure should we need it.
For many this was a pressing issue when China accounted for over 40% of the MSCI Emerging Market index back in 2020, but it remains an obvious risk management improvement that allocators can make to their processes.
¹Between 01/01/2010 and 31/12/2023.
James Flintoft is head of investment solutions at AJ Bell. The views expressed above should not be taken as investment advice.
More trusts are moving above NAV as investors reward income, reliability and unique holdings.
More investment trusts are trading above their net asset value (NAV) this year compared to 2024, as investors grow more willing to pay extra for dependable income, a proven track record or access to rare opportunities.
According to data from AJ Bell and the Association of Investment Companies (AIC), 24 investment trusts now trade at a premium, compared with 19 this time last year – still a far cry from the 88 premium-rated trusts in 2015, but a noticeable shift in sentiment after years of discount dominance.
For Dan Coatsworth, investment analyst at AJ Bell, investors are showing greater willingness to pay up for certain strategies.
He said: “Trusts currently commanding a premium rating are ones that either specialise in income, have a track record of beating the market or provide access to unique, unusual or scarce assets.”
Investment trusts trading on a premium to NAV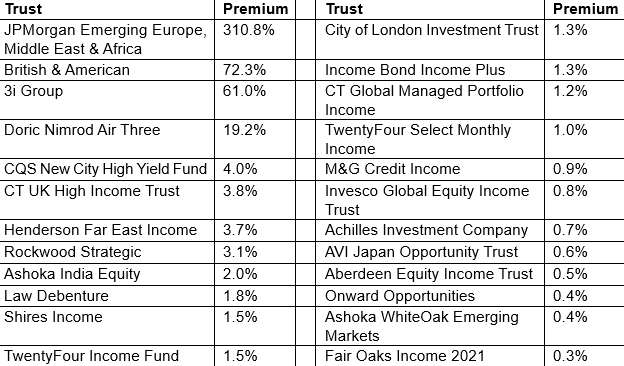
Source: AJ Bell, AIC. Data as of 23 Jun 2025
One of the most consistent themes among premium-rated trusts is income, which has been driven by falling interest rates and the repercussions on the cash market.
“Rates are starting to come down on cash savings accounts and that’s driving more income-hungry individuals back into equities and bonds in search of better yields,” said Coatsworth.
“Furthermore, the investment trust structure also enables a smooth ride with dividends as trusts can keep money in reserve to top up income payments in harder times.”
Some of the most prominent examples include CQS New City High Yield, CT UK High Income and Invesco Global Equity Income.
The latter in particular shows how sharply investor sentiment has turned, as it traded at about 12% discount in 2023 and 2024 and has now jumped to slightly above NAV – a status it hasn’t seen for four years.
That shift also partly reflects a 2024 restructuring that merged several Invesco Select strategies into a single, more focused vehicle, said Coatsworth.
Performance of trust against index and sector over 1yr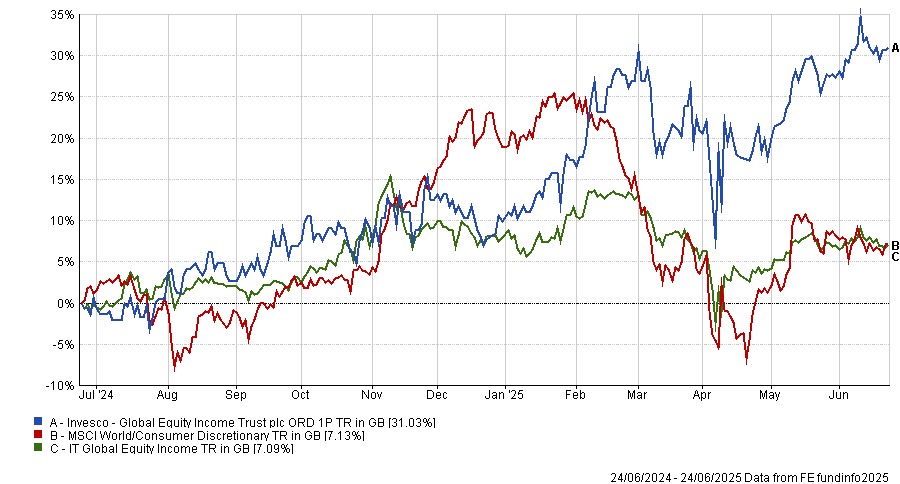
Source: FE Analytics
Some investors are also willing to pay a premium for reliability. In a volatile global environment, “they are happy to pay up for names that can demonstrate success wasn’t simply down to one lucky year”.
One example is the City of London Investment Trust, which is back on a premium after falling to a discount last year. Its appeal, according to Coatsworth, lies in both its strong yield and long-term track record of outperformance.
Over the past 20 years, City of London has delivered a 418% total return versus 283% from the broader UK stock market, but the strategy also achieved first-quartile returns in 2024, as the chart below shows.
Performance of trust against sector over 1yr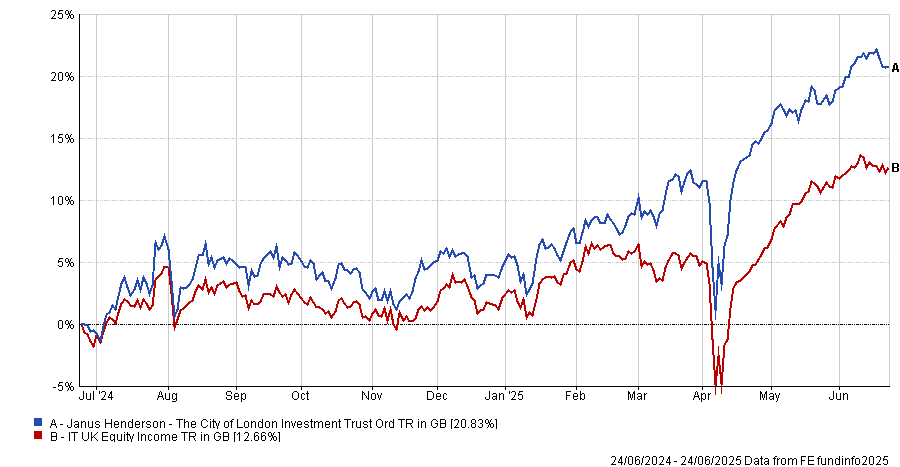
Source: FE Analytics
Its return to favour also reflects a broader recovery in sentiment toward UK equities, which have outperformed many global markets so far in 2025. This was an advantage because the trust is “effectively a ‘best ideas of the FTSE 100’ vehicle, which benefited from owning many of this year’s best-performing UK stocks”.
A smaller group of trusts are trading at a premium because they offer something that’s otherwise hard to access.
Private-equity trust 3i Group is a case in point. Its shares are priced more than 60% above NAV, largely due to its exposure to Dutch discount retailer Action, a private company that has become a rare source of fast growth in European retail.
“Action is growing fast and has all the hallmarks of Amazon in its early days,” Coatsworth said. “Its products are considerably cheaper than those of competitors and it constantly reinvests money back into the business.”
3i owns a 57.9% stake in Action and, for investors, buying the trust is effectively a long-term bet on the retailer’s continued expansion.
But there are other names in more unusual territory, such as the JPMorgan Emerging Europe, Middle East & Africa, which currently trades on an extraordinary 310% premium, up from 167% of January last year.
The trust, previously known as JPMorgan Russian, drastically wrote down its Russian holdings after the 2022 invasion of Ukraine, while some remain frozen. For Coatsworth, its premium rating indicates that some investors may be speculating on a potential thaw in geopolitical tensions.
“There is a suggestion that investors have recently been piling into the trust as a bet on Donald Trump ending the war in Ukraine and that Russian assets will be unfrozen,” he said.
In a recent update, the board of the trust said it believes that this premium “arises because of the uncertainty of what value if any should be attributed to the Russian assets and should not be interpreted as an indication that investors are more likely to derive any value from these assets”.
Despite the general uptick in investment trust premiums, Coatsworth noted that overall premiums remain far below historical levels. At the end of May 2015, nearly a third of investment trusts traded above NAV. Today, only 24 out of 435 trusts – about 5.5% – carry a premium.
Trustnet finds US, European and Asian investments trusts with strong risk-adjusted returns year in, year out.
JPMorgan US Smaller Companies and Aberdeen Asian Income are some of the UK investment trusts posting some of the highest Sharpe ratios of their sectors over the past decade, Trustnet research shows.
Investors use the Sharpe ratio – which calculates the excess return earned per unit of volatility – to determine if an investment’s returns are worth the level of risk. A higher Sharpe ratio means it has delivered more return for each unit of risk.
In this article, Trustnet is looking for investment trusts in the Association of Investment Companies’ regional sectors that have made a top-quartile Sharpe ratio in at least five of the full calendar years of the past decade.
All the trusts that made the cut in this research can be seen in the table below, which is first ranked by the number of years in the top quartile for Sharpe ratio then by their 10-year returns.
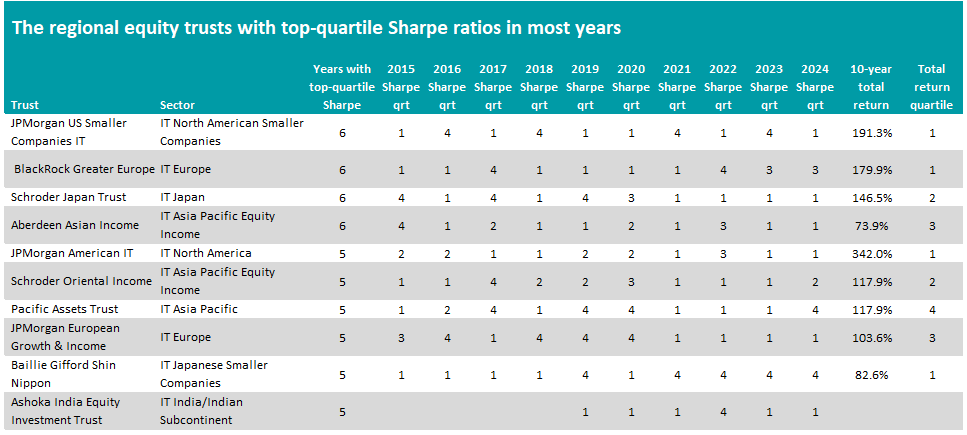
Source: FE Analytics. Total return in sterling between 1 Jan 2015 and 31 Dec 2024.
There are 50 or so investment trusts in the regional sectors and 10 of those have been in their peer group’s top quartile for Sharpe ratio in at least five of the past 10 years.
At the top of the table is JPMorgan US Smaller Companies IT, which was top quartile in six of the years and made a 191.3% total return over the entire period under consideration.
Managed by Don San Jose, Daniel Percella and Jon Brachle, the trust focuses on quality-growth US small-caps. The managers believe this part of the market is undervalued when compared with the soaring performance of US mega-caps over recent years.
JPMorgan US Smaller Companies’ largest overweight is to industrials with safety equipment firm MSA, storage containers and modular building supplier Willscot and water, sewer and fire protection product distributor Core & Main being among its biggest holdings.
Analysts at Kepler said: “Smaller companies generally offer investors the opportunity to invest in less well-researched companies, often more domestically focussed and operating in niches that may not be covered by larger companies.
“US smaller companies are no different, but with the addition of a continental-sized economy, even a domestically focused company may have significant growth potential within its home market.”
Performance of JPMorgan US Smaller Companies vs sector over 10yrs to end of 2024
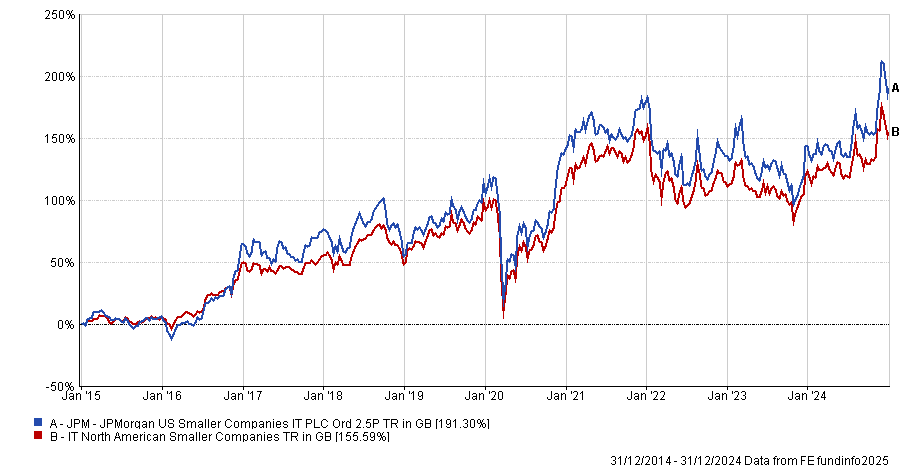
Source: FE Analytics. Total return in sterling between 1 Jan 2015 and 31 Dec 2024.
Next is BlackRock Greater Europe, with six years in the top quartile for Sharpe ratio and a 10-year total return of 179.9%.
It is managed by Stefan Gries and Alexandra Dangoor, who run a concentrated portfolio where the 10 largest holdings account for more than half of the assets. These include RELX, Safran, Hermès, SAP and Ferrari.
The managers can invest in small-, mid- and large-cap companies but tend to focus on larger companies. They also have a preference for quality-growth companies, which have performed strongly for much of the past decade.
In third is Schroder Japan Trust, managed by Masaki Taketsume. It has a top-quartile Sharpe ratio for six of the past 10 years, with a total return of 146.5%.
Taketsume has a high-conviction, bottom-up approach that looks for high-quality but undervalued companies across the market cap spectrum, with a meaningful allocation to smaller companies. Top holdings include Asahi Group, Hitachi, T&D Holdings and Miura.
Kepler’s analysts noted that the manager has outperformed the Topix benchmark since becoming lead manager five years ago.
“We think this reflects his deep experience and understanding of the Japanese market,” they added. “Moving forward, we think improvements from corporate governance reforms and the fact value continues to outperform growth, could remain supportive factors for Schroder Japan’s performance, given Masaki’s value-oriented and high-quality investment approach.”
Aberdeen Asian Income is the only other trust to have spent six of the past 10 years in the top quartile for Sharpe ratio. Over this time, it made a 73.9% total return.
It is managed by Aberdeen’s Singapore-based Asian equities team, which has around 40 analysts based in six locations in the Asia-Pacific region. The team tends to invest in quality companies with strong balance sheets and activities in structural growth areas.
Analysts at Edison said: “Aberdeen Asian Income can be considered as a core fund for investors seeking exposure to Asia-Pacific companies, which in aggregate have stronger balance sheets than businesses in developed markets.
“Aberdeen Asian Income’s quality portfolio with its yield bias means that the company should be resilient during periods of share price weakness, but is likely to lag a strong equity market.”
Trustnet examines the top quartile global funds with less than £250m in assets under management.
Investors tend to gravitate towards larger funds, but bigger is not always better when it comes to funds. Smaller funds run less money, so managers can be nimble and invest in stocks lower down the market capitalisation spectrum.
Larger funds, by contrast, are often unable to invest in smaller opportunities because they would be forced to either take an overly large stake in the company or establish a position that is too small to make a difference to the fund’s overall return.
But for investors after a smaller fund, it can be challenging to decide where to start because many of these are relatively under the radar. With this in mind, Trustnet examined the global funds with top quartile returns over the three years to the end of May 2025 but less than £250m in assets.
Based on these criteria, 38 global funds could be considered hidden gems, as seen in the table below.
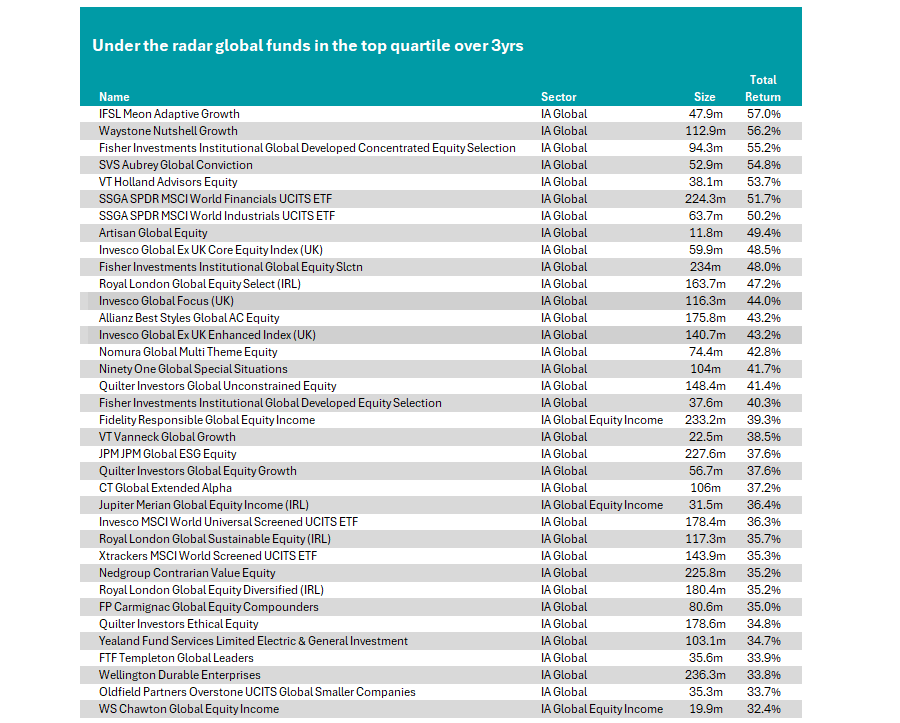
Source: FE Analytics. Returns in sterling as of 31 May.
Heading up the chart is the IFSL Meon Adaptive Growth portfolio. Led by Robert Hale since 2022, it has delivered a total return of 57% over this period, compared with an average return of 23% from the IA Global sector.
Hale uses computer modelling to assess numerous financial measures of the companies and exchange-traded products to determine whether they should be included in the portfolio, although the manager “reserves the right to use their judgement to override the output of the computer model”.
The fund invests at least 80% of the portfolio in large-cap companies listed on any UK, USA and European stock markets, but it does not currently hold the likes of the Magnificent Seven (Alphabet, Amazon, Microsoft, Nvidia, Apple, Tesla and Meta), which have dominated the global market in recent years.
Instead, the fund’s top stock holdings are Berkshire Hathaway, Deutsche Boerse, RELX, Vistra Energy and Boston Scientific, alongside some cash and gold.
Reviewing last year’s performance, Hale said: “The performance of global stock markets continues to be dominated by stocks listed on United States markets.
“Large names such as Nvidia Corp continued to grab the headlines during the period, but the investment process has steered the [fund] away from exposure to such volatile situations, choosing to further diversify the portfolio that currently stands at around 53 individual company investments.”
Performance of the fund vs the sector over the past 3yrs
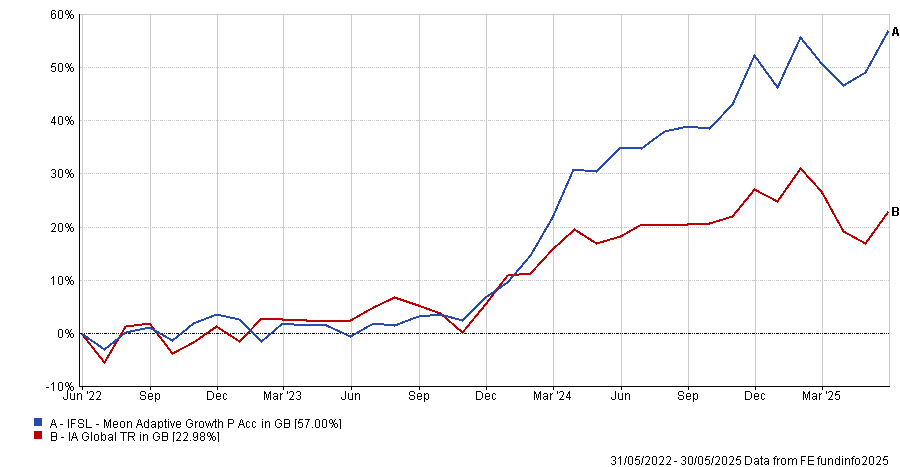
Source: FE Analytics.
The Waystone Nutshell Growth fund comes in second with a total return of 56.2% over this period.
Despite having running over £100m, it is not entirely unheralded and is featured on FundCalibre’s elite radar. Analysts explained that due to manager Mark Ellis’ background as a trader at NatWest and Bear Steins, the portfolio takes a very different approach to its peers.
In contrast to many active managers, Ellis believes trading is not necessarily bad, with the team willing to make quick shifts in allocation in response to new information. While this does make it more volatile than the average peer, it also gives the fund a “rare combination of pragmatism and academic rigour” and, according to FundCalibre, exciting long-term potential.
This is another fund that puts quantitative analysis at the heart of its process, running a deep data extraction from 10,000 publicly listed companies, screening them on return on invested capital, profit margin and market cap, and using 50 financial and non-financial metrics to score the resultant universe.
FundCalibre said: “What makes this fund particularly interesting is its rare combination of pragmatism, given Mark’s trading background and academic rigour. The quant process is grounded in logical academic reasoning and the fund has delivered thus far. We like the fund’s nimbleness and its ability to quickly reposition.”
Performance of the fund vs the sector over the past 3yrs
Source: FE Analytics.
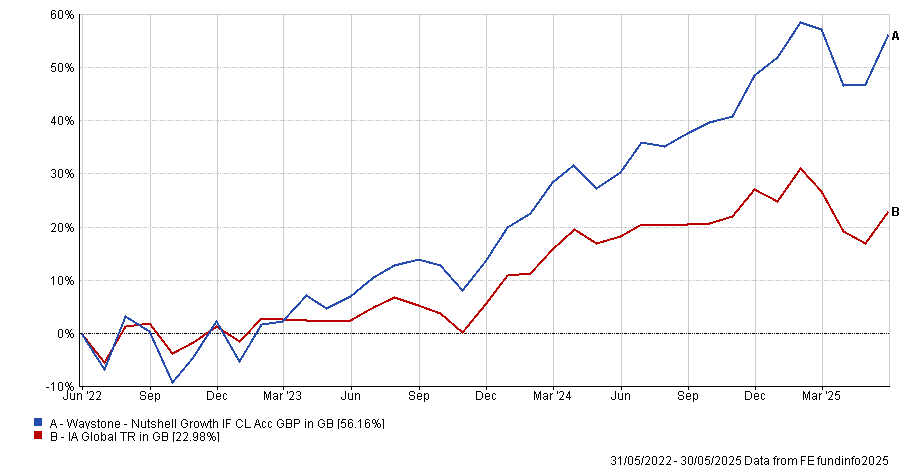
Elsewhere, large asset managers are home to a range of smaller funds, often run by highly experienced managers. For example, the JPM Global ESG Equity fund is led by Timothy Woodhouse and Joanna Crompton, two FE fundinfo Alpha Managers, who run several larger strategies at JP Morgan Asset Management.
It was a top-quartile performer in 2022, 2023 and 2024, due to high allocations towards Microsoft, Amazon and Nvidia. However, it has over 63% of the portfolio in the US, which has weighed on returns as investors have started rotating out of the US this year.
ESG strategies have also struggled with issues such as the US’ rollback of climate and diversity-related initiatives, high interest rates and the outperformance of areas like energy stocks.
Performance of the fund vs the sector over the past 3yrs
Source: FE Analytics.
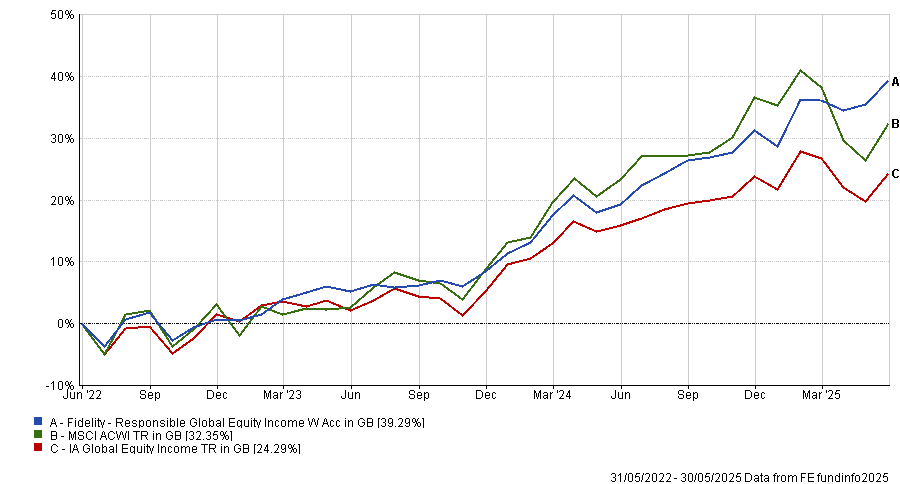
In the global equity income sector, the Fidelity Responsible Global Equity Income fund also qualified. This is another ESG-focused fund, aiming to invest at least 80% in companies with high ESG ratings or companies with “low but improving sustainability characteristics”.
Rather than the US, it favours European and UK companies such as Deutsche Boerse and Unilever. With just 33% exposure to the US, it is the sixth best-performing global equity fund so far this year.
It has also delivered top-quartile results more widely and is the best-performing global equity income fund in the sector over the past decade, returning 248.9%.
Performance of the fund vs the sector and benchmark over the past 3yrs
Source: FE Analytics.
Royal London also has a top-performing sustainable fund – the Royal London Global Sustainable Equity (IRL) fund, led by Alpha Manager Mike Fox. Over the past three years, it has delivered a top-quartile return; however, it slipped into the bottom 50% of the sector over the past year.
Two of its stablemates, Royal London Global Equity Diversified (IRL) and Royal London Global Equity Select (IRL), also delivered top-quartile results in this period. However, these strategies have new management teams who joined in November last year, following the departure of former head of equities Peter Rutter and his team.
SOS plan calls for tax breaks and reform to revive the UK stock market.
Policymakers need to take urgent action to halt the decline of the UK equity market and revive a culture of investing among the general public, according to IG.
The UK trading giant’s call for action comes amid growing concern over the health of the UK stock market, with 88 companies exiting the London Stock Exchange in 2024 alone while only 18 joined.
Michael Healy, UK managing director at IG, said: “We’re watching a crisis unfold and we need bold action. Our stock market – once the envy of the world – is in a downward spiral.”
The UK is “stuck in a damaging savings-first mindset”, he noted, with too few people investing to build wealth for the long term.
IG analysis shows that cash savers have seen just one-seventh of the real returns achieved by stock market investors.
In an attempt to turn the tide, IG has unveiled a new campaign – Save Our Stock Market (SOS) – introducing a four-point survival plan.
Abolish cash ISAs
According to IG, cash ISAs are failing savers.
Instead, the government should consider redirecting the associated tax relief towards equity investment, end new cash ISA openings and set the annual allowance for them to zero from April, the trading platform said.
Scrap Stamp Duty
IG describes the house and land purchase tax as a “self-inflicted wound”.
As such, it has called for its removal, noting that the UK is one of the few major economies to penalise equity investment in this way.
Reward investors backing the UK
To boost long-term retail investment in UK-listed companies, IG recommended offering 20% income tax relief on UK shares held within ISAs for at least three years, modelling this idea off the Enterprise Investment Scheme.
Encourage new investors
UK regulators’ “overly cautious” regulatory approach is reinforcing fear of investing, IG said.
Instead, the trading body has called for clearer definitions between advice and guidance to allow financial services providers to better promote long-term investing benefits without regulatory uncertainty.
“For too long, policymakers have been paralysed by the desire to keep everyone happy,” Healy finished. “But the time for working groups is over – this is about getting more Brits investing, while saving a strategic national asset before it’s too late.”
RBC Brewin Dolphin highlights four regions that stand to capitalise on US underperformance.
The UK and parts of the emerging markets could become more attractive to investors if the US exceptionalism trade continues to falter, RBC Brewin Dolphin argues.
The recent underperformance of US markets has sparked a provocative question: Is this the end of American exceptionalism?
In 2025 so far, the US market has made a 5.2% loss while the rest of the world logged a 6.8% gain, according to RBC Brewin Dolphin analysis.
This shift has coincided with increasing investor scrutiny of the US economic and policy outlook and could be seen as a disappointing end to a historically strong track record.
The US equity market has outperformed the rest of the world 30 out of the last 50 years. Over the past 15 years, the rest of the world only outperformed the US in 2017 and 2022 as the meteoric rise of tech stocks and the so-called Magnificent Seven companies kept the US far ahead of its rivals.
Since 1974, the MSCI USA index has returned 25,833.6% (the equivalent to 11.8% annually), compared to 10,311.9% (9.7% annually) for the MSCI World ex USA.
MSCI USA vs MSCI World ex USA since 1974
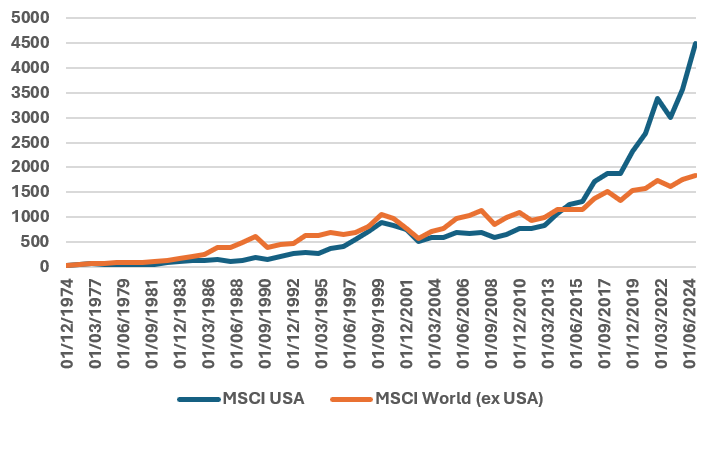
Source: Bloomberg, RBC Brewin Dolphin
What does it mean to be ‘exceptional’?
The term ‘American exceptionalism’ first emerged in the 1920s – essentially referring to the outperformance of US stocks compared with the rest of the world.
The country’s strong track record can largely be attributed to a strong culture of innovation and entrepreneurship, flexible labour markets, higher productivity (i.e., producing more with less) and strong consumer demand driving goods and services, bolstered by a favourable regulatory environment, lower corporate taxes and more open markets and trade policy.
This culture has come under increasing pressure in 2025, thanks to president Donald Trump’s looming tariffs and volatile foreign policy spooking markets.
With confidence in American exceptionalism now wavering, there is a growing argument for investing in the rest of the world outside of the US. Rob Burgeman, wealth manager at RBC Brewin Dolphin, has identified four key regions that could stand to benefit.
The UK and EU
Trump’s criticisms on defence spending forced an overhaul in the EU’s spending priorities which has, in turn, made the region more attractive.
“The change in rhetoric from the US when it comes to Europe’s defence has prompted a lot of the continent’s governments to reassess their spending priorities – perhaps most notably is Germany’s €500bn commitment to infrastructure and defence, which was rubber stamped earlier this year,” said Burgeman, noting that the valuation gap between the US and Europe could begin to narrow.
However, not every country across the bloc will benefit in the same way “and the same can be said for industries within the nations that do”, he said.
Meanwhile, the UK market has long been dismissed in the global growth story, thanks to the FTSE’s heavy tilt towards value stocks and the damaging impact of Brexit.
Despite this, the UK is “looking like a more attractive market” for investors hunting for opportunities beyond the US, due to its “comparatively stable policy environment” and generally high-quality defensive companies across banking, energy, pharmaceuticals and other industries.
China and emerging markets
China has rapidly emerged as an “interesting place to invest”, according to Burgeman.
It may still be recovering from a bruising property crisis and the legacy of Covid-era restrictions, but the country is also seen as a frontrunner in artificial intelligence (AI) implementation, he said, meaning it is one of the few regions that can offer similarly scaled alternatives to US tech giants.
“What is good for China is often good for the wider Asia-Pacific region as well – an area that is difficult to disentangle from the broader category of emerging markets,” Burgeman said.
A weaker dollar will also be good news for both Asia and emerging markets more broadly, as much of their debt is denominated in US dollars, Burgeman explained.
“That frees up capital that can be invested elsewhere in rapidly growing markets, while any tariffs placed on China will likely see manufacturing moved to Vietnam, India and other countries, which can only be to their benefit.”
Are we about to see the ‘great rotation’?
In the years to come, returns may well be better in markets outside of the US but that doesn’t mean the American dream is down and out, Burgeman insisted.
Rather, this is about broadening the field, not abandoning it.
“It is not a zero-sum game – just because other markets perform better doesn’t necessarily mean the US will suffer,” he said.
“Disinvesting from the US means cutting exposure to some of the biggest and most successful tech companies in the world and few other markets have any equivalents or competitors of similar scale.”
So, the real story may not be a dramatic dethroning of US markets, but a more balanced global investment environment.
Evenlode’s James Knoedler explains why he’s been doubling down on companies with differentiated and well-invested products.
We usually find the regular rhythm of corporate earnings a useful cue for stock-taking, but this year has been different with tariff drama rendering actual earnings trends irrelevant, or at least severely deprioritised in terms of market attention.
Yet the Q1 earnings are an interesting counterpoint as they pre-date the Liberation Day drama. While there was an understandable focus on post-quarter trends and forward guidance, what was most useful were the trends which are likely to persist even if tariffs are entirely rolled back.
The US bellwether
The US consumer represents the most important swing factor for global personal consumption and perhaps the most important single motor of the global economy. As the consumer has been under pressure from the severe inflationary pulse of 2022-23, our expectation was, given moderating inflation and sustained decent household income growth, ‘nature would heal itself’ as consumers and small businesses repaired their balance sheets and resumed normal consumption behaviour.
This has not materialised as the economic environment became incrementally tougher. In the universe of large consumer staples companies we track, US organic sales slipped into decline during the quarter.
Meanwhile, broad economy indicators like Mastercard and Visa disclosure on payments volume, Bank of America (BoA) data on spending by their depositors and federal agency surveys continue to be healthier than those for consumer goods and for lower end consumer services.
However, the BoA’s picture of the lower-end consumer corroborates the other data we are looking at. Likewise, data on credit card delinquencies and student loan borrowers indicate growing stress disproportionately on specific demographics.
Through-cycle growth
We are not predicting a recession or a bear market, but there is an important and neglected trend which has been overshadowed by geopolitical histrionics. At a high level the US looks great, with low unemployment, gradually improving bank loan growth, strong productivity growth and (until tariffs) strong corporate confidence.
Therefore, there is a temptation to say that these consumers can be written off as unnecessary for corporate earnings but it will be quite hard to sustain double-digit corporate earnings growth if the fortunes of consumers, who in aggregate make up about 45% of consumer expenditure, continue to weaken.
While it is tempting to dump staples or cyclicals at this point, this is the wrong debate to have. We are not reducing or adding to cyclically exposed companies and we continue to retain a mixture of names with idiosyncratic cyclical exposure like Informa, Amadeus, Experian, Marsh McLennan and Booking, as well as those with more defensive characteristics like Heineken, RELX, Jack Henry and Johnson & Johnson.
The most important common thread is not low defensiveness or high gearing into GDP growth, but the ability to grow market share over time through cycles thanks to an increasingly superior and desirable product. Where we are invested in cyclical companies, they tend to the best player in their market and to be revenue-critical to their enterprise clients.
Even companies which are ostensibly consumer-facing like Booking and L’Oréal are vital partners to their enterprise partners – in this case, hotel owners and retailers – as their brands and networks drive high margin traffic to fixed cost locations which need to keep the cash flowing in to pay shareholders and service leases.
The most important takeaway is that earnings growth is likely to be tougher and more idiosyncratic than in the recent past, reinforcing our desire to double down on companies with differentiated and well-invested products.
Trimming the sails
Our commitment to managing valuation risk is unchanged and remains indifferent to macroeconomic context; we endeavour to ensure that our portfolios enjoy a margin of safety, irrespective of market sentiment, for the same reason that responsible ship captains keep servicing their lifeboats regardless of the weather. Where we have made changes, it has been focused on these quality upgrades.
We have added two holdings which sell to a consumer base (New York Times and Booking). In the case of Booking, it was a straight swap for Airbnb: we have concluded that Booking’s superior investment and diversification make it more defensive and more likely to gain total lodging share over time.
Similarly, New York Times is a well-invested, category defining franchise, with a good history of execution in changing its business model and keeping focused on its ‘true north’ of business excellence in a market which has been utterly upended by the internet.
Performance has been strong in the context of the data above on the lower-income consumer, which has made the economy quite dependent on the cohort of higher-income consumers and capex boom on server capacity. In an unbalanced economy, we are continuing to see good growth from a more balanced portfolio.
While the gap between portfolio growth and index growth is reassuring, it is less important than another gap which we can only track retrospectively: the long-term difference between fundamental compounding by our portfolios and by the wider universe of investable companies is key to our strategy. For now, our portfolio valuation remains attractive in relative and absolute terms despite its outperformance of the broader index since the start of the year.
James Knoedler is portfolio manager of the Evenlode Global Equity fund. The views expressed above should not be taken as investment advice.
Experts explain why investors should care about recent takeovers of investment trusts.
The number of investment trusts on the market has dropped by almost a fifth over the past three years, according to AJ Bell.
The platform’s analysis of data from the Association of Investment Companies (AIC) found 279 trusts were listed on the London market at the end of May 2025, down from 337 in the same month of 2022. This is a fall of 17%.
Dan Coatsworth, investment analyst at AJ Bell, said: “There are now fewer trusts on the market than 10 years ago, which is quite remarkable when you consider how they’re increasingly popular with retail investors.”
There have already been three times as many takeover bids this year as in 2024 and takeover action can be expected to continue for the rest of the year, he explained. “Sustaining a rapid pace of takeovers would exacerbate a worrying trend that’s already in motion, namely the shrinking pool of investment trust opportunities on the market.”
But why is this happening if investment trusts remain popular with retail investors?
Firstly, many trusts are “trading well below the underlying value of their portfolio”, creating attractive bargains for international investors. The average investment trust currently trades at a 14% discount to net asset value (NAV) but some have a discount of more than 50%, according to AIC data.
There has also been increased activity from activist investors, or shareholders who use their equity stake in a company to influence its management and strategy. This has “put pressure on trust boards to take improve performance, narrow discounts or take trusts in a new strategic direction”, Coatsworth said.
While US hedge fund Saba Capital failed in its shareholder battles last year, it provided a “wake-up call” for trusts to “think about what is best for shareholders long term”.
The investment trust market also suffers from some inefficiencies. Investors tend to avoid trusts below a certain size, so the market is full of trusts with less than £200m assets under management that failed to gain traction. “Various sub-scale investment trusts [are] realising they either need to get bigger or admit defeat and return money to shareholders”, as investors will not buy trusts below a certain size.
So far this year, most takeover bids have been in the property or renewable sectors, which have traded at significant discounts due to higher interest rates and reduced appetite for green investing.
Russ Mould, AJ Bell’s investment director, added: “The UK stock market continues to be on sale. If investors don’t recognise the good value opportunities on offer, trade buyers or private equity firms will keep swooping on targets and pick them off one by one.”
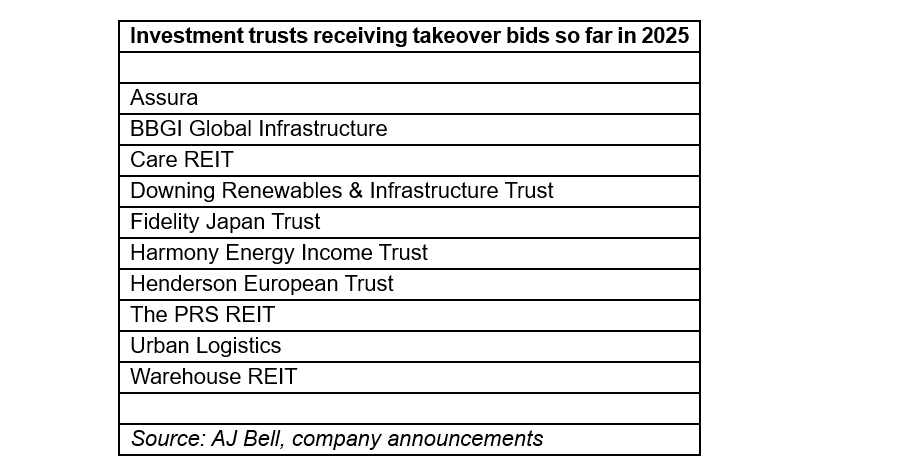
Source: AJ Bell
There have been several high-profile takeover bids recently, including the drawn-out battle for NHS property business Assura, which has been running since February.
Initially, it supported a cash bid from private equity consortium KKR/Stonepeak, but Assura now favours a larger £1.8bn offer from London real estate investment company Primary Health Properties (PHP).
Oli Creasey, head of property research at Quilter Cheviot, said: “Assura had previously faced accusations that, by promoting the lower bid, they were not seeking best value for shareholders. That accusation appears to be put to bed.”
However, with PHP’s share price down 2% in the past five days, further slides could narrow the gap between PHP and KKR’s bid, so the saga may not be over yet. “Given events to date, further twists and turns could be on the cards.”
While this was the most contested recent bid, it is not the only one. Earlier this month Downing Renewables and Infrastructure Trust (DORE) agreed to a £175M bid from Polar Nimrod Topco Limited (Bidco), a subsidiary of Bagnell Energy. It has secured the backing of 22.5% of eligible shareholders.
Matthew Read, senior data analyst at Quoted Data, noted that “by most objective measures, the trust has performed well”. It is up 35.9% over the past year, which is the best performance in the IT Renewable Energy Infrastructure sector.
Performance of the trust vs the sector over the past year
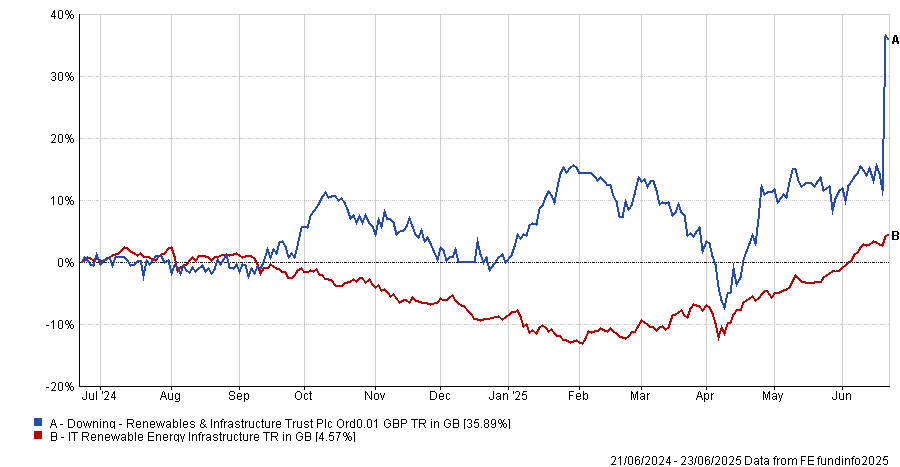
Source: FE Analytics
However, it has faced several headwinds, including rising interest rates, a lack of scale and limited liquidity, with a buyback programme in 2023 that failed to close the discount in any meaningful way, he explained. As a result, it has fallen out of favour with investors despite strong returns.
“This deal follows a now-familiar playbook: a subscale, well-managed renewables trust with strong NAV performance finds itself persistently undervalued by public markets and is ultimately taken private by a long-term investor that can see the potential,” Read said.
“With institutional investor support in hand and no counter-bid likely, the deal appears poised to go through, but we are sorry to see it go. It marks yet another chapter in the ongoing consolidation and privatisation of UK-listed alternatives.”
Other recent high-profile bids included the Henderson European Trust and Fidelity European Trust merger announced last week.
Experts look at why healthcare stocks have struggled over the past year and examine if there is hope for this to change.
Healthcare stocks have been in the mire for the best part of a decade and are facing an ‘annus horribilis’ over the past 12 months. Despite hopes of a turnaround, Garry White, chief investment commentator at Charles Stanley, said investors are wise to be cautious.
This year, global healthcare stocks have tumbled 7.2% (as represented by the MSCI World/Health Care index), some 6 percentage points lower than the broader MSCI World.
But this is not a new phenomenon. From 2015 to 2024, the healthcare sector has outperformed the wider market in just three years (2022, 2018 and 2015).
It may have left investors sorely disappointed, as over the past decade healthcare stocks have made half the returns of the wider market, as the below chart shows.
Performance of indices over 10yrs
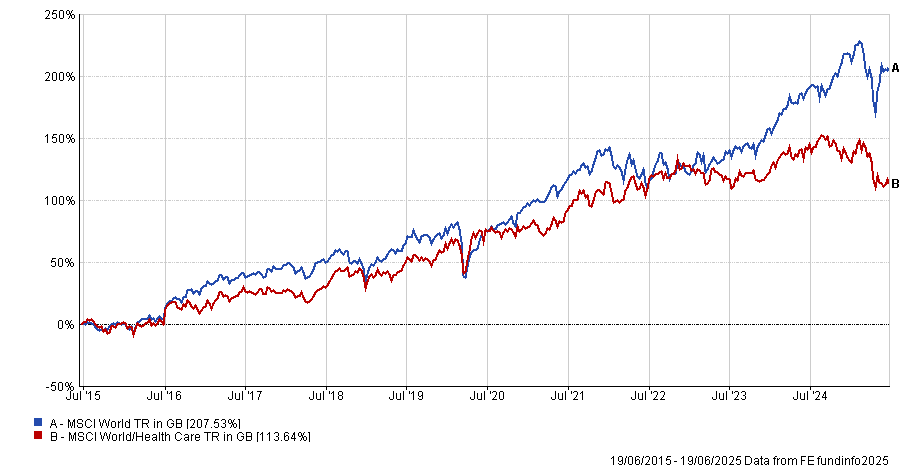
Source: FE Analytics
Yet it is a sector of great importance, not only for the wellbeing of the world but also in particular for UK investors, with pharmaceutical giants GSK and AstraZeneca among the six stocks that make up some 12.7% of the FTSE 100 index.
So why has the sector so badly struggled recently?
The most recent bout of poor performance has been driven by a mix of regulatory uncertainty, pricing pressures and investor rotation into higher-growth sectors such as technology and artificial intelligence (AI), said White.
“One of the key drags on performance has been concerns over drug pricing reforms and patent cliffs. The Biden-era Inflation Reduction Act (IRA) allowed Medicare to negotiate prices on select drugs,” he said.
“Signed into law in 2022, the IRA granted Medicare – for the first time – the authority to negotiate prices for certain high-cost prescription drugs. This long-contested provision aims to curb federal spending and reduce out-of-pocket costs for millions of Americans.”
In response, pharmaceutical giants, such as AstraZeneca, launched legal battles against the policies but a May 2025 landmark ruling in the court of appeals upheld the law and dismissed the claims.
Additionally, president Donald Trump signed an executive order in April that expanded Medicare’s negotiating power and introduced a controversial ‘most favoured nation’ pricing model, meaning drugmakers selling into the US would be pushed to match the lowest price paid by other countries.
“Industry groups argue that pegging US prices to international benchmarks could stifle innovation and lead to drug shortages if companies pull out of less profitable markets. Still, the Trump administration appears undeterred,” said White.
Janus Henderson research analyst Luyi Guo said last month the “sheer lack of detail” makes it “difficult to assess the immediate impact”.
“For example, the order cites no obvious legal authority to mandate lower drug prices, so it remains to be seen how effectively the Trump administration would be able to enforce the new policy. And it is unclear which insurance programs would be targeted and to what extent,” she said.
Then there are the ‘Liberation Day’ tariffs, which would impact the profits made by international pharmaceutical companies that export drugs to the US.
“The administration argues that foreign price manipulation and supply chain vulnerabilities have left the US exposed, especially in times of crisis,” said White.
“However, the move has sparked concern among healthcare providers and policy experts. Critics warn that tariffs could exacerbate drug shortages, raise costs for patients and disrupt access to essential medicines.”
While some are lobbying for exemptions, none have been forthcoming at present.
Despite all of this, “analysts remain cautiously optimistic about the long-term fundamentals of the healthcare sector”, said White, citing ageing populations, rising chronic disease burdens and technological innovation as likely to underpin demand.
Although there are short-term price pressures from the policies above, biotech innovation – particularly in gene therapy, oncology, and AI-driven drug discovery – is a long-term theme that could boost the industry, he added.
“M&A activity is also expected to pick up, as large companies seek to replenish pipelines and diversify revenue streams. A wave of strategic acquisitions is likely,” the Charles Stanley chief investment commentator said.
This is in addition to the rapid rise of weight-loss drugs such as Ozempic, which David Goodman, fund manager in the Liontrust Global Equities team, described earlier this year as “pioneering treatments”.
He pointed to data from Scott Galloway, professor of marketing at the NYU Stern Business School, which suggested the health phenomenon could have a bigger economic impact on the US than AI.
“These drugs have the potential to be a transformative force for good in healthcare, the economy and society as a whole,” he concluded.
So what should investors do now?
In the short-to-medium term, the outlook is mixed, said White, with the healthcare sector “at a crossroads”.
“Share-price underperformance, policy uncertainty and the threat of tariffs have created a challenging environment for investors and operators alike. Yet the sector’s long-term drivers – demographics, innovation and global demand – remain intact,” he said.
“As the Trump administration’s trade and healthcare policies take shape, the coming months will be critical in determining whether this is a temporary setback or a structural shift. For now, caution – and close attention to Washington – remain the order of the day.”
Guo agreed, suggesting healthcare stocks may “continue to be prone to volatility”, but added that we could be “slowly nearing the end of the regulatory uncertainty”.
For those who do want to invest, she suggested investors should “stay focused on the attractive fundamentals” and those companies with both defensive characteristics and future growth opportunities.
And there could be a good reason to get in now, with Janus Henderson’s Guo noting the sector is trading at a nearly 20% discount to the benchmark versus the long-term average of a 4% premium.
“The entry point for long-term investors has rarely been this attractive. Starting from such low valuations, we believe healthcare stocks are primed for gains when there’s positive news,” she concluded.
Ninety One’s Alessandro Dicorrado explains why aerospace manufacturers, airlines and banks are compelling value.
The UK is home to many attractive value opportunities including the likes of Jet2 and NatWest, according to Ninety One’s Alessandro Dicorrado.
After years of underperformance, value investing appears to be experiencing a resurgence. Over the past year, the MSCI ACWI Value index is up 5.8% in sterling terms, outpacing its MSCI ACWI Growth counterpart, which climbed 5.4%.
On a geographic basis, value-driven markets such as the FTSE All Share (up 9.8%) are outperforming traditional growth markets such as the S&P 500 (up 4.2%).
For Alessandro Dicorrado, manager of the Ninety One UK Special Situations fund, this has made it “particularly interesting to fish for opportunities in [the UK] pond”. UK businesses are cheaper than “almost anywhere else” and, when markets seem more uncertain, he thinks value stocks in the UK have much further to run.
For example, he is bullish on aerospace manufacturer Melrose, which is down 7.3% this year, despite the FTSE All Share Aerospace and Defence index surging following widespread commitments from governments to increase defence spending.
Performance of Melrose year to date
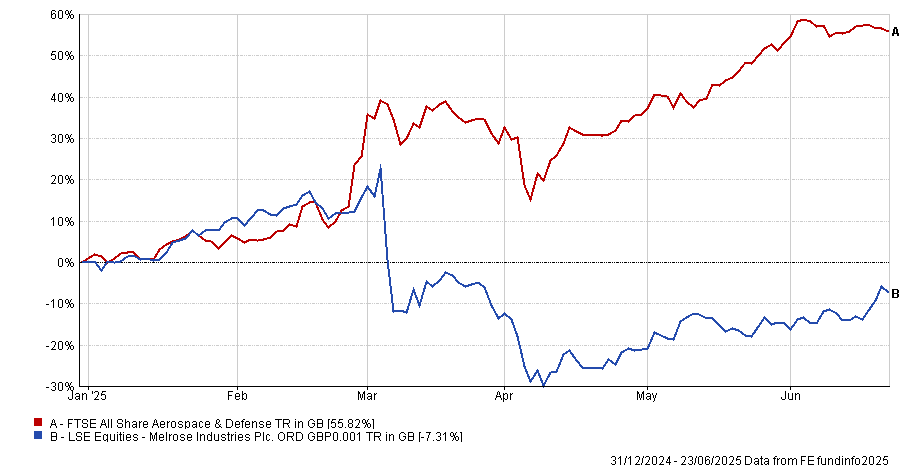
Source: FE Analytics
Melrose has been investing internally to refresh its supply of jet engines, which has been a headwind on performance since the UK market “does not appear to like it when you invest a lot internally”.
However, Dicorrado explained: “The essence of our value approach is to move towards where there is uncertainty, where people are doing things because of emotion rather than rationality.”
Companies may only need to purchase a few jet engines each year, but they demand constant upkeep. As very few companies are able to maintain them, customers will go to Melrose for engine maintenance, meaning the company will continue to grow its earnings long term, he said.
Despite this, Melrose trades on a price-to-earnings ratio (P/E) of just 10x, whereas competitor businesses in the same field trade closer to 20x. “We think that is worth it,” Dicorrado said.
Jet2 is another favourite value stock, which was initially purchased when airline shares slid during the pandemic. This led to the market heavily underestimating the company’s solid fundamentals and long-term growth potential, Dicorrado explained.
“Every time there's an airline involved, this is a company that needs to be well run. It's not an easy business to run, but it's been run extraordinarily well run largely by the same team for the last 15 years,” he said.
“We bought this during Covid when the revenues elapsed but the company always had a good balance sheet and was conservatively financed, so we knew it would survive. We just didn't know when the recovery would come.”
Although airline stocks were hit hard by the pandemic’s travel restrictions, Jet2 was able to benefit from the fact it “owns the entire client experience”: customers can book their flight and accommodation through the firm.
This meant travellers felt more comfortable booking with Jet2, as they could cancel flights and hotels in one go if necessary, receive a refund and get a discount on their next trip. The result was Jet2 gaining market share during the pandemic and the share price has reflected that, Dicorrado explained. While other airlines have struggled since the pandemic, Jet2 has soared 107.3%.
Performance of Jet2 over the past 5 years
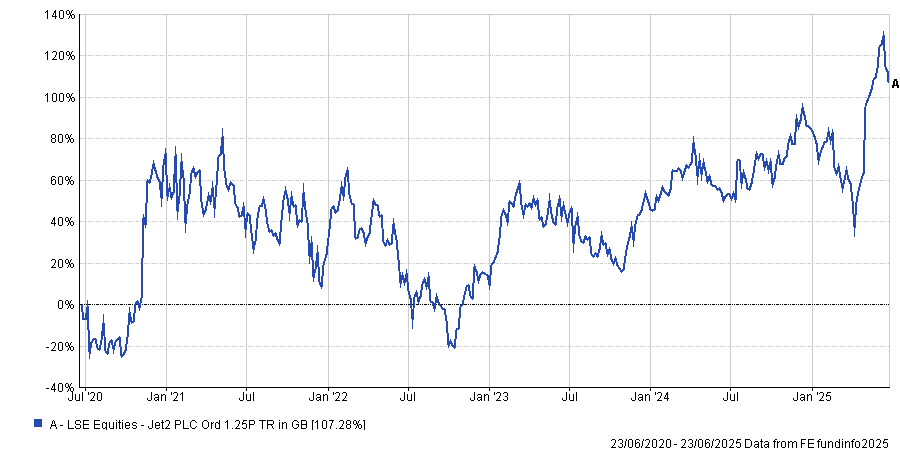
Source: FE Analytics
“We’re not talking about a tiddler company no one can buy. It’s a wonderful domestic business on a 9x P/E ratio, which is not an expensive price for a company of this quality.”
Finally, the Ninety One UK Special Situations manager pointed to NatWest. The bank is the second-largest holding in the portfolio and has returned 27.3% this year. “It trades on a 5x P/E ratio and we think that’s enough to take on a business that isn’t all that impressive,” Dicorrado said.
Performance of NatWest year to date
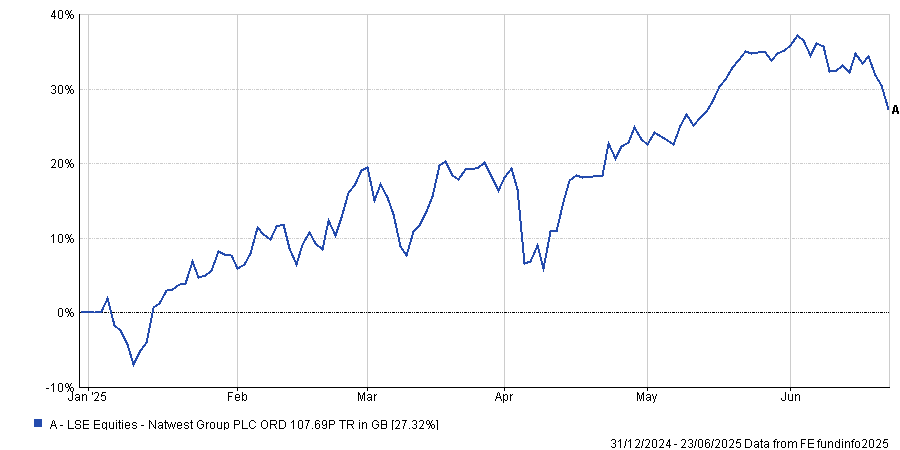
Source: FE Analytics
The unique advantage of holding NatWest as a value investor is its extremely high payout. The average dividend payout on the UK market is around 6%, but “NatWest pays out almost 15%” when combining its 4% dividend yield with share buyback payouts, he explained.
“With a yield that high, you don’t need anything else from NatWest; you just need it to exist. It’s not an amazing business, but it’s good enough.”
This is a great “deep value opportunity”; one of four value buckets that underpin Ninety One’s approach to value investing, alongside fallen angels, cyclical leaders and special situations.
Fallen angels are former high-quality businesses that have suffered a blow but remain strong and “quite stable companies” that can compound over time. Because they are so out of favour, they can often be bought at “panic levels” of distressed valuations.
Cyclical leaders are one of the most common types of businesses in the UK economy, which vary depending on the economic cycle. Special situations refer to businesses that the market misunderstands, whether because a key element has been spun-off or they have assets that investors are unaware of.
The data suggests that this approach to value investing has paid off. Over the past year, the Ninety One UK Special Situations fund is up 19.5%, the fourth-best return in the IA UK All Companies peer group. It has also posted top quartile results over the past three, five and 10 years.
Performance of the fund vs the sector and benchmark over the past year
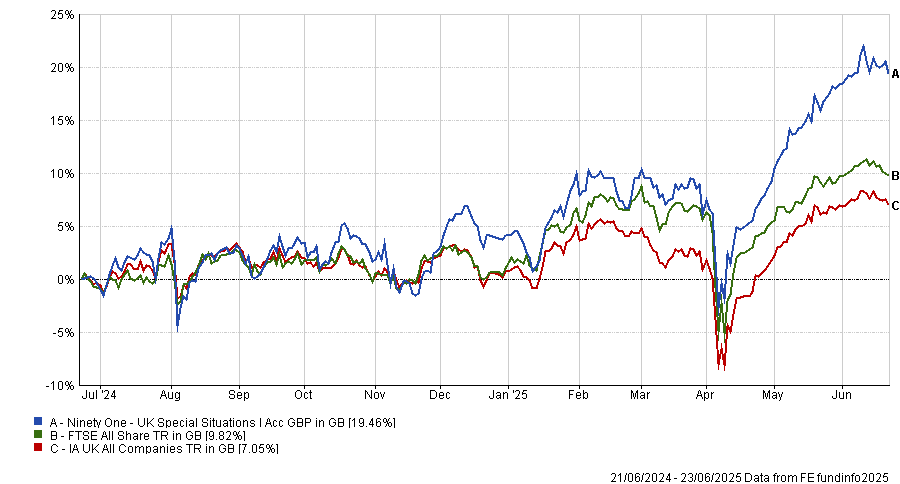
Source: FE Analytics
Meanwhile, Hong Kong, Germany and the UK are winning out in 2025.
Investors are used to seeing the US dominate performance tables but the first half of 2025 has painted a different picture.
There has been a reshuffle in global stock market leadership, with the likes of the UK staging an unexpected resurgence and the US no longer the top choice for many investor portfolios, according to AJ Bell.
As illustrated in the table below, the S&P 500 has posted a modest 2.1% return so far – outstripped by the FTSE 100 (9.6%), DAX (17.3%), Bovespa (14%) and Hang Seng (17.3%).
|
Year-to-date total returns for major markets around the world |
|
|
Country |
Total return |
|
Hong Kong (Hang Seng) |
17.3% |
|
Germany (Dax) |
17.3% |
|
Brazil (Bovespa) |
14.0% |
|
UK (FTSE 100) |
9.6% |
|
France (CAC 40) |
5.7% |
|
India (S&P BSE 100) |
4.7% |
|
US (S&P 500) |
2.1% |
|
China (SSE Composite) |
0.2% |
|
Japan (Nikkei 225) |
-3.7% |
Source: AJ Bell, ShareScope. Data 1 Jan to 20 Jun 2025
Dan Coatsworth, investment analyst at AJ Bell, said: “Tariffs, downgrades to earnings and economic forecasts and geopolitical conflict were the defining factors for markets in the first half of 2025. They’ve caused considerable uncertainty which has affected asset prices, as well as business and consumer confidence.”
This has prompted “one of the biggest shifts in investor preferences for years”, he said, with the US – which had dominated the global stock market for an extended period – losing out as a result.
Market darling no longer
At the heart of the US market’s underperformance lies growing concern over the economic implications of president Donald Trump’s second-term trade policies, said Coatsworth.
The push for protectionism has heightened fears of a potential pullback in the pace of US economic growth as costs mount for US consumers and businesses.
“Trump wants individuals and companies in the US to stop buying from foreign sources and buy domestically, yet his trade policies are making life much more expensive for them,” Coatsworth explained.
With the consensus earnings forecast for the S&P 500 cut by 4.9% so far this year, companies like Best Buy, Target and WK Kelloggs are erring on the side of caution in their earnings updates.
“On top of this, four of the Magnificent Seven group of mega-cap tech stocks have delivered negative returns for investors so far in 2025,” he added.
This is a far cry from 2023 and 2024, when these seven companies “effectively drove the US market higher”.
|
How certain US shares have performed year-to-date |
||||
|
Meta |
16.5% |
Alphabet |
-12.0% |
|
|
Microsoft |
13.3% |
Tesla |
-20.2% |
|
|
Coca-Cola |
10.5% |
Nike |
-21.0% |
|
|
Nvidia |
7.1% |
Apple |
-19.7% |
|
|
Amazon |
-4.4% |
Salesforce |
-22.1% |
|
|
Procter & Gamble |
-5.2% |
UnitedHealth |
-40.3% |
|
Source: AJ Bell, ShareScope. Data 1 Jan to 20 Jun 2025 (total return).
To make matters worse, the World Bank has this month slashed 0.9 percentage points off its GDP forecast for the US in 2025 and Moody’s downgraded its ‘AAA’ rating.
But US equity valuations remain high with the S&P 500 on approximately 22 times forward earnings.
“Put all these negative factors in the mix and it’s easy to see why investor appetite for all things US has waned,” said Coatsworth.
From losers to winners
With the US under pressure, investors have rotated into other regions – particularly those benefitting from policy-driven growth catalysts.
Germany especially has benefitted from a renewed focus on infrastructure and defence spending after years of valuation stagnation for German equities.
“[The German government’s] pledge to spend big provides a tailwind for many companies in the DAX index, including defence contractors, construction groups and energy providers,” said Coatsworth.
In contrast, the UK market is home to companies with the defensive qualities that investors are looking for during periods of uncertainty, such as tobacco and telecoms.
The UK stock market also has a wealth of defence contractors – such as BAE Systems, which is up 65.3% year-to-date - which have attracted investor interest against a “backdrop of increased government spending on areas like cybersecurity and military forces”, Coatsworth said.
|
Top performing UK shares year-to-date (FTSE 100 stocks) |
||||
|
Fresnillo |
126.0% |
Aviva |
32.9% |
|
|
Babcock |
111.0% |
Next |
30.3% |
|
|
BAE Systems |
65.3% |
Admiral |
29.7% |
|
|
Endeavour Mining |
60.4% |
M&G |
29.2% |
|
|
Rolls-Royce |
56.1% |
Phoenix |
28.9% |
|
|
Airtel Africa |
49.8% |
Smiths |
28.3% |
|
|
Coca-Cola HBC |
41.9% |
ConvaTec |
27.9% |
|
|
Prudential |
40.4% |
St James's Place |
27.1% |
|
|
Lloyds Banking |
37.9% |
British American Tobacco |
26.4% |
|
|
BT |
33.6% |
NatWest |
26.0% |
|
Source: AJ Bell, ShareScope. Data 1 Jan to 20 Jun 2025 (total return).
Unlike the S&P 500 or DAX, the FTSE 100 remains one of the cheaper developed markets, trading at 12.5 times forward earnings.
“It means the UK still stands out when investors are looking for value opportunities in the wake of Trump’s tariff chaos,” said Coatsworth.
“It also helps that the UK has already got a trade agreement in the bag with the US, further enhancing the country’s attraction to domestic and foreign investors.”
Despite recent market turbulence, US equities have largely recovered. But while headline indices have bounced back, the recovery has taken place against a backdrop of weakening fundamentals and rising uncertainty.
President Trump’s announcement of a sweeping array of reciprocal tariffs on 2 April rocked stockmarkets globally with its magnitude and unorthodox calculation method, sending US shares tumbling. Even traditional safe havens like long-term US Treasuries sold off sharply amid crash-like trading conditions. In Trump’s own words, the bond market got a little “yippy”.
A fast rebound masks deeper fragility
It seemed, at least for a moment, that the long, sunny era of US stock market dominance might be drawing to a close. But after that early April chaos, equities staged a rapid rebound. In the face of a bond market rout, Trump blinked, and reciprocal tariffs were paused. Prices now look much like they did in March.
However, this recovery obscures a growing conflict between prices and fundamentals.
Valuations remain stretched despite rising uncertainty
US equities still trade at a 30% premium to international markets – priced at around 20 times expected earnings versus 15 times for their international peers. That’s if you believe consensus earnings expectations, which have barely budged. Estimates for US earnings this year fell just 1% in April. In our view, that looks like wishful thinking.
While policy pivots and trade negotiations may have calmed some nerves, the broader environment has already shifted. Confidence is plummeting among consumers and businesses, while both worry about inflation and uncertainty. Whereas predicting the policy path is a fool’s game, we do not need to predict that uncertainty is high – it just is. That isn’t going away soon, and uncertainty has its own effects. Uncertainty is bad for business. It dampens spending and delays investment.
Fundamentals appear to be deteriorating, but prices have yet to follow.
A cautionary tale for investors
In response, investors typically grow more cautious. With less confidence in fundamental outcomes, investors need more compensation for taking risk, so they are willing to pay less today for the promise of tomorrow’s profits. This seems to be the mindset of professionals, but a rush of money into speculative assets suggests that retail investors are still bullish.
For some time, we have believed that US stock market returns had become overly reliant on “great expectations”. Instead, we think the opportunity set looks more attractive beyond the US, in companies where expectations and valuations are both lower. Companies outside the US may find themselves in a much better environment. Starting valuations are cheaper, their governments can stimulate, and their central banks can cut interest rates.
Despite all that has transpired, markets still appear to believe in American exceptionalism. However, in our view, the idea that US companies can deliver strong earnings growth amid rising geopolitical risks, unpredictable policy, and weakening global demand now looks increasingly tenuous.
Stefan Sommerville is an investment specialist at Orbis Investments. The views expressed above should not be taken as investment advice.
Nick Train, Gervais Williams, Alexandra Jackson and other UK managers state their cases for large-, mid- and small-caps.
UK managers are unable to agree on where the best opportunities are in the market with votes of confidence all the way down the capitalisation spectrum.
Interest in the UK has made a comeback this year, with the FTSE All Share up 9% in 2025 so far while the MSCI AC World index is down 1%. However, performance has varied depending on market capitalisation.
As demonstrated by the chart below, while the FTSE 100 is up 9.8% the Deutsche Numis Smaller Companies is up 5.3% and the FTSE 250 is up just 4%.
Performance of the indices year-to-date
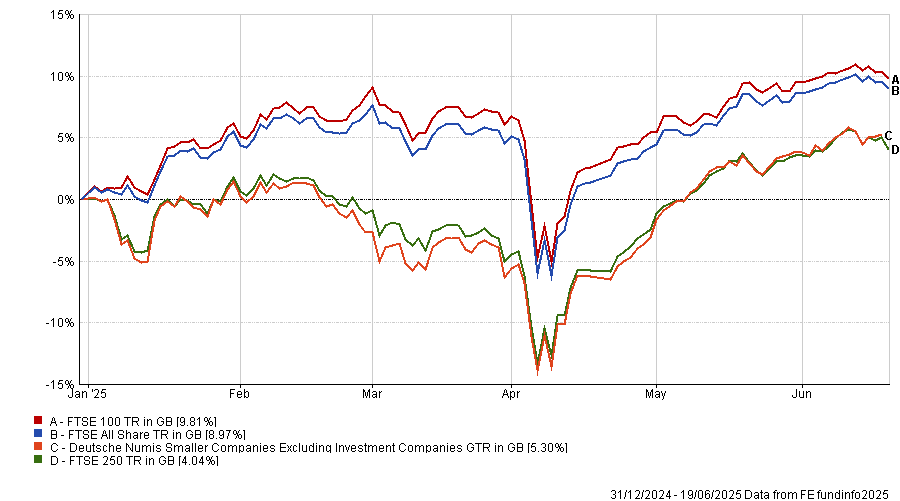
Source: FE Analytics.
For some experts, large-caps are the clear place to be. However, for others, mid-caps and micro-caps are better plays on the domestic economy that can outperform over the long term.
Below, Trustnet asks UK managers which market capitalisation offers the most interesting opportunities.
Nick Train, manager of the Finsbury Growth and Income Trust, highlighted the FTSE 100 as his favoured market cap area, with 90% of the portfolio invested in it.
Investors are “underestimating the potential” of large-cap companies, particularly data and software businesses, such as the London Stock Exchange Group, Sage and Experian. These companies are still solid businesses that will take further market share as they expand into artificial intelligence and other analytical tools.
While share prices have been volatile recently, Train noted that all delivered positive returns over a “turbulent five years”, demonstrating the strength of these companies. Sage has even outperformed the FTSE All Share over this period, as seen in the chart below.
Total return of stocks over the past 5yrs
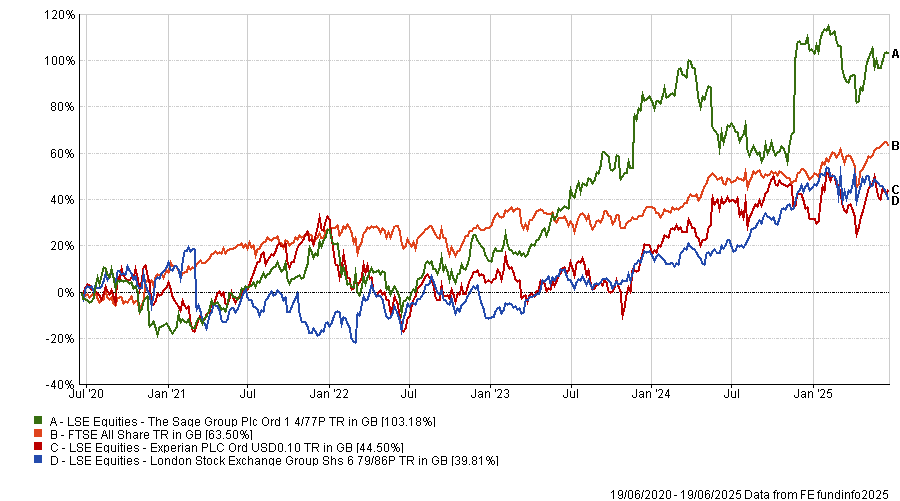
Source: FE Analytics.
Artemis Income’s Nick Shenton and Andy Marsh also like large-caps, but favoured the lower half of the FTSE 100.
“We think there’s a sweet spot of underappreciated businesses at the lower end of the FTSE 100, around the £8bn market-cap range,” Shenton explained. This area is full of “differentiated businesses with global scope”, which are still small enough to grow at an impressive rate.
For example, they pointed to Informa as one of the “best collections of assets in the world”, as one that still has long-term potential.
By contrast, they argued it was challenging to find businesses with the ability to scale while enjoying global leadership further down the market-cap spectrum. “There’s this misconception about the UK mid- and small-caps space that it’s some sort of El Dorado of returns, but it's not the case over time,” Shenton said.
Data seems to support this, with the FTSE 100 up 68.2% over the past five years, compared to the FTSE 250 (56.4%) and Deutsche Numis Smaller Companies (37.4%) indices.
Performance of the indices over the past 5yrs
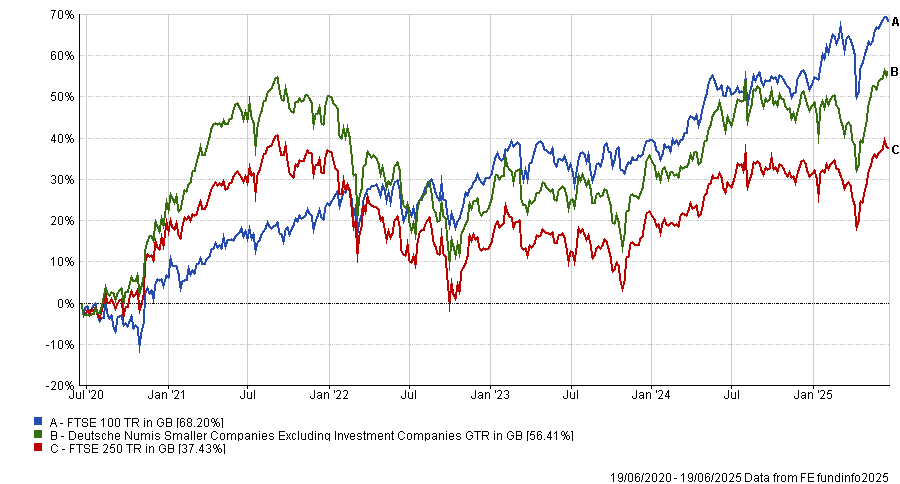
Source: FE Analytics.
However, not all experts agreed. For Alexandra Jackson, manager of the Rathbones UK Opportunities fund, mid-caps will prove themselves the best place to invest in the long term.
In contrast to the FTSE 100, Jackson argued mid-caps’ larger domestic focus is one of their biggest tailwinds. With the dollar depreciating, the sterling looks much stronger, which will “typically benefit” domestic mid-caps more than international large-caps that derive a large portion of their revenues in other currencies.
Additionally, FTSE 250 companies are expecting higher earnings growth this year than the FTSE 100, as they expand from a lower base. It means investors can find quality names with high returns on capital in the mid-cap space that could compete with larger companies, she concluded.
For Gervais Williams, head of UK equities at Premier Miton, “micro-caps continue to be the best area for active UK investors”.
He argued that the UK micro-cap space is full of stocks that generate abnormally strong returns over the long term, even compared to mainstream names. The data seems to support this, with micro-caps and small-caps outperforming the rest of the market over the past 15 years, despite recent underperformance.
Performance of indices over the past 15yrs
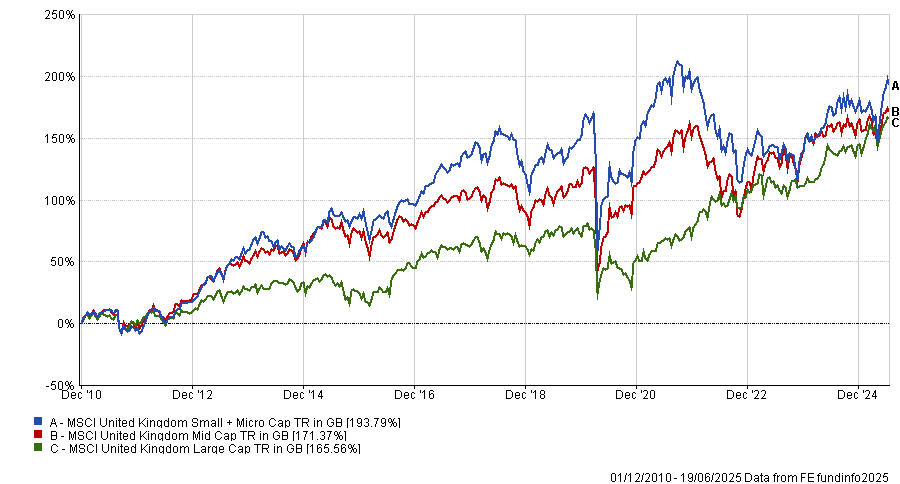
Source: FE Analytics
For an historic example of this he highlighted retailer Next. In 1991, it was a micro-cap worth just £50m, but it has surged in value over the past three decades, entering the FTSE 100 and becoming a mainstay in the UK market.
Today, there are also plenty of stocks in the micro-cap space that can take advantage of larger structural trends as Next once did.
Concurrent technologies is up 86.9% over the past year, capitalising on the increased push for defence due to heightened geopolitical tensions.
With a market capitalisation of around £171m, it would be passed over by investors looking further up the market-cap spectrum, despite being “one of the UK’s most exciting defence stocks”.
The $52bn firm is offering access to its value-oriented mid-cap investment strategy.
Dallas-based Barrow Hanley has launched its US Mid Cap Value Equity fund in the UK.
The fund targets mid-sized US companies with below-market valuations, improving fundamentals and asymmetric return profiles. It is benchmark-agnostic, highly concentrated and constructed with high active share.
Barrow Hanley US Mid Cap Value aims to outperform the Russell Mid Cap Value index over a full market cycle. It maintains a consistent approach with virtually no style drift, focusing on exploiting inefficiencies in the less-covered mid-cap universe.
Its management team have extensive experience across market cycles and its approach emphasises disciplined stock selection and a valuation-centric philosophy.
Mark Giambrone, head of US equities and portfolio manager at Barrow Hanley, said: “Our strategy is built on a foundation of rigorous fundamental research and a commitment to identifying undervalued companies with strong potential for growth.
“We believe that mid cap stocks offer a unique 'sweet spot' in terms of risk and return and we look forward to helping UK investors achieve their financial goals through this fund.”
Barrow Hanley is a subsidiary of Perpetual Group. Warren Tonkinson, head of international distribution at Perpetual, noted the firm’s established UK presence and highlighted Barrow Hanley’s exclusive focus on value investing.
He said the fund is designed to provide diversification and attractive risk-adjusted returns, helping investors recover more strongly from market downturns.
Barrow Hanley specialises in value investing across equities and fixed income. As of 31 March 2025, the firm managed $52bn in assets and employed 98 staff, including 57 investment professionals.
NS&I will reduce the Premium Bonds prize fund rate from the August 2025 draw.
NS&I is cutting the Premium Bonds prize fund rate to 3.6% effective in August 2025, down from its current 3.8%.
The August draw is expected to total approximately £396.7m. This is nearly £20m lower when compared with June, although the number of prizes will rise slightly to over 6 million.
The odds of winning will remain unchanged at 22,000 to 1 for each £1 bond.
Greig Bingham, head of financial modelling at Broadstone, said: “The odds have shifted towards a greater likelihood of winning at the smaller end of the scale meaning the average effective return will dip slightly. For example, over 80% of the 6 million prizes expected in August will be for £25, £50 or £100. This means the average effective return will dip slightly.
“This will be disappointing for savers and another reminder that, as interest rates fall, people will need to work harder to put their cash to work and earn attractive returns.”
Number and value of Premium Bonds prizes
|
Value of prizes |
Number and total value of prizes in June 2025 |
Number and total value of prizes in August 2025 (estimate) |
|
£1,000,000 |
2 |
2 |
|
£100,000 |
79 |
75 |
|
£50,000 |
159 |
151 |
|
£25,000 |
317 |
302 |
|
£10,000 |
792 |
754 |
|
£5,000 |
1,585 |
1,507 |
|
£1,000 |
16,649 |
15,869 |
|
£500 |
49,947 |
47,607 |
|
£100 |
1,853,552 |
1,687,680 |
|
£50 |
1,853,552 |
1,687,680 |
|
£25 |
2,197,831 |
2,569,568 |
|
Total: |
5,974,465 £416,221,075 |
6,011,195 £396,738,700 |
Source: NS&I
Andrew Westhead, NS&I retail director, said the change was the first since April and “reflects the changing landscape for savings”.
“Premium Bonds maintain their unique appeal by offering complete security backed by HM Treasury, the flexibility to withdraw easily and the excitement of potentially winning a tax-free prize each month,” he added.
“By making this adjustment now, we’re able to continue to balance the interests of savers, taxpayers and the stability of the broader financial services sector.”
Premium Bonds, launched in 1956, do not pay interest but instead offer a chance to win monthly tax-free prizes ranging from £25 to £1m. Each bond must be held for one full calendar month before qualifying for the draw.
Savers can hold up to £50,000 in bonds, which are fully backed by HM Treasury. Prizes are typically paid directly into a bank account or reinvested into new bonds.
Trustnet looks at last week’s market movements to find out what is being impacted by Israel’s strikes on Iran.
The market calm following Israel’s attack on Iran looks more fragile than it first appears, with the performance of global equities being propped up by a handful of sectors and countries, Trustnet analysis suggests.
This morning, Israel and Iran appear to have agreed to a ceasefire after 12 days of war. Both countries exchanged heavy fire overnight, before it came into effect.
Israel began Operation Rising Lion on 13 June, striking over a dozen sites across Iran, including nuclear facilities in Natanz, Isfahan, Parchin and Tehran. The operation targeted nuclear enrichment sites and eliminated Islamic Revolutionary Guard Corps commanders, marking the most direct Israeli action against Iran since April 2024.
Iran responded with Operation True Promise III on 15–16 June, launching hundreds of ballistic missiles and drones at Israeli cities, military bases and a hospital in Beersheba. Although Israel intercepted the majority of projectiles, several strikes caused civilian deaths and disrupted oil facilities.
The conflict escalated with continued Israeli airstrikes on Iranian command centres and infrastructure in Tehran. Diplomatic talks, including efforts in Oman, broke down amid the attacks.
Russia and China condemned Israel’s offensive and Gulf states voiced concern about regional instability, while European governments called for de-escalation. The US initially backed diplomacy, then shifted to threats against Iran before later moving toward military engagement.
On 21 June, US president Donald Trump authorised Operation Midnight Hammer. US bombers, submarines and jets struck Iran’s nuclear facilities at Natanz, Fordow and Isfahan using bunker-buster munitions.
The US administration said the strikes severely damaged Iran’s underground enrichment facilities. Iran placed its forces on high alert and warned of new retaliation, including possible action against US bases and shipping in the Strait of Hormuz.
But despite the tumultuous geopolitical events, markets have appeared calm on the surface. Below, Trustnet takes a closer look at how the markets reacted in the first week after Operation Rising Lion.
Performance of asset classes in the week following Israel’s attack on Iran
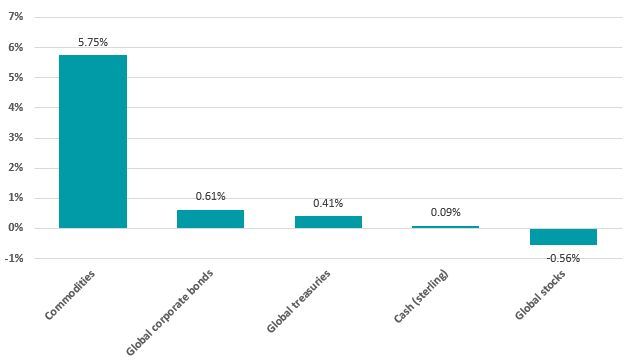
Source: FinXL. Total return in sterling between 13 and 20 Jun 2025.
The first wave of market response to Israel’s military strikes on Iran has been clearest in commodities, with the broad S&P GSCI index gaining 5.75% over the week. This sharp move reflects an immediate pricing-in of geopolitical risk to energy supply chains, particularly as key Middle Eastern infrastructure came under threat.
Elsewhere, investors rotated modestly into fixed income, with global corporate bonds and treasuries gaining ground. Equities, by contrast, fell only 0.56% globally, which seems a relatively muted decline but masks more significant cross-sector and cross-market divergence, which becomes clearer in the following charts.
Danni Hewson, head of financial analysis at AJ Bell, said: “It’s at times like these that investors must wish they had some kind of crystal ball to gaze into, but in the absence of such a magical mechanism a ‘wait and see’ approach could be the most logical choice.
“Markets were muted as investors waited for Iran’s response to America’s military move, but so far it seems most aren’t ready to price in a full-scale conflict.”
Performance of commodities in the week following Israel’s attack on Iran
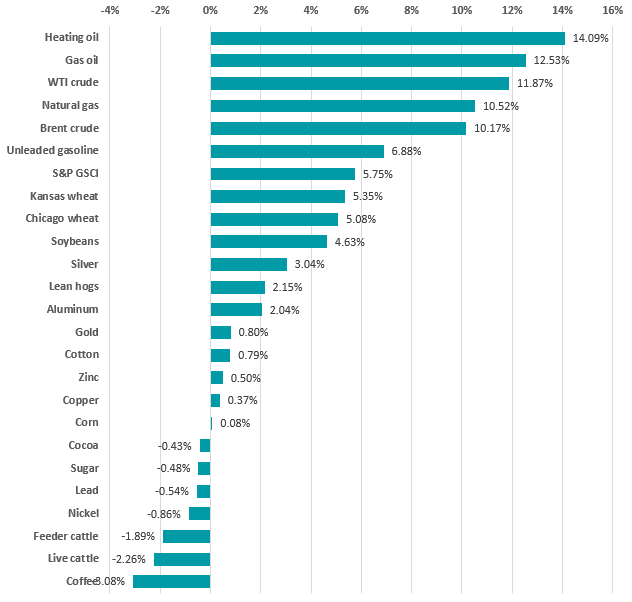
Source: FinXL. Total return in sterling between 13 and 20 Jun 2025.
The rally in commodities last week was driven almost entirely by a spike in energy prices, with heating oil, gas oil, crude oil and natural gas all posting double-digit gains. These moves reflect market fears of direct supply disruptions in the Middle East and potential retaliatory attacks on regional infrastructure or shipping routes, particularly through the Strait of Hormuz.
Industrial metals and agricultural products were mixed or down, underscoring that the price action is geopolitical in nature, not cyclical. The differentiation within the asset class suggests investors are not betting on a global demand surge but pricing in a higher probability of conflict-related supply shocks.
Performance of equity sectors in the week following Israel’s attack on Iran
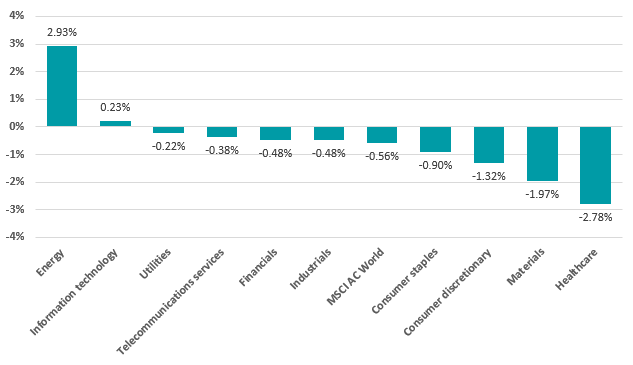
Source: FinXL. Total return in sterling between 13 and 20 Jun 2025.
Global equities may have shown only a modest decline overall, but the sector breakdown reveals far greater stress beneath the surface. Energy was the standout, rising nearly 3% and effectively masking broader weakness, with economically sensitive and defensive sectors alike such as consumer staples, healthcare and materials posting sharp losses. Information technology stocks also rose, albeit slightly.
The leadership of energy stocks reflects not just rising oil prices but also a rotation into perceived geopolitical hedges, while losses in healthcare and consumer names suggest risk-off positioning extending beyond the obvious names.
Performance of investment factors in the week following Israel’s attack on Iran
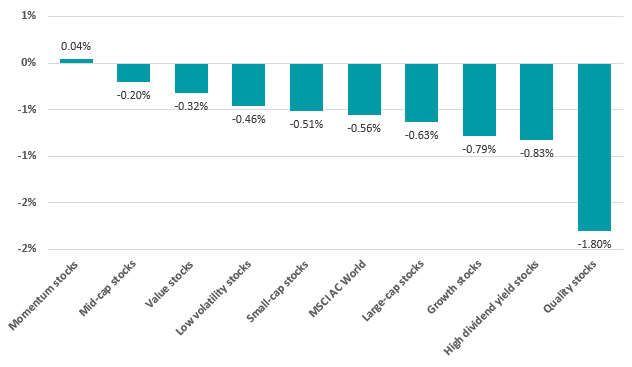
Source: FinXL. Total return in sterling between 13 and 20 Jun 2025.
Factor performance over the week further underscores how unusual and reactive the market environment has become. Momentum stocks made marginally positive returns, likely buoyed by their exposure to tech stocks, while quality stocks (typically seen as safe havens) posted the worst returns, down nearly 2%.
The underperformance of high-dividend, low-volatility and quality names implies a shift away from defensive consensus trades.
Performance of MSCI AC World countries in the week following Israel’s attack on Iran
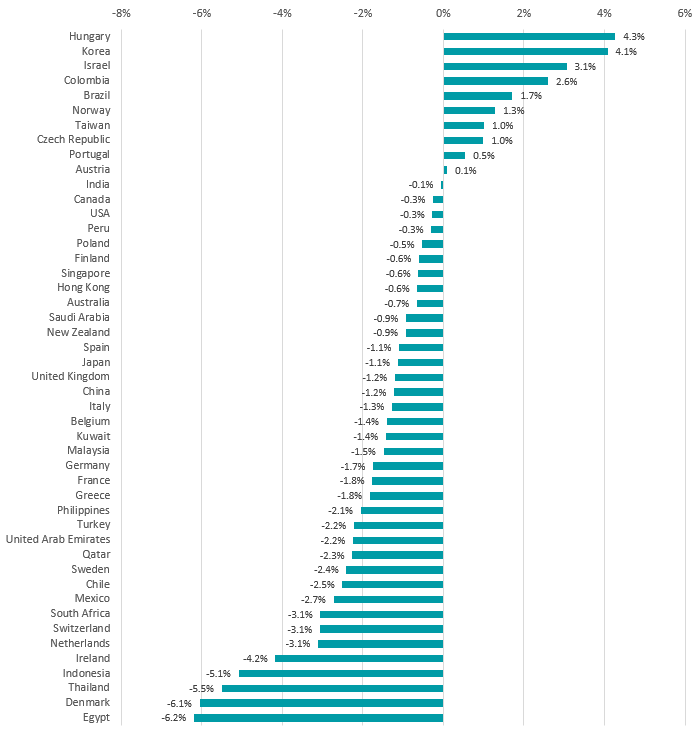
Source: FinXL. Total return in sterling between 13 and 20 Jun 2025
The country breakdown reinforces that last week’s equity weakness was broad-based, with the majority of MSCI AC World constituents making negative returns. Egypt, Denmark and Thailand led the declines – each down more than 5% – while only a handful of markets, like Hungary, Korea and Israel, managed gains.
The wider picture is one of global de-risking, with steep drawdowns in both developed and emerging markets pointing to a reaction to geopolitical uncertainty rather than isolated idiosyncratic moves.
Performance of Investment Association fund sectors in the week following Israel’s attack on Iran

Source: FinXL. Total return in sterling between 13 and 20 Jun 2025
Commodity funds were the clear winners last week, with the IA Commodity/Natural Resources sector returning nearly 1%. This aligns with the sharp upward move in energy prices, as investors quickly repositioned around a risk premium on Middle Eastern supply disruption.
Bond and money market funds also saw modest positive returns, suggesting a measured flight to safety. US government bond and mixed bond sectors led fixed income gains.
Equity fund sectors, by contrast, showed widespread weakness, with the worst hit areas being those with regional concentration in Europe and healthcare exposure. The IA Europe Excluding UK sector lost nearly 2%, and IA Healthcare was down 1.85%, highlighting how risk-off sentiment extended across both cyclical and defensive allocations.
The depth of negative returns across regional equity funds reflects the global de-risking trend noted above. UK, Japan, China and global equity income strategies all underperformed, suggesting the volatility wasn’t confined to geopolitically sensitive geographies but instead reflected a repricing of global equity risk as a whole.
The information contained within this website is provided by Allfunds Digital, S.L.U. acting through its business division Digital Look Ltd unless otherwise stated. The information is not intended to be advice or a recommendation to buy, sell or hold any of the shares, companies or investment vehicles mentioned, nor is it information meant to be a research recommendation. This is a solution powered by Allfunds Digital, S.L.U. acting through its business division Digital Look Ltd incorporating their prices, data news, charts, fundamentals and investor tools on this site. Terms and conditions apply. Prices and trades are provided by Allfunds Digital, S.L.U. acting through its business division Digital Look Ltd and are delayed by at least 15 minutes.
© 2025 Refinitiv, an LSEG business. All rights reserved.
 Please wait...
Barclays Investment Solutions Limited provides wealth and investment products and services (including the Smart Investor investment services) and is authorised and regulated by the Financial Conduct Authority and is a member of the London Stock Exchange and NEX. Registered in England. Registered No. 2752982. Registered Office: 1 Churchill Place, London E14 5HP.
Barclays Bank UK PLC provides banking services to its customers and is authorised by the Prudential Regulation Authority and regulated by the Financial Conduct Authority and the Prudential Regulation Authority (Financial Services Register No. 759676). Registered in England. Registered No. 9740322. Registered Office: 1 Churchill Place, London E14 5HP.